| Param | Original file | Final file |
|---|---|---|
| Filename | modeM0/AS1T03_194T01_9000003620_24710cztM0_level2.evt | modeM0/AS1T03_194T01_9000003620_24710cztM0_level2_quad_clean.evt |
| Size (bytes) | 658,604,160 | 106,672,320 |
| Size | 628.1 MB | 101.7 MB |
| Events in quadrant A | 4,283,407 | 714,619 |
| Events in quadrant B | 3,622,472 | 720,443 |
| Events in quadrant C | 6,818,024 | 658,923 |
| Events in quadrant D | 4,769,371 | 669,350 |
| Mode M9 | |||
|---|---|---|---|
| Quadrant | BADHDUFLAG | Total packets | Discarded packets |
| A | 0 | 19 | 0 |
| B | 0 | 20 | 0 |
| C | 0 | 20 | 0 |
| D | 0 | 20 | 0 |
| Mode M0 | |||
|---|---|---|---|
| Quadrant | BADHDUFLAG | Total packets | Discarded packets |
| A | 0 | 16782 | 2 |
| B | 0 | 14919 | 2 |
| C | 0 | 25127 | 2 |
| D | 0 | 18664 | 3 |
| Mode SS | |||
|---|---|---|---|
| Quadrant | BADHDUFLAG | Total packets | Discarded packets |
| A | 0 | 136 | 0 |
| B | 0 | 136 | 0 |
| C | 0 | 136 | 0 |
| D | 0 | 136 | 0 |
| Quadrant | Total seconds | Saturated seconds | Saturation percentage |
|---|---|---|---|
| A | 6704 | 244 | 3.639618% |
| B | 6704 | 148 | 2.207637% |
| C | 6704 | 412 | 6.145585% |
| D | 6703 | 174 | 2.595853% |
Noise dominated data is calculated using 1-second bins in cleaned event files. If a bin has >2000 counts, and if more than 50% of those come from <1% of pixels, then it is considered to be noise-dominated and hence unusable.
| Quadrant | # 1 sec bins | Bins with >0 counts | Bins with >2000 counts | High rate bins dominated by noise | Noise dominated (total time) | Noise dominated (detector-on time) | Marked lightcurve |
|---|---|---|---|---|---|---|---|
| A | 7849 | 6704 | 140 | 140 | 1.78% | 2.09% | 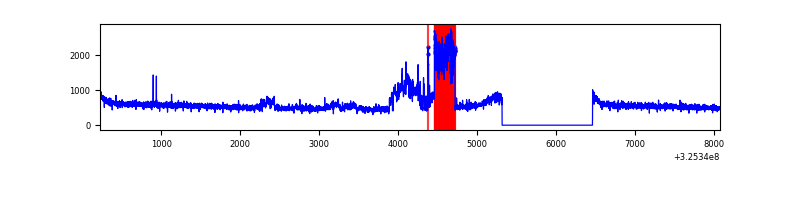 |
| B | 7849 | 6704 | 4 | 4 | 0.05% | 0.06% | 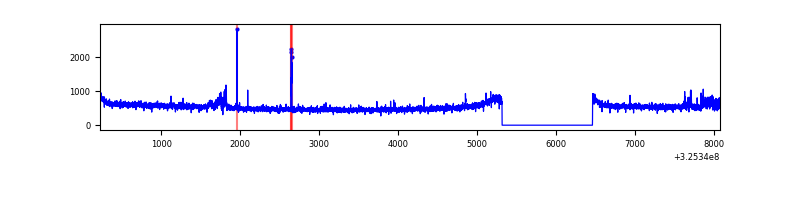 |
| C | 7849 | 6704 | 5 | 5 | 0.06% | 0.07% | 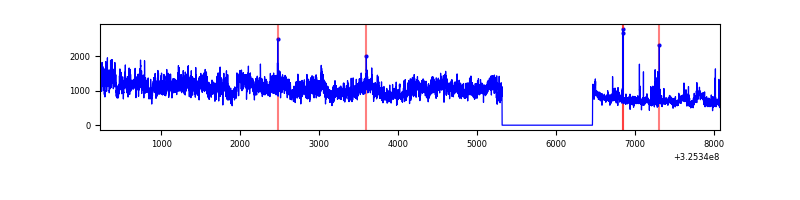 |
| D | 7848 | 6703 | 83 | 83 | 1.06% | 1.24% | 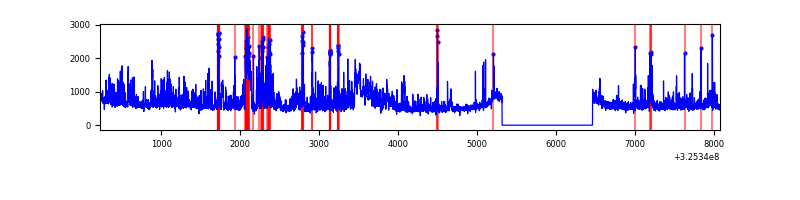 |
Top three noisy pixels from each quadrant. If the there are fewer than three noisy pixels in the level2.evt file, extra rows are filled as -1
| Pixel properties | Quadrant properties | ||||||
|---|---|---|---|---|---|---|---|
| Quadrant | DetID | PixID | Counts | Sigma | Mean | Median | Sigma |
| A | 3 | 1 | 757605 | 4167.01 | 913 | 895 | 181.6 |
| A | 13 | 254 | 10296 | 51.77 | 913 | 895 | 181.6 |
| A | 10 | 255 | 9784 | 48.95 | 913 | 895 | 181.6 |
| B | 0 | 230 | 99609 | 581.68 | 893 | 873 | 169.7 |
| B | 3 | 64 | 20729 | 116.98 | 893 | 873 | 169.7 |
| B | 12 | 111 | 20317 | 114.55 | 893 | 873 | 169.7 |
| C | 7 | 247 | 3229173 | 16398.04 | 852 | 858 | 196.9 |
| C | 14 | 238 | 135101 | 681.88 | 852 | 858 | 196.9 |
| C | 2 | 16 | 93100 | 468.54 | 852 | 858 | 196.9 |
| D | 1 | 52 | 1061000 | 4955.51 | 888 | 864 | 213.9 |
| D | 12 | 233 | 211776 | 985.89 | 888 | 864 | 213.9 |
| D | 8 | 195 | 135424 | 628.99 | 888 | 864 | 213.9 |
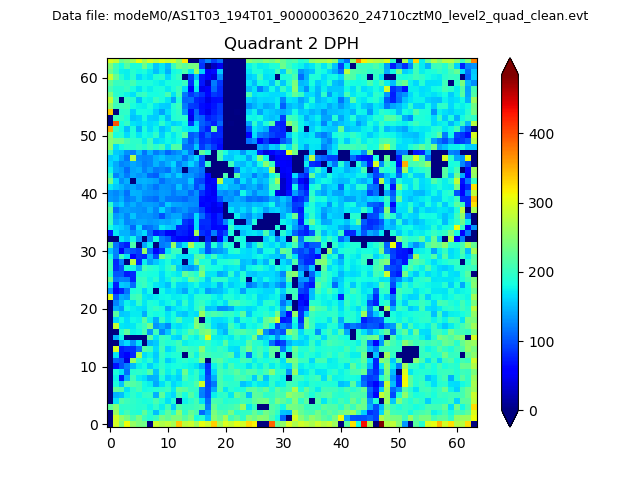
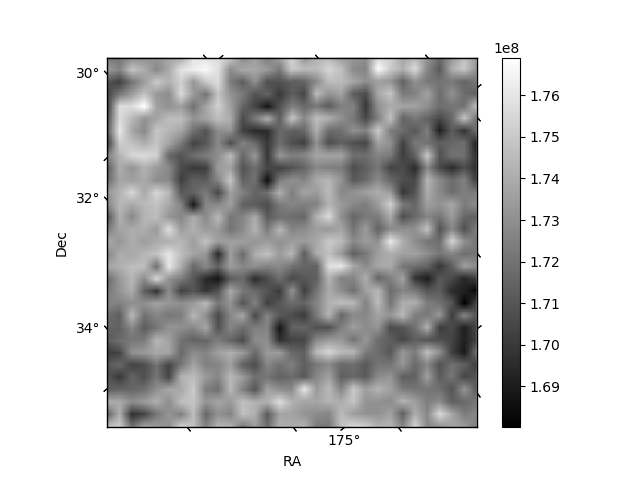
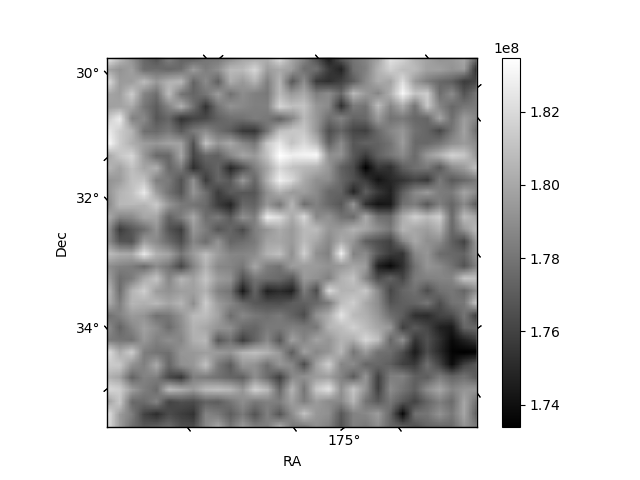
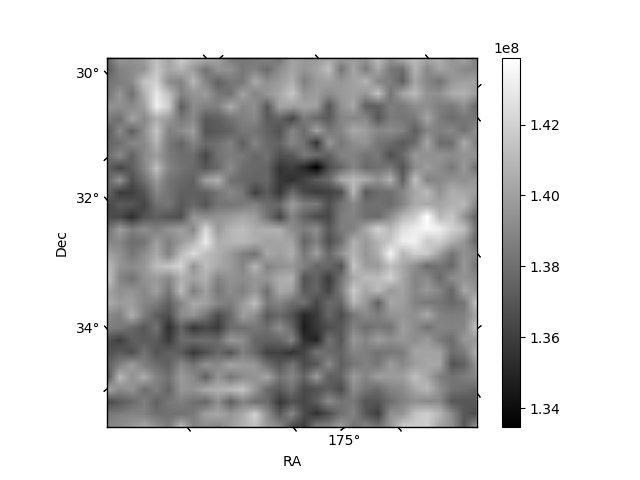
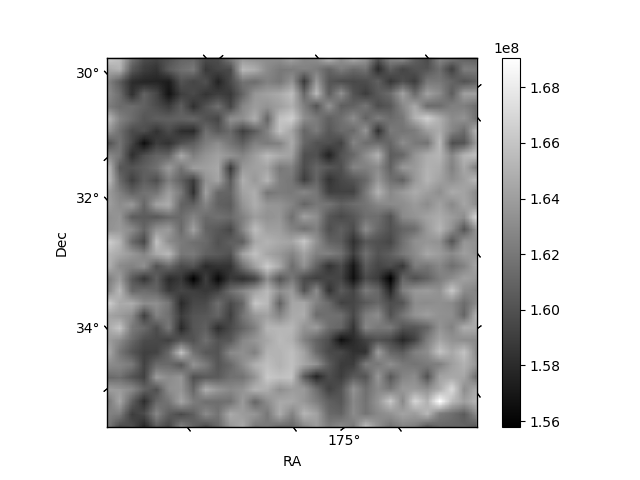
Histogram calculated using DETX and DETY for each event in the final _common_clean file
| Quadrant A | 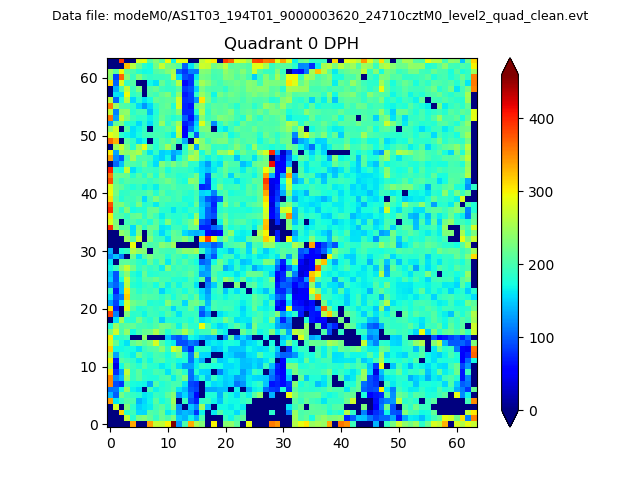 |
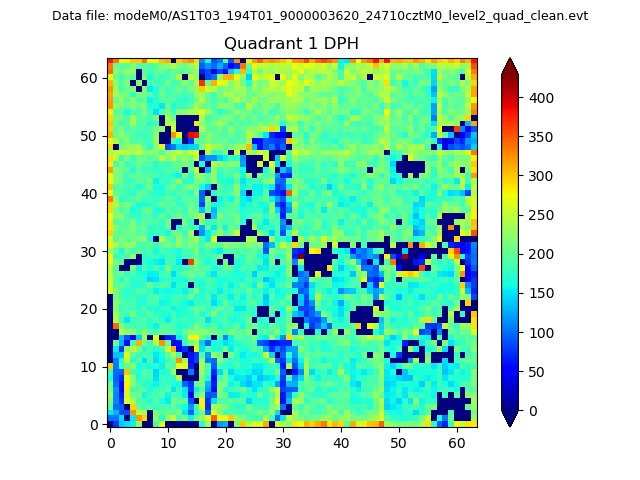 |
Quadrant B |
|---|---|---|---|
| Quadrant D | 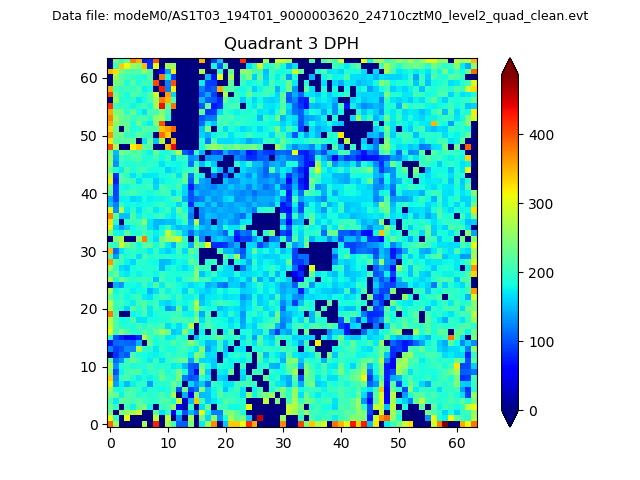 |
 |
Quadrant C |
| Plot type | Count rate plots | Images |
|---|---|---|
| Comparison with Poisson distribution Blue bars denote a histogram of data divided into 1 sec bins. Red curve is a Poisson curve with rate = median count rate of data. |
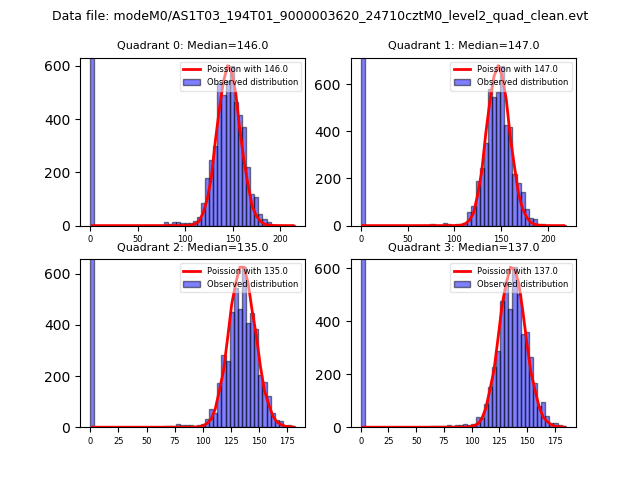 |
 |
| Quadrant-wise count rates Data is divided into 100 sec bins |
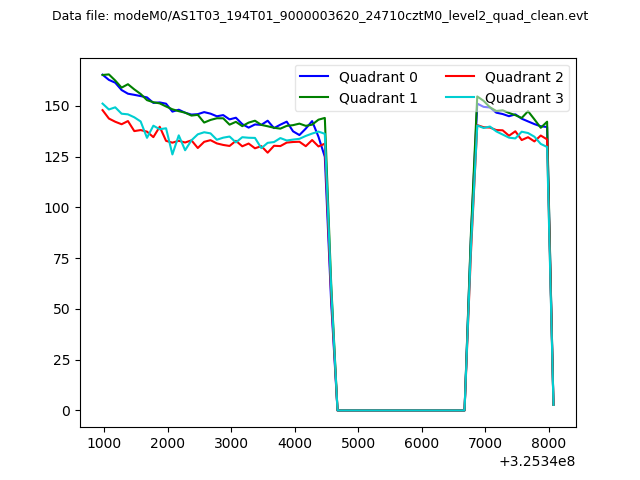 |
|
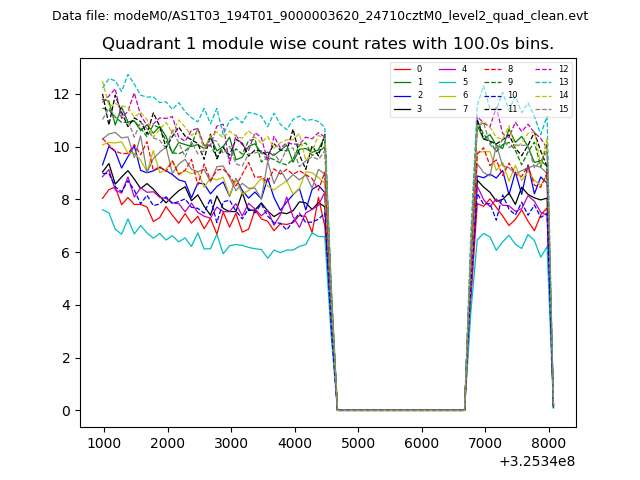
| Module-wise count rates for Quadrant A Data is divided into 100 sec bins |
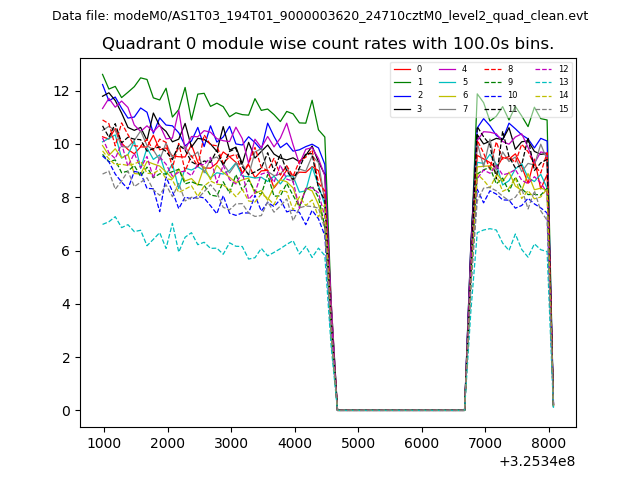 |
 |
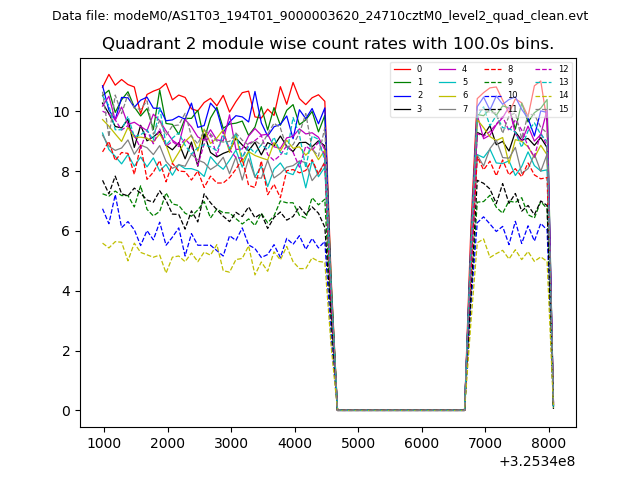
| Module-wise count rates for Quadrant B Data is divided into 100 sec bins |
 |
 |
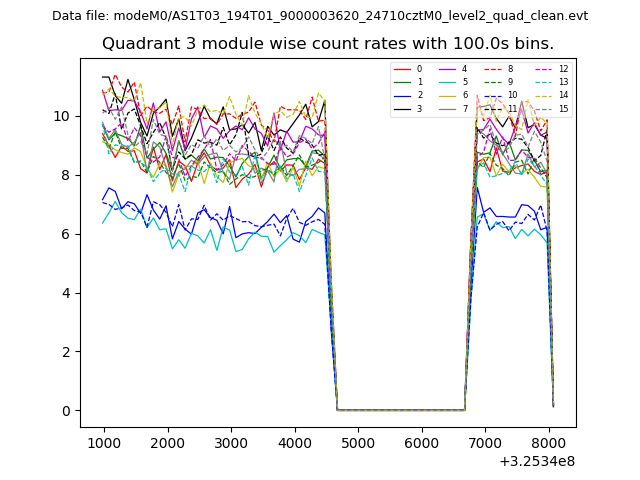
| Module-wise count rates for Quadrant C Data is divided into 100 sec bins |
 |
 |
| Module-wise count rates for Quadrant D Data is divided into 100 sec bins |
 |
 |
| Parameter | Plot |
|---|---|
| CZT HV Monitor | 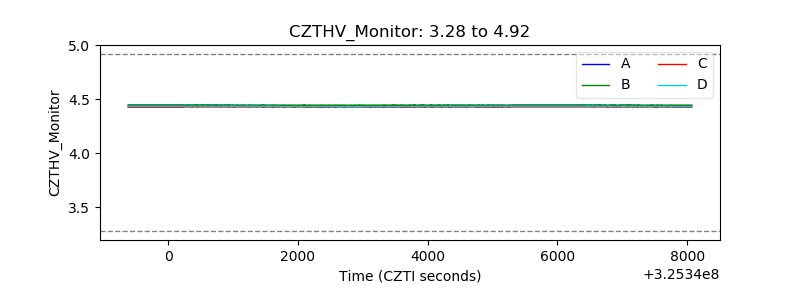 |
| D_VDD |  |
| Temperature 1 | 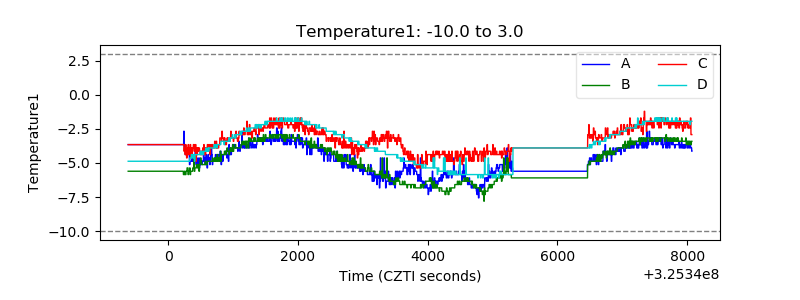 |
| Veto HV Monitor | 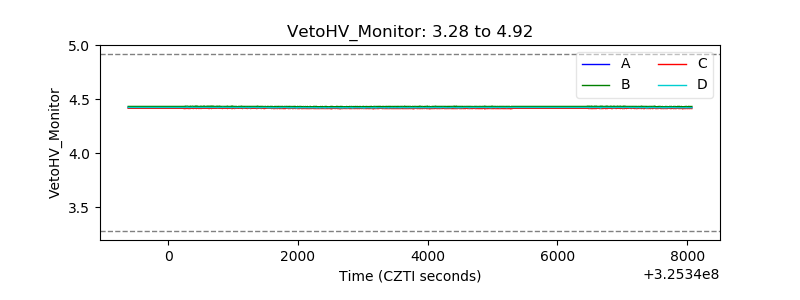 |
| Veto LLD | 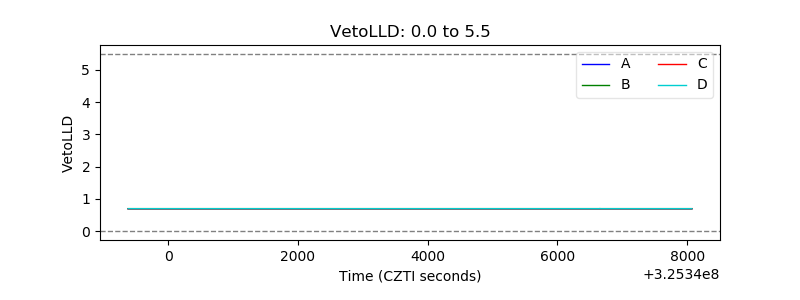 |
| Alpha Counter | 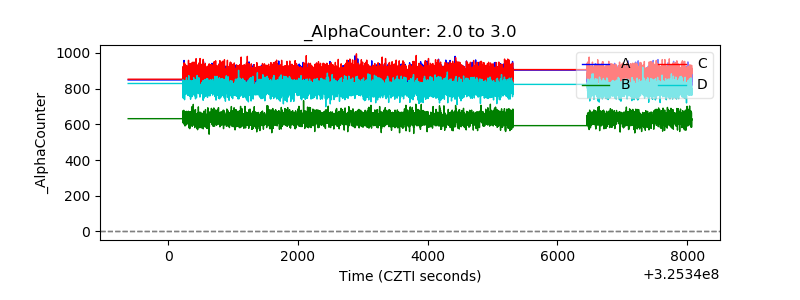 |
| _CPM_Rate | 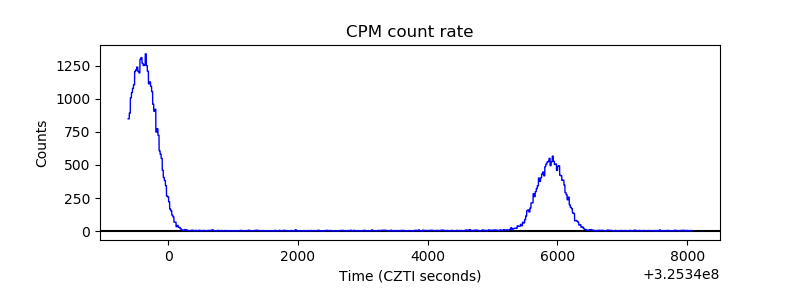 |
| CZT Counter |  |
| +2.5 Volts monitor |  |
| +5 Volts monitor |  |
| _ROLL_ROT | 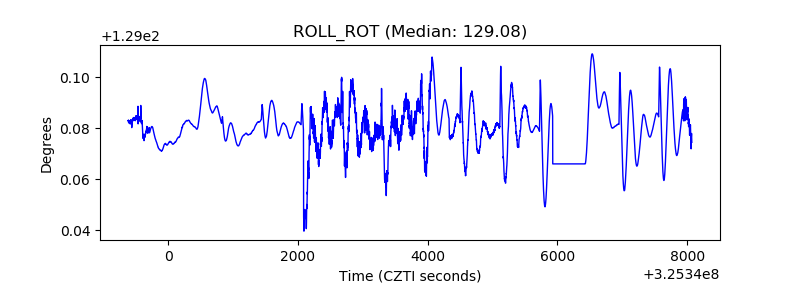 |
| _Roll_DEC | 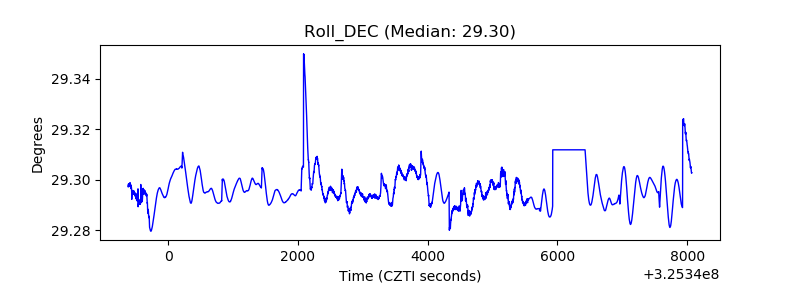 |
| _Roll_RA | 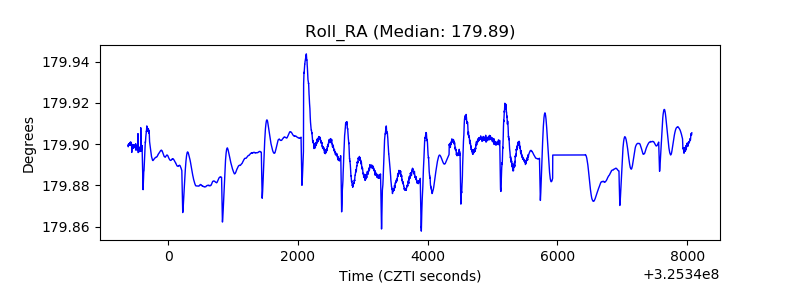 |
| Veto Counter | 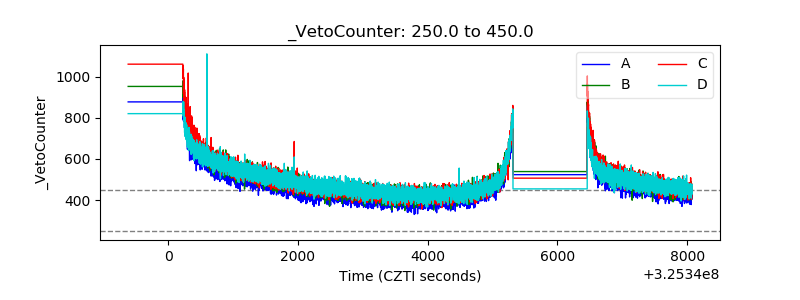 |