| Param | Original file | Final file |
|---|---|---|
| Filename | modeM0/AS1T03_194T01_9000003620_24712cztM0_level2.evt | modeM0/AS1T03_194T01_9000003620_24712cztM0_level2_quad_clean.evt |
| Size (bytes) | 550,100,160 | 99,267,840 |
| Size | 524.6 MB | 94.7 MB |
| Events in quadrant A | 3,443,785 | 647,449 |
| Events in quadrant B | 3,712,990 | 646,922 |
| Events in quadrant C | 5,295,341 | 609,014 |
| Events in quadrant D | 3,727,737 | 609,982 |
| Mode M9 | |||
|---|---|---|---|
| Quadrant | BADHDUFLAG | Total packets | Discarded packets |
| A | 0 | 4 | 0 |
| B | 0 | 4 | 0 |
| C | 0 | 4 | 0 |
| D | 0 | 4 | 0 |
| Mode M0 | |||
|---|---|---|---|
| Quadrant | BADHDUFLAG | Total packets | Discarded packets |
| A | 0 | 14728 | 1 |
| B | 0 | 15568 | 1 |
| C | 0 | 21080 | 2 |
| D | 0 | 15717 | 1 |
| Mode SS | |||
|---|---|---|---|
| Quadrant | BADHDUFLAG | Total packets | Discarded packets |
| A | 0 | 144 | 0 |
| B | 0 | 144 | 0 |
| C | 0 | 144 | 0 |
| D | 0 | 144 | 0 |
| Quadrant | Total seconds | Saturated seconds | Saturation percentage |
|---|---|---|---|
| A | 7076 | 115 | 1.625212% |
| B | 7077 | 137 | 1.935849% |
| C | 7076 | 224 | 3.165630% |
| D | 7076 | 129 | 1.823064% |
Noise dominated data is calculated using 1-second bins in cleaned event files. If a bin has >2000 counts, and if more than 50% of those come from <1% of pixels, then it is considered to be noise-dominated and hence unusable.
| Quadrant | # 1 sec bins | Bins with >0 counts | Bins with >2000 counts | High rate bins dominated by noise | Noise dominated (total time) | Noise dominated (detector-on time) | Marked lightcurve |
|---|---|---|---|---|---|---|---|
| A | 7481 | 7076 | 0 | 0 | 0.00% | 0.00% | 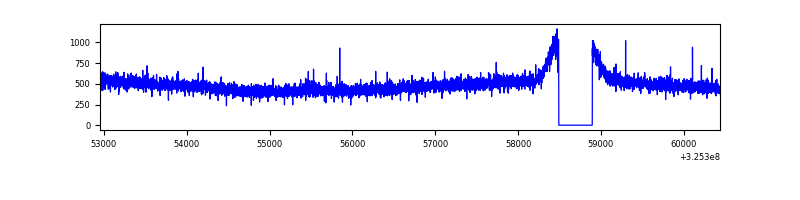 |
| B | 7482 | 7077 | 2 | 2 | 0.03% | 0.03% | 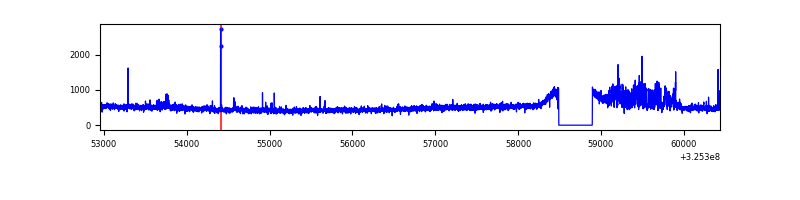 |
| C | 7481 | 7076 | 3 | 3 | 0.04% | 0.04% | 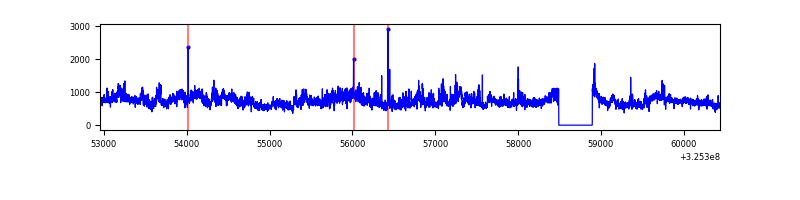 |
| D | 7481 | 7076 | 4 | 4 | 0.05% | 0.06% |  |
Top three noisy pixels from each quadrant. If the there are fewer than three noisy pixels in the level2.evt file, extra rows are filled as -1
| Pixel properties | Quadrant properties | ||||||
|---|---|---|---|---|---|---|---|
| Quadrant | DetID | PixID | Counts | Sigma | Mean | Median | Sigma |
| A | 13 | 254 | 11369 | 57.88 | 892 | 872 | 181.4 |
| A | 3 | 137 | 8374 | 41.36 | 892 | 872 | 181.4 |
| A | 0 | 226 | 7594 | 37.06 | 892 | 872 | 181.4 |
| B | 0 | 230 | 219825 | 1277.57 | 878 | 857 | 171.4 |
| B | 4 | 80 | 22283 | 125.01 | 878 | 857 | 171.4 |
| B | 12 | 111 | 21191 | 118.64 | 878 | 857 | 171.4 |
| C | 7 | 247 | 1697611 | 8456.92 | 849 | 856 | 200.6 |
| C | 14 | 238 | 132596 | 656.62 | 849 | 856 | 200.6 |
| C | 2 | 16 | 81546 | 402.17 | 849 | 856 | 200.6 |
| D | 1 | 52 | 176632 | 826.63 | 870 | 845 | 212.7 |
| D | 8 | 195 | 171451 | 802.27 | 870 | 845 | 212.7 |
| D | 7 | 238 | 69444 | 322.58 | 870 | 845 | 212.7 |
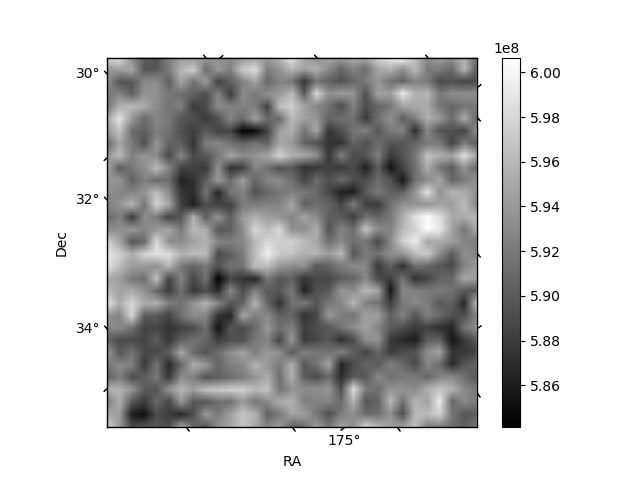
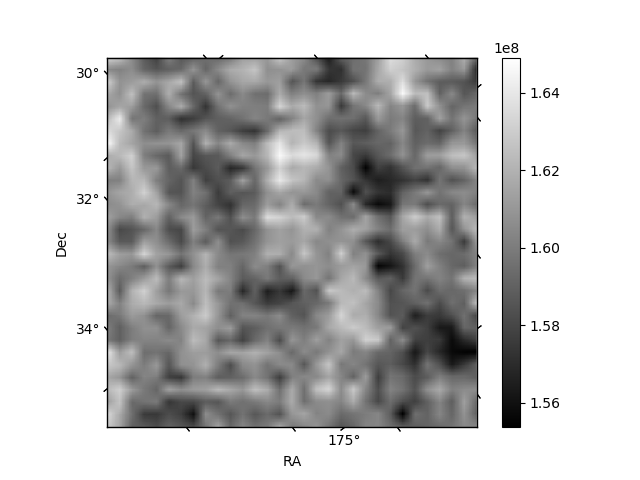
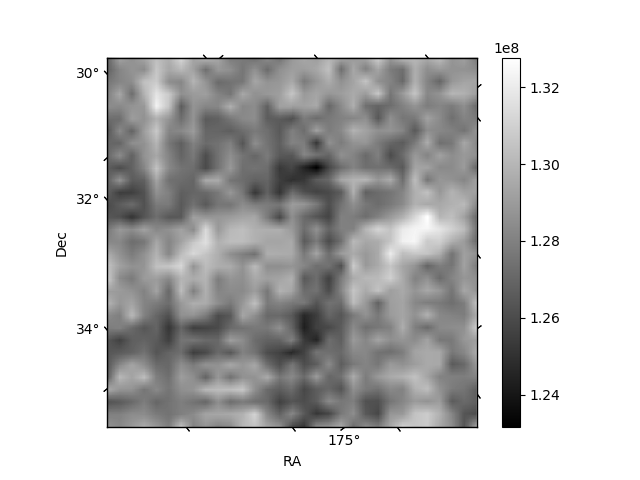
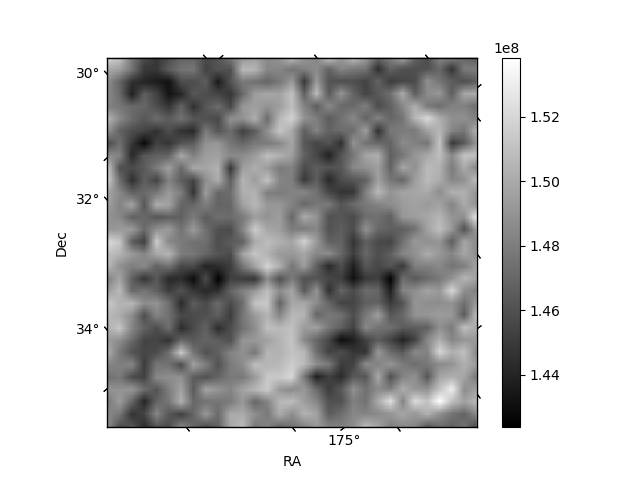
Histogram calculated using DETX and DETY for each event in the final _common_clean file
| Quadrant A |  |
 |
Quadrant B |
|---|---|---|---|
| Quadrant D |  |
 |
Quadrant C |
| Plot type | Count rate plots | Images |
|---|---|---|
| Comparison with Poisson distribution Blue bars denote a histogram of data divided into 1 sec bins. Red curve is a Poisson curve with rate = median count rate of data. |
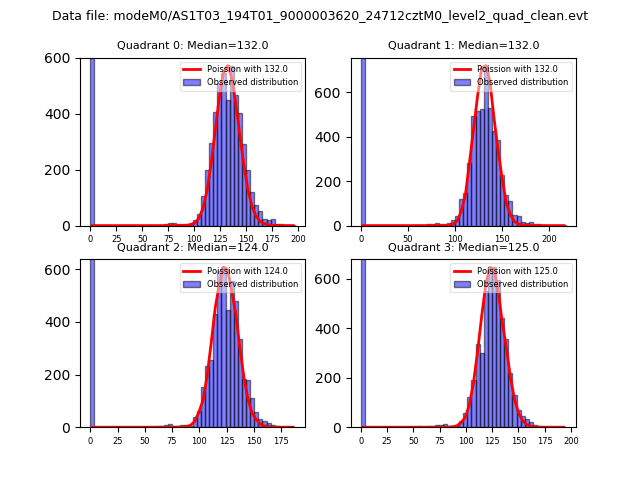 |
 |
| Quadrant-wise count rates Data is divided into 100 sec bins |
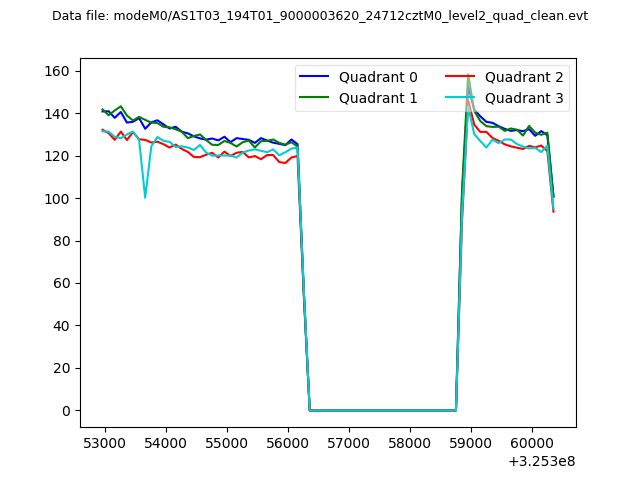 |
|
| Module-wise count rates for Quadrant A Data is divided into 100 sec bins |
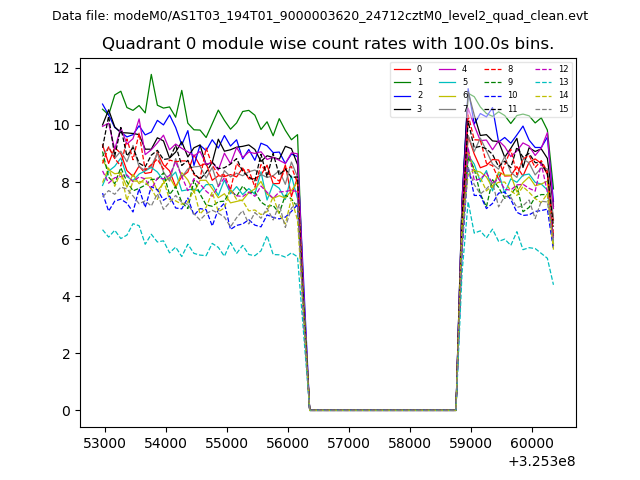 |
 |
| Module-wise count rates for Quadrant B Data is divided into 100 sec bins |
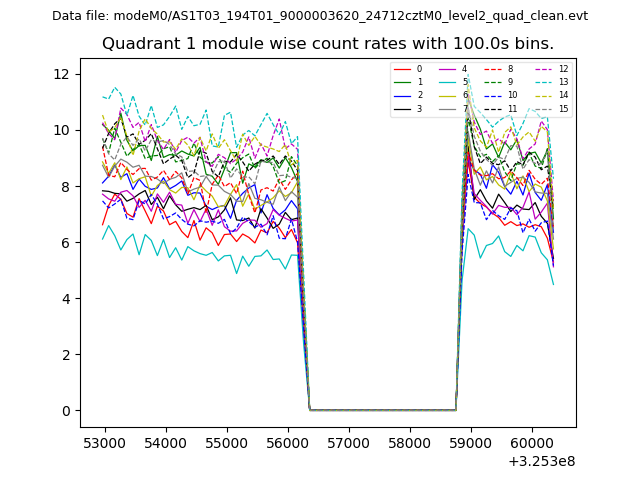 |
 |
| Module-wise count rates for Quadrant C Data is divided into 100 sec bins |
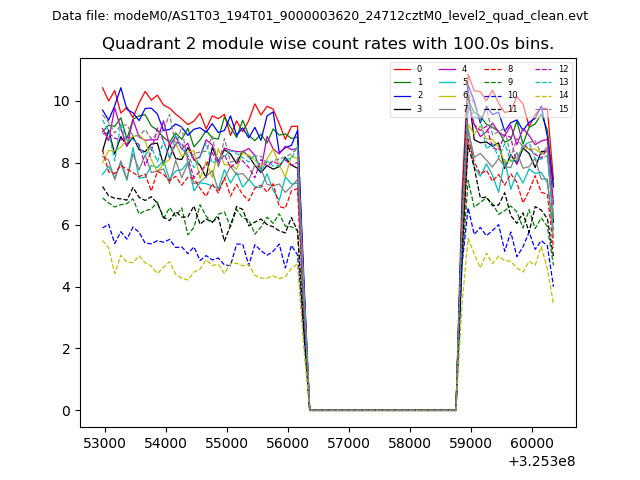 |
 |
| Module-wise count rates for Quadrant D Data is divided into 100 sec bins |
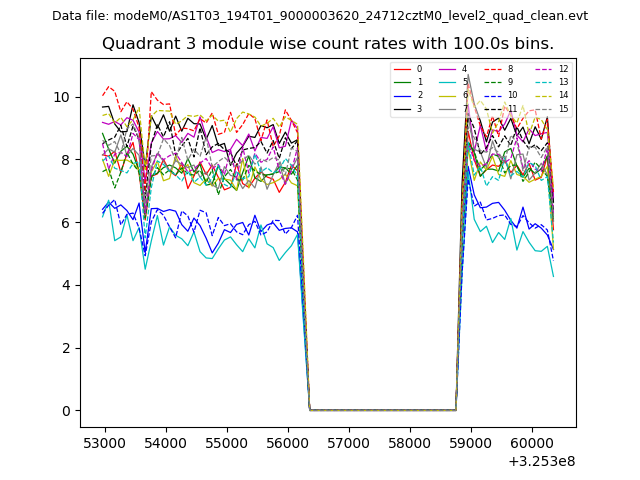 |
 |
| Parameter | Plot |
|---|---|
| CZT HV Monitor | 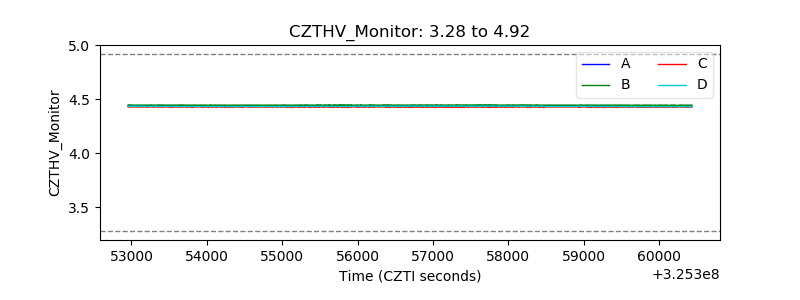 |
| D_VDD | 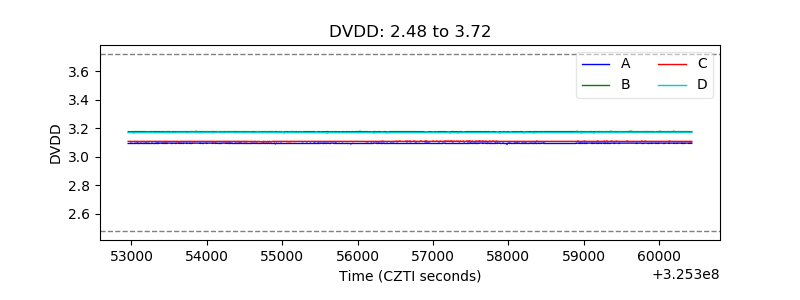 |
| Temperature 1 | 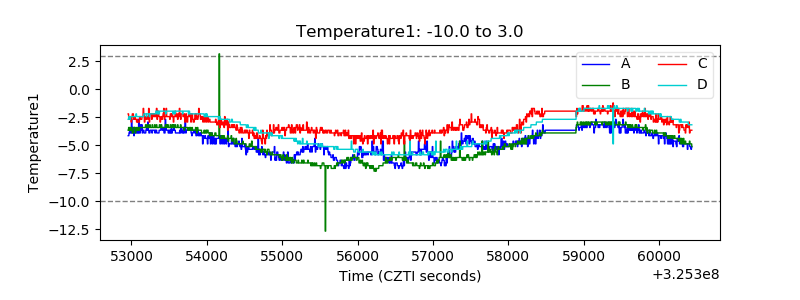 |
| Veto HV Monitor | 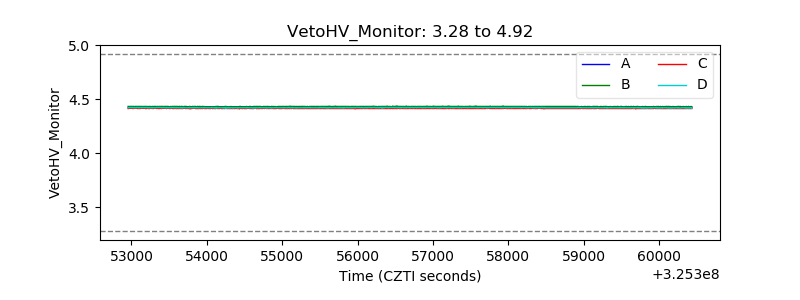 |
| Veto LLD | 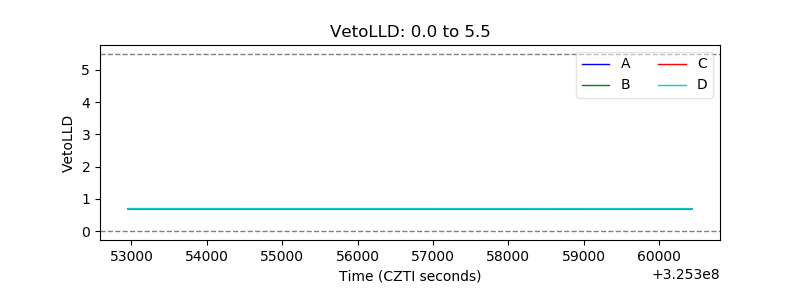 |
| Alpha Counter | 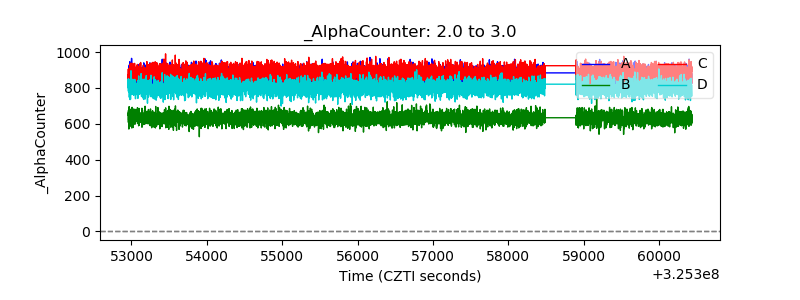 |
| _CPM_Rate | 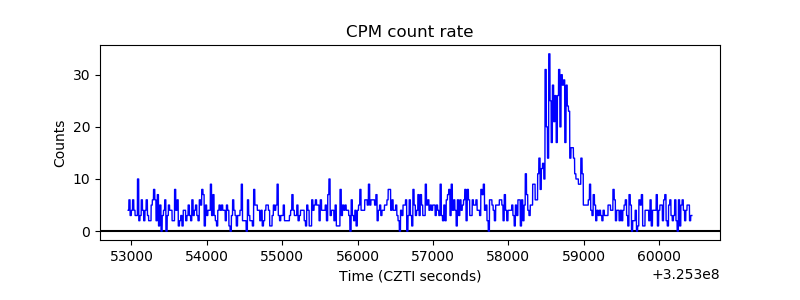 |
| CZT Counter |  |
| +2.5 Volts monitor |  |
| +5 Volts monitor |  |
| _ROLL_ROT | 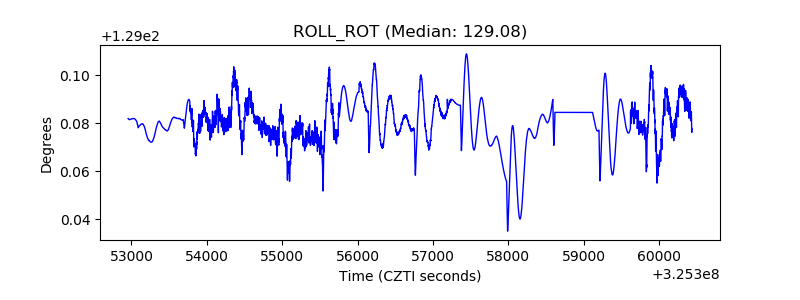 |
| _Roll_DEC | 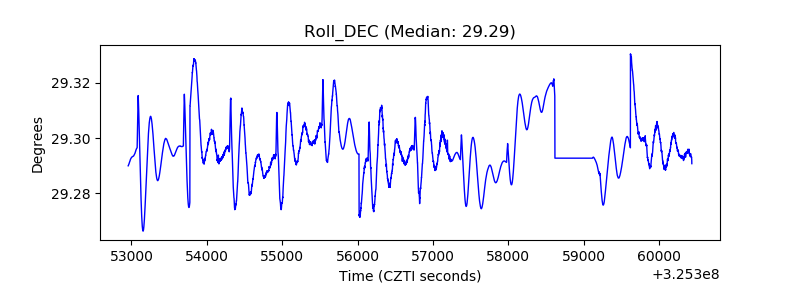 |
| _Roll_RA | 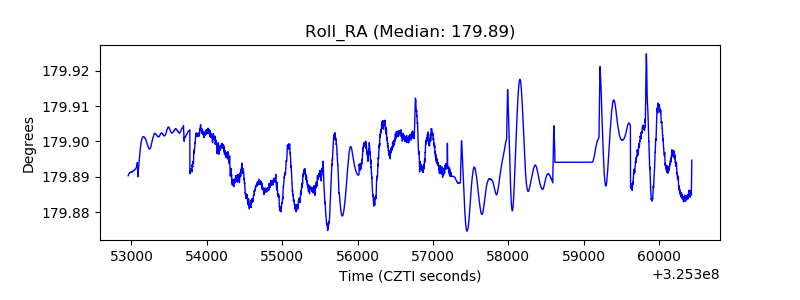 |
| Veto Counter | 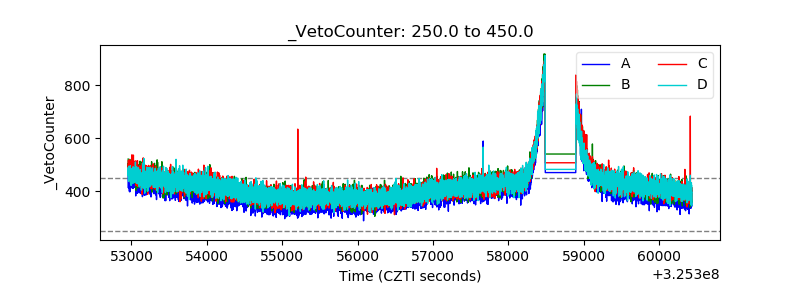 |