| Param | Original file | Final file |
|---|---|---|
| Filename | modeM0/AS1T03_194T01_9000003620_24713cztM0_level2.evt | modeM0/AS1T03_194T01_9000003620_24713cztM0_level2_quad_clean.evt |
| Size (bytes) | 566,098,560 | 105,626,880 |
| Size | 539.9 MB | 100.7 MB |
| Events in quadrant A | 3,607,209 | 688,551 |
| Events in quadrant B | 4,032,277 | 688,823 |
| Events in quadrant C | 4,777,929 | 653,778 |
| Events in quadrant D | 4,221,371 | 648,781 |
| Mode M9 | |||
|---|---|---|---|
| Quadrant | BADHDUFLAG | Total packets | Discarded packets |
| A | 0 | 2 | 0 |
| B | 0 | 2 | 0 |
| C | 0 | 2 | 0 |
| D | 0 | 2 | 0 |
| Mode M0 | |||
|---|---|---|---|
| Quadrant | BADHDUFLAG | Total packets | Discarded packets |
| A | 0 | 15606 | 1 |
| B | 0 | 16859 | 1 |
| C | 0 | 19412 | 1 |
| D | 0 | 17333 | 2 |
| Mode SS | |||
|---|---|---|---|
| Quadrant | BADHDUFLAG | Total packets | Discarded packets |
| A | 0 | 150 | 0 |
| B | 0 | 150 | 0 |
| C | 0 | 150 | 0 |
| D | 0 | 150 | 0 |
| Quadrant | Total seconds | Saturated seconds | Saturation percentage |
|---|---|---|---|
| A | 7458 | 135 | 1.810137% |
| B | 7459 | 185 | 2.480225% |
| C | 7459 | 250 | 3.351656% |
| D | 7458 | 198 | 2.654867% |
Noise dominated data is calculated using 1-second bins in cleaned event files. If a bin has >2000 counts, and if more than 50% of those come from <1% of pixels, then it is considered to be noise-dominated and hence unusable.
| Quadrant | # 1 sec bins | Bins with >0 counts | Bins with >2000 counts | High rate bins dominated by noise | Noise dominated (total time) | Noise dominated (detector-on time) | Marked lightcurve |
|---|---|---|---|---|---|---|---|
| A | 7638 | 7458 | 0 | 0 | 0.00% | 0.00% | 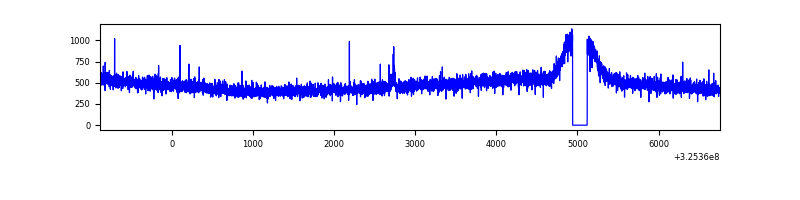 |
| B | 7639 | 7459 | 4 | 4 | 0.05% | 0.05% | 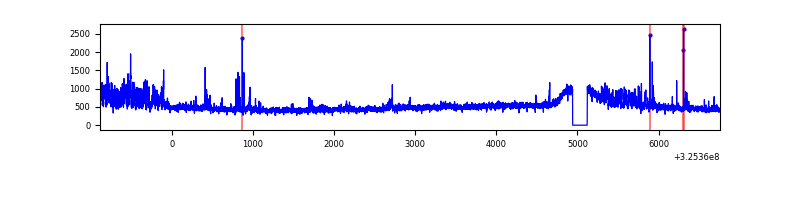 |
| C | 7639 | 7459 | 19 | 19 | 0.25% | 0.25% | 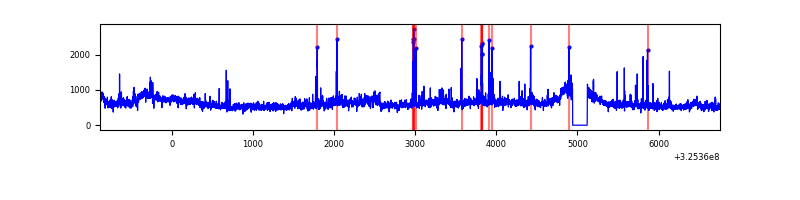 |
| D | 7638 | 7458 | 39 | 39 | 0.51% | 0.52% | 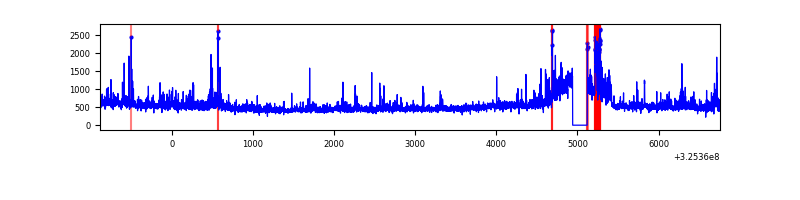 |
Top three noisy pixels from each quadrant. If the there are fewer than three noisy pixels in the level2.evt file, extra rows are filled as -1
| Pixel properties | Quadrant properties | ||||||
|---|---|---|---|---|---|---|---|
| Quadrant | DetID | PixID | Counts | Sigma | Mean | Median | Sigma |
| A | 13 | 254 | 11639 | 56.91 | 933 | 911 | 188.5 |
| A | 10 | 255 | 10611 | 51.45 | 933 | 911 | 188.5 |
| A | 3 | 137 | 8834 | 42.03 | 933 | 911 | 188.5 |
| B | 0 | 230 | 311766 | 1735.37 | 918 | 893 | 179.1 |
| B | 0 | 189 | 46065 | 252.16 | 918 | 893 | 179.1 |
| B | 3 | 64 | 29717 | 160.9 | 918 | 893 | 179.1 |
| C | 7 | 247 | 845862 | 4037.15 | 888 | 894 | 209.3 |
| C | 2 | 16 | 220137 | 1047.51 | 888 | 894 | 209.3 |
| C | 14 | 238 | 139207 | 660.84 | 888 | 894 | 209.3 |
| D | 1 | 52 | 535606 | 2396.03 | 906 | 879 | 223.2 |
| D | 8 | 195 | 234155 | 1045.27 | 906 | 879 | 223.2 |
| D | 2 | 234 | 31082 | 135.34 | 906 | 879 | 223.2 |
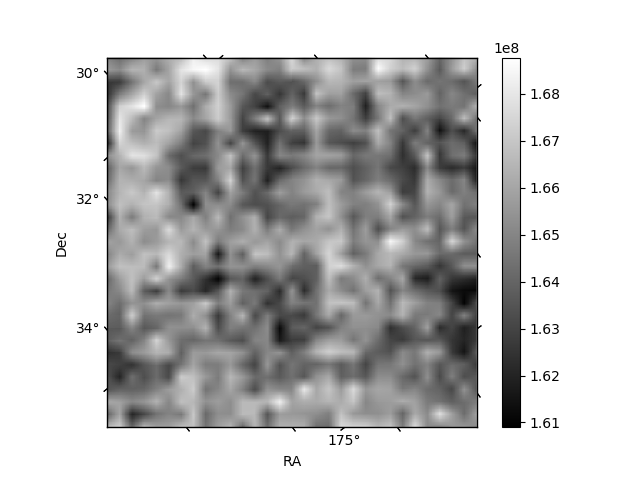
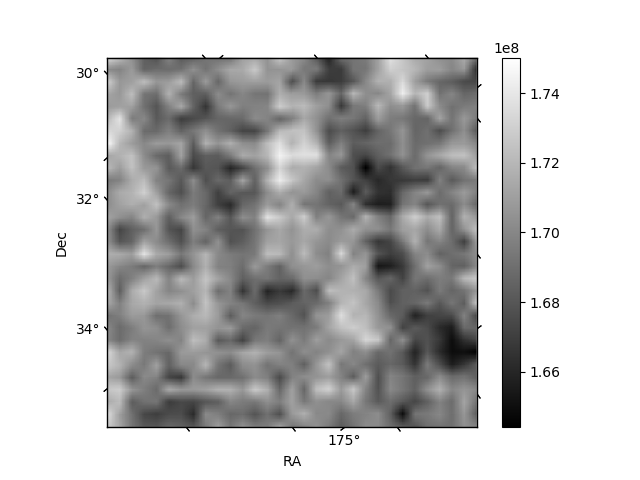
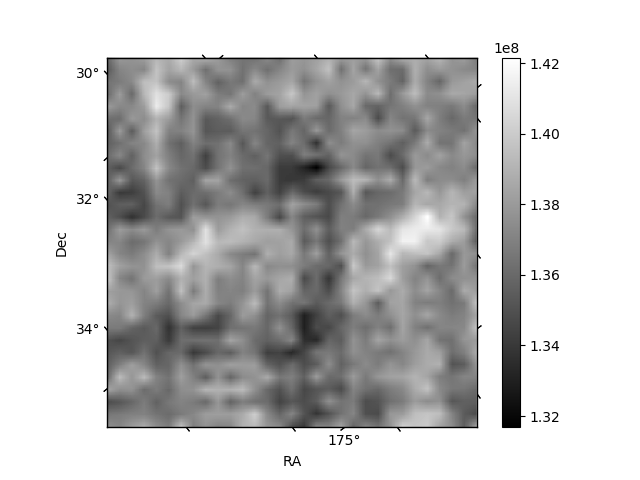
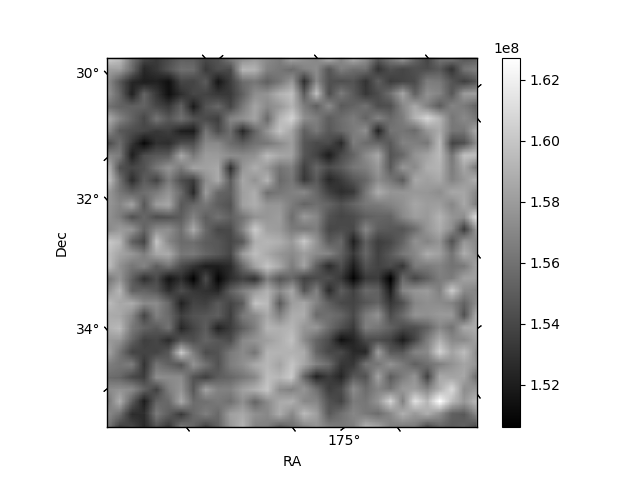
Histogram calculated using DETX and DETY for each event in the final _common_clean file
| Quadrant A | 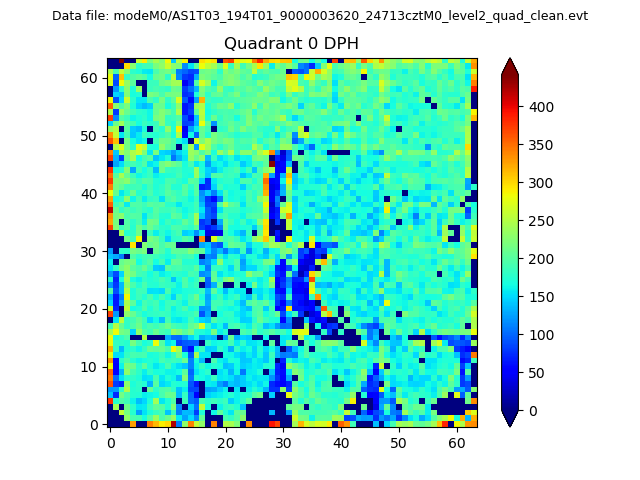 |
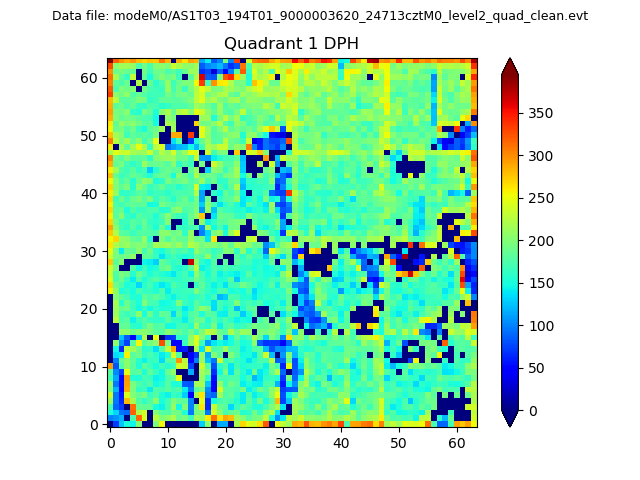 |
Quadrant B |
|---|---|---|---|
| Quadrant D | 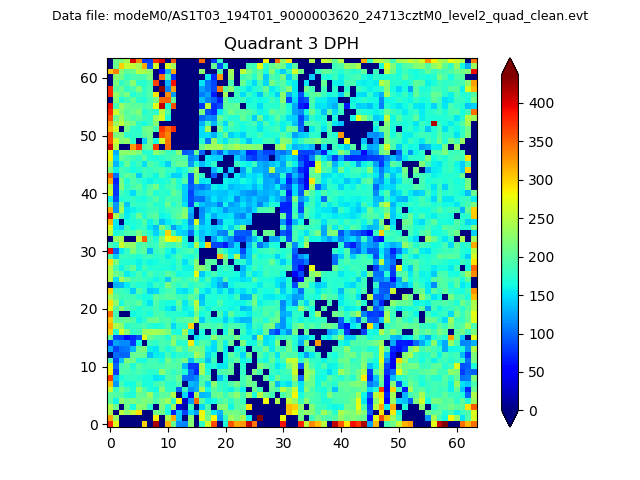 |
 |
Quadrant C |
| Plot type | Count rate plots | Images |
|---|---|---|
| Comparison with Poisson distribution Blue bars denote a histogram of data divided into 1 sec bins. Red curve is a Poisson curve with rate = median count rate of data. |
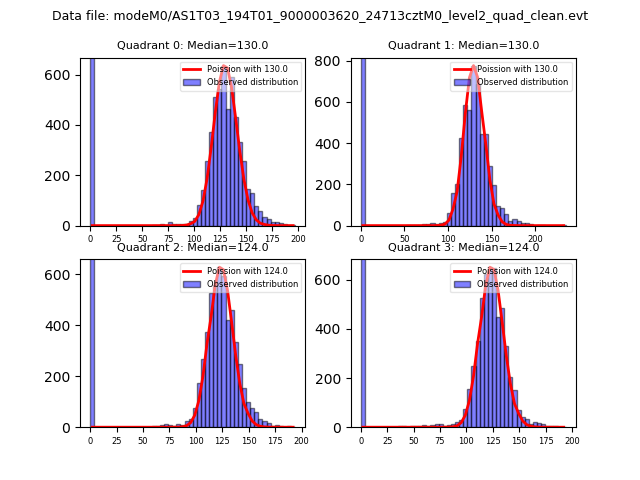 |
 |
| Quadrant-wise count rates Data is divided into 100 sec bins |
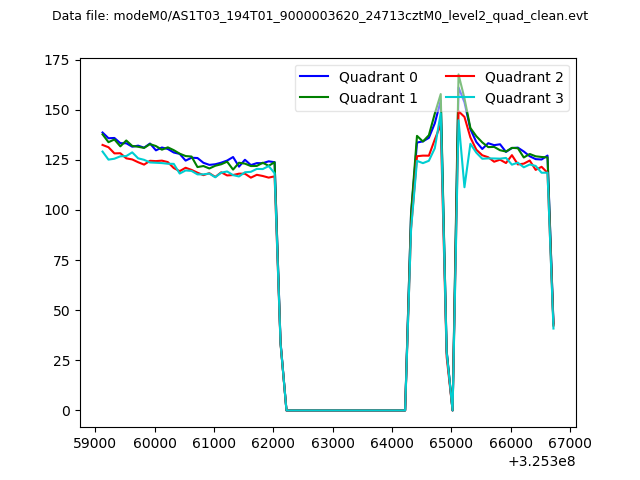 |
|
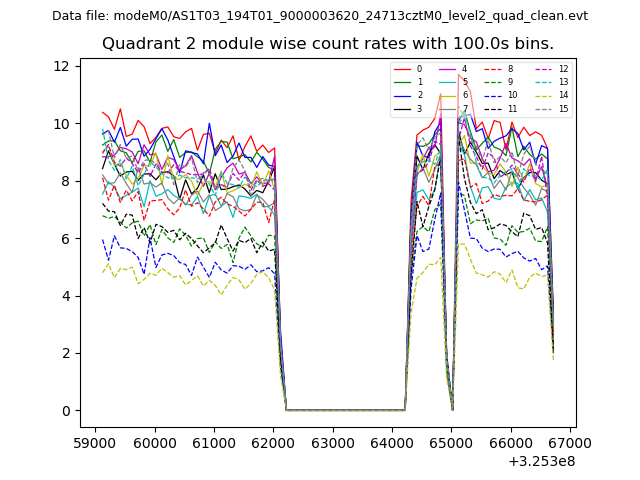
| Module-wise count rates for Quadrant A Data is divided into 100 sec bins |
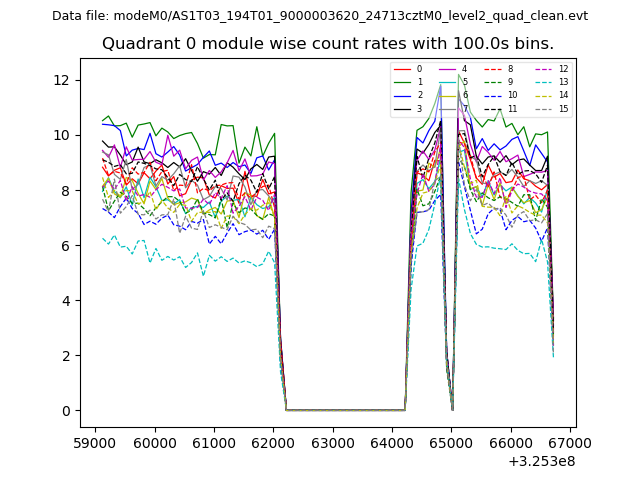 |
 |
| Module-wise count rates for Quadrant B Data is divided into 100 sec bins |
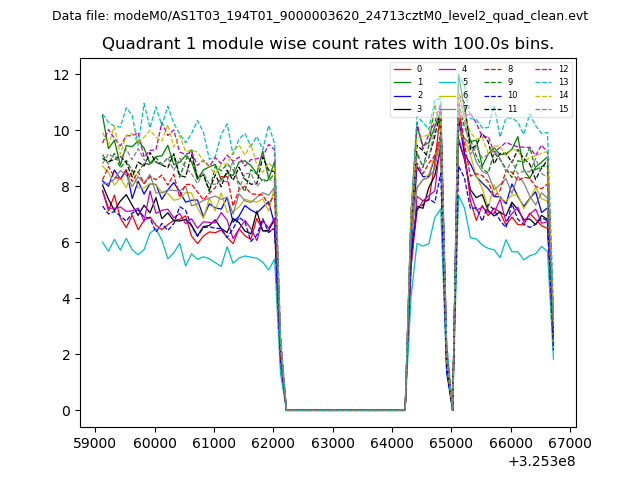 |
 |
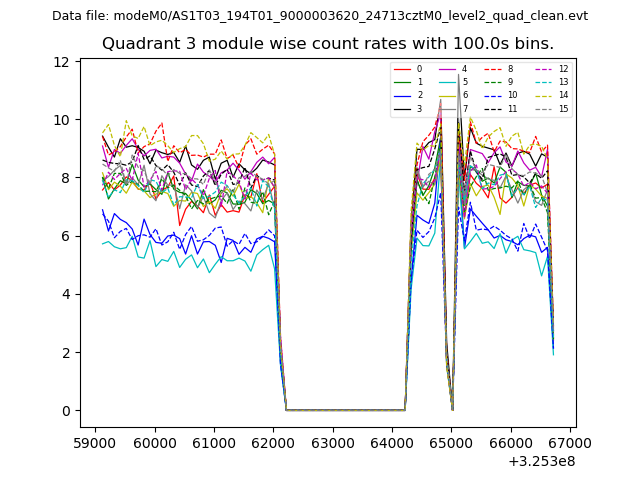
| Module-wise count rates for Quadrant C Data is divided into 100 sec bins |
 |
 |
| Module-wise count rates for Quadrant D Data is divided into 100 sec bins |
 |
 |
| Parameter | Plot |
|---|---|
| CZT HV Monitor |  |
| D_VDD |  |
| Temperature 1 | 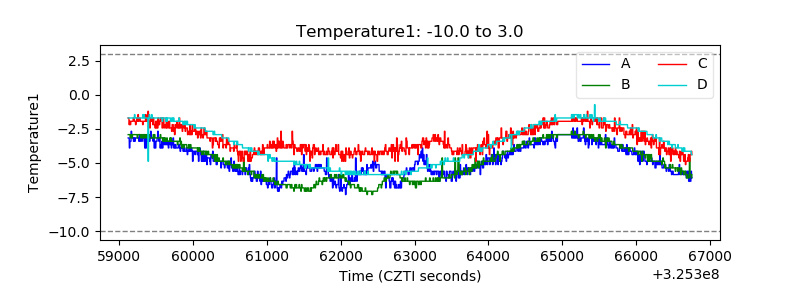 |
| Veto HV Monitor | 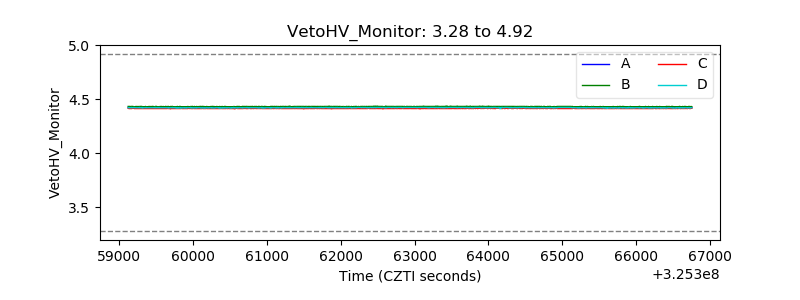 |
| Veto LLD | 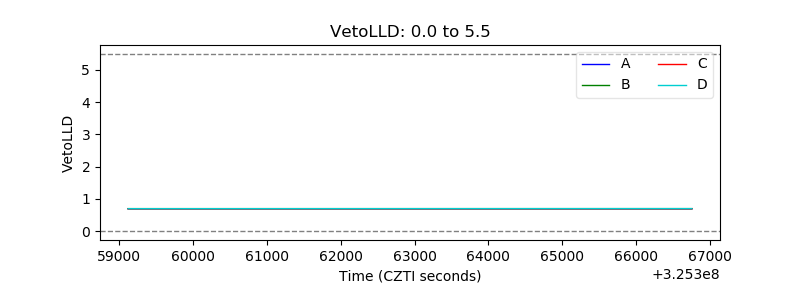 |
| Alpha Counter | 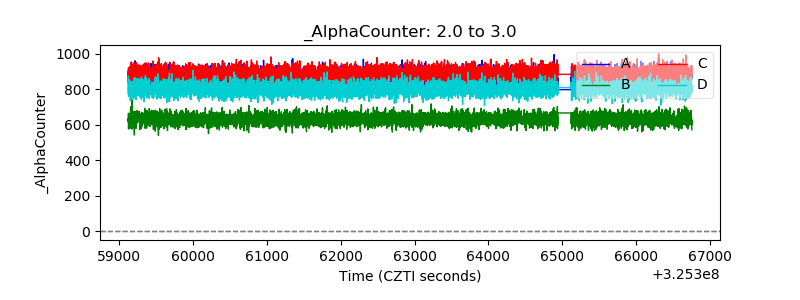 |
| _CPM_Rate | 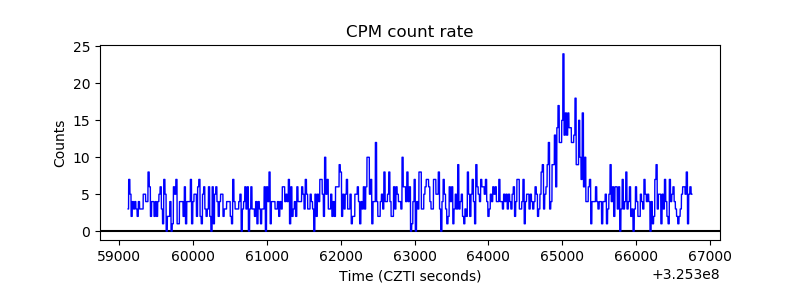 |
| CZT Counter |  |
| +2.5 Volts monitor |  |
| +5 Volts monitor | 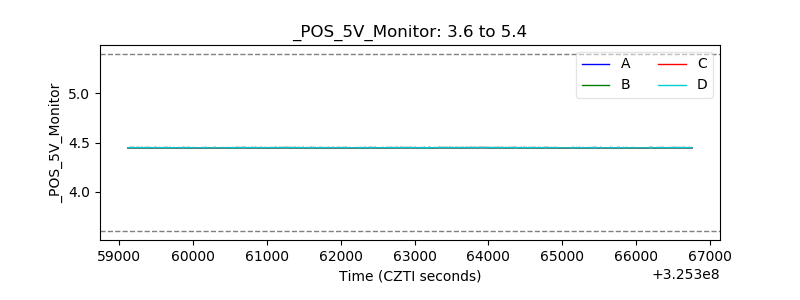 |
| _ROLL_ROT | 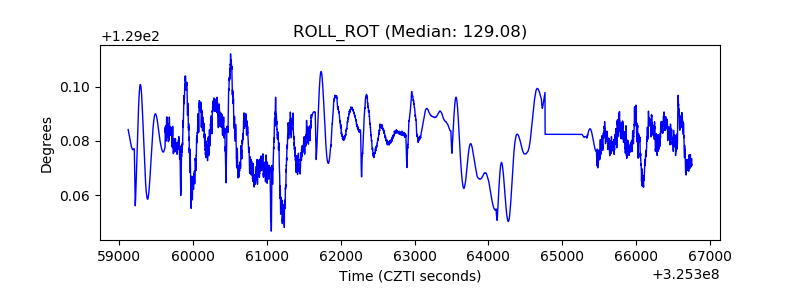 |
| _Roll_DEC | 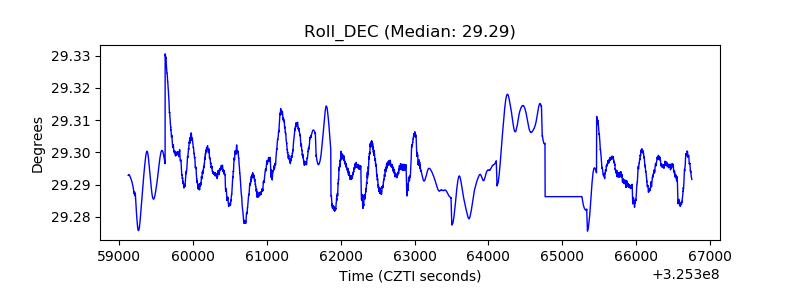 |
| _Roll_RA | 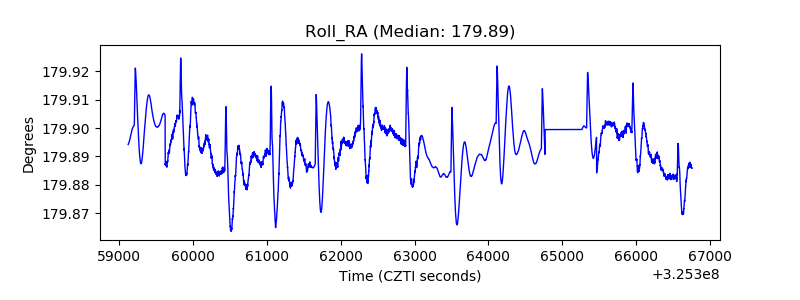 |
| Veto Counter | 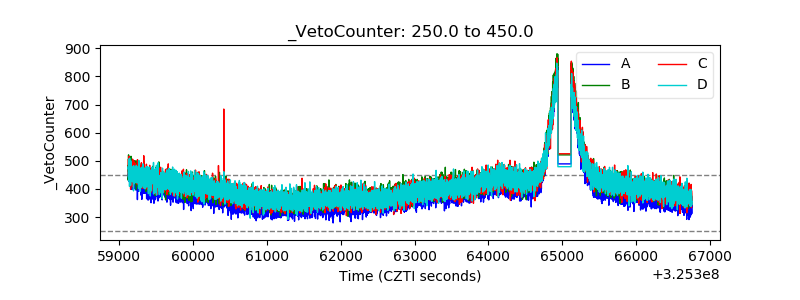 |