| Param | Original file | Final file |
|---|---|---|
| Filename | modeM0/AS1T03_194T01_9000003620_24714cztM0_level2.evt | modeM0/AS1T03_194T01_9000003620_24714cztM0_level2_quad_clean.evt |
| Size (bytes) | 556,600,320 | 104,425,920 |
| Size | 530.8 MB | 99.6 MB |
| Events in quadrant A | 3,485,860 | 678,248 |
| Events in quadrant B | 3,762,076 | 679,426 |
| Events in quadrant C | 4,607,674 | 646,922 |
| Events in quadrant D | 4,496,002 | 639,787 |
| Mode M9 | |||
|---|---|---|---|
| Quadrant | BADHDUFLAG | Total packets | Discarded packets |
| A | 0 | 4 | 0 |
| B | 0 | 4 | 0 |
| C | 0 | 4 | 0 |
| D | 0 | 4 | 0 |
| Mode M0 | |||
|---|---|---|---|
| Quadrant | BADHDUFLAG | Total packets | Discarded packets |
| A | 0 | 15348 | 1 |
| B | 0 | 16020 | 1 |
| C | 0 | 18554 | 1 |
| D | 0 | 18313 | 2 |
| Mode SS | |||
|---|---|---|---|
| Quadrant | BADHDUFLAG | Total packets | Discarded packets |
| A | 0 | 152 | 0 |
| B | 0 | 152 | 0 |
| C | 0 | 152 | 0 |
| D | 0 | 152 | 0 |
| Quadrant | Total seconds | Saturated seconds | Saturation percentage |
|---|---|---|---|
| A | 7442 | 29 | 0.389680% |
| B | 7443 | 60 | 0.806127% |
| C | 7443 | 151 | 2.028752% |
| D | 7442 | 127 | 1.706531% |
Noise dominated data is calculated using 1-second bins in cleaned event files. If a bin has >2000 counts, and if more than 50% of those come from <1% of pixels, then it is considered to be noise-dominated and hence unusable.
| Quadrant | # 1 sec bins | Bins with >0 counts | Bins with >2000 counts | High rate bins dominated by noise | Noise dominated (total time) | Noise dominated (detector-on time) | Marked lightcurve |
|---|---|---|---|---|---|---|---|
| A | 7822 | 7443 | 0 | 0 | 0.00% | 0.00% | 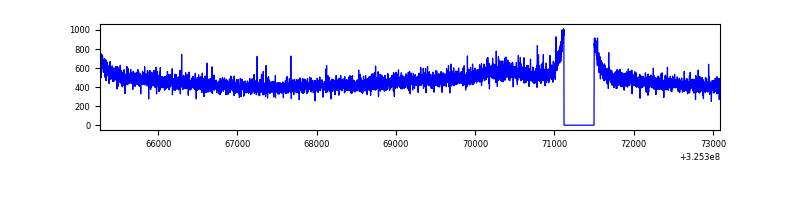 |
| B | 7823 | 7444 | 6 | 6 | 0.08% | 0.08% | 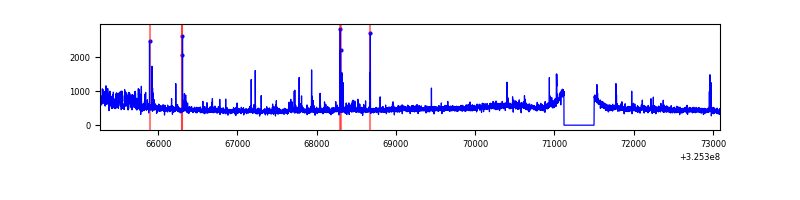 |
| C | 7823 | 7443 | 41 | 41 | 0.52% | 0.55% | 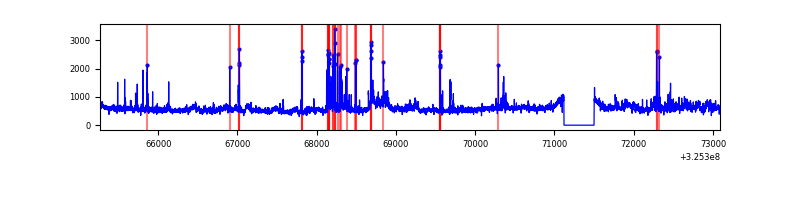 |
| D | 7822 | 7443 | 68 | 68 | 0.87% | 0.91% | 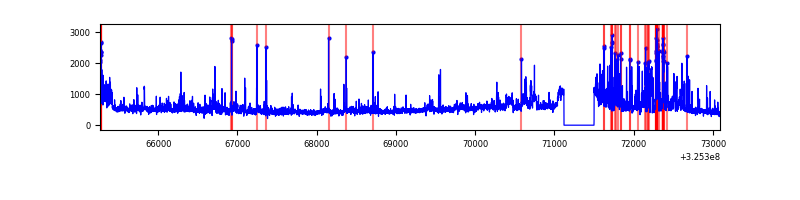 |
Top three noisy pixels from each quadrant. If the there are fewer than three noisy pixels in the level2.evt file, extra rows are filled as -1
| Pixel properties | Quadrant properties | ||||||
|---|---|---|---|---|---|---|---|
| Quadrant | DetID | PixID | Counts | Sigma | Mean | Median | Sigma |
| A | 13 | 254 | 11481 | 58.51 | 902 | 882 | 181.2 |
| A | 3 | 137 | 8442 | 41.73 | 902 | 882 | 181.2 |
| A | 10 | 255 | 8378 | 41.38 | 902 | 882 | 181.2 |
| B | 0 | 230 | 106681 | 611.49 | 891 | 867 | 173.0 |
| B | 0 | 189 | 78553 | 448.94 | 891 | 867 | 173.0 |
| B | 3 | 64 | 66345 | 378.39 | 891 | 867 | 173.0 |
| C | 7 | 247 | 803018 | 3941.85 | 863 | 869 | 203.5 |
| C | 2 | 16 | 281233 | 1377.74 | 863 | 869 | 203.5 |
| C | 14 | 238 | 133176 | 650.17 | 863 | 869 | 203.5 |
| D | 1 | 52 | 1012122 | 4734.63 | 878 | 852 | 213.6 |
| D | 8 | 195 | 132288 | 615.37 | 878 | 852 | 213.6 |
| D | 2 | 234 | 28695 | 130.36 | 878 | 852 | 213.6 |
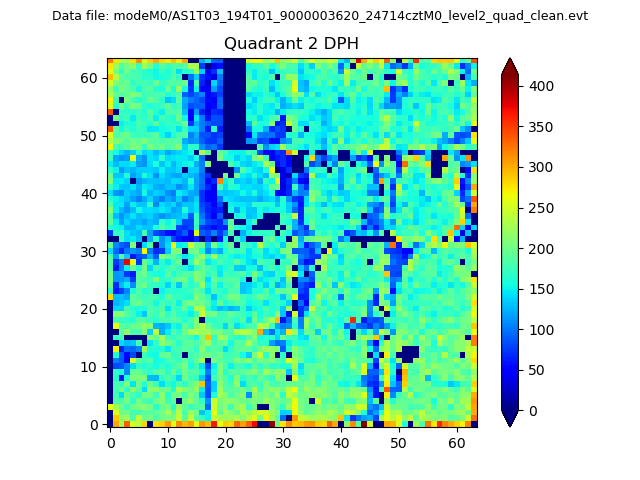
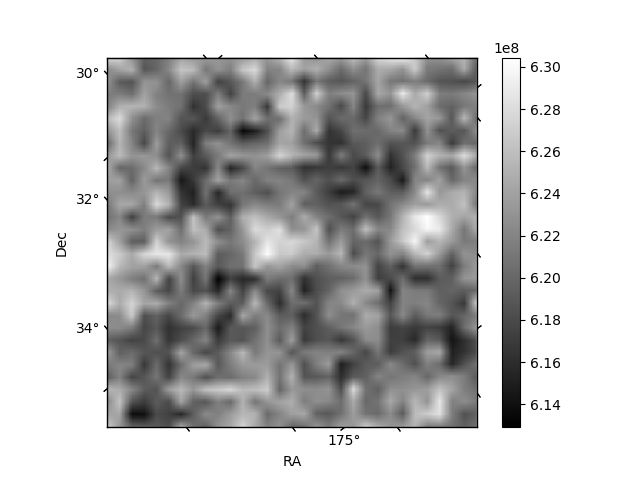
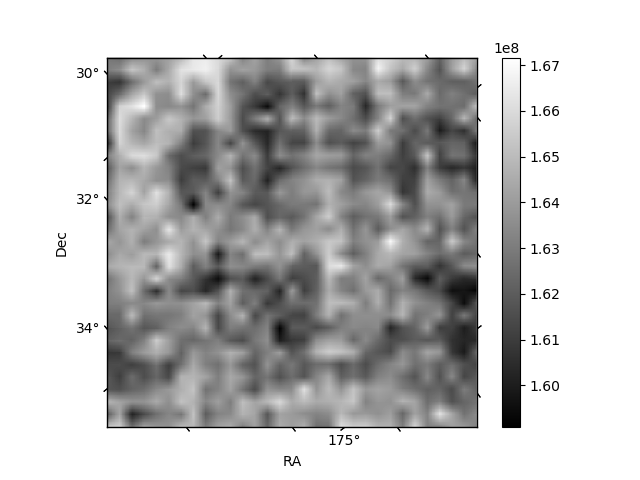
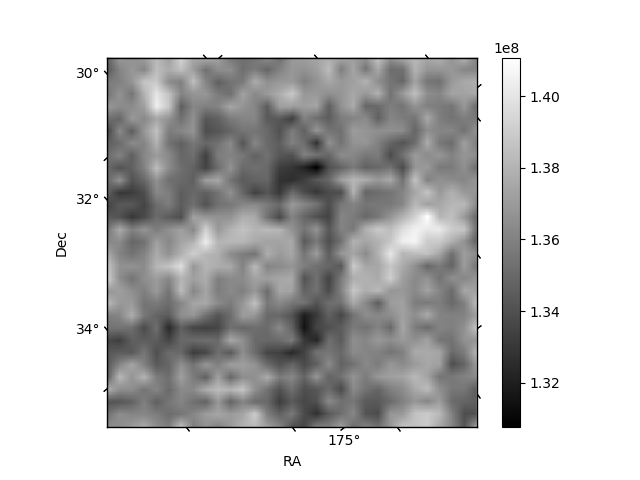
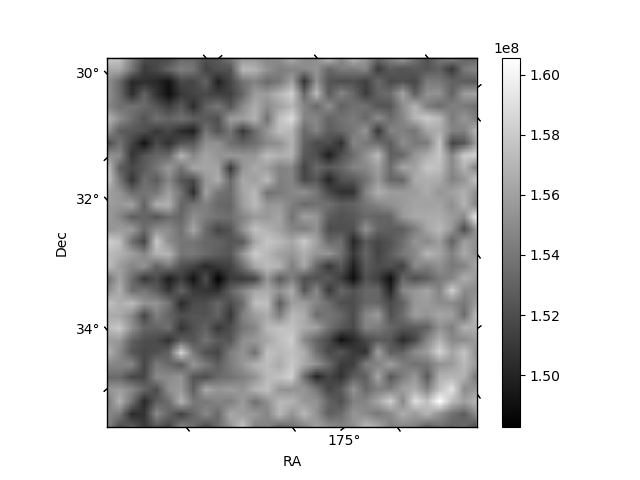
Histogram calculated using DETX and DETY for each event in the final _common_clean file
| Quadrant A | 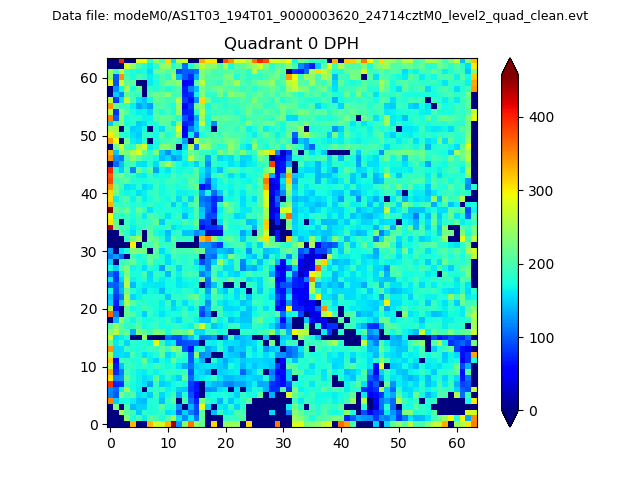 |
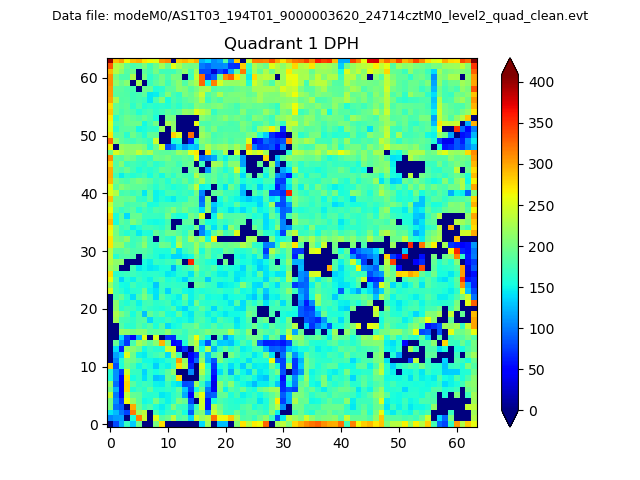 |
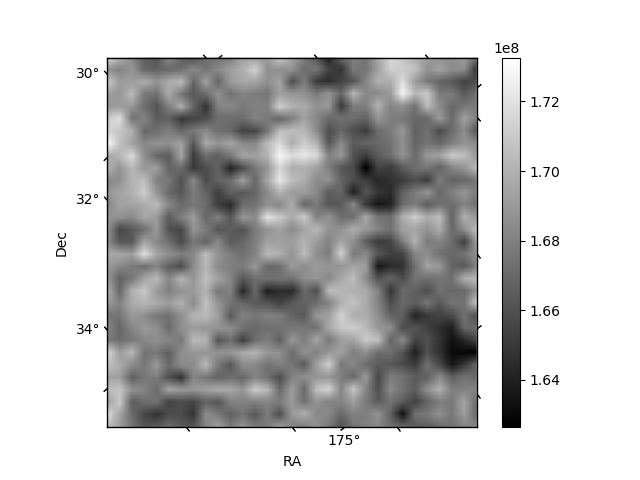
Quadrant B |
|---|---|---|---|
| Quadrant D | 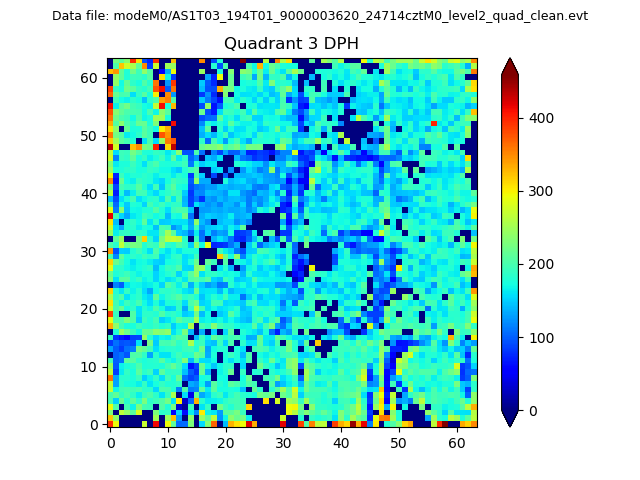 |
 |
Quadrant C |
| Plot type | Count rate plots | Images |
|---|---|---|
| Comparison with Poisson distribution Blue bars denote a histogram of data divided into 1 sec bins. Red curve is a Poisson curve with rate = median count rate of data. |
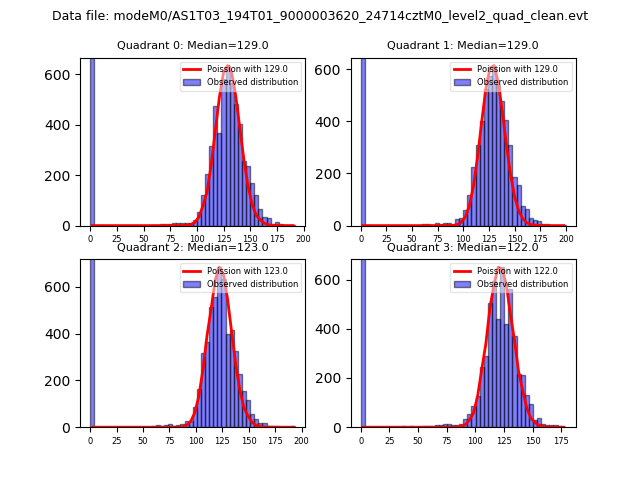 |
 |
| Quadrant-wise count rates Data is divided into 100 sec bins |
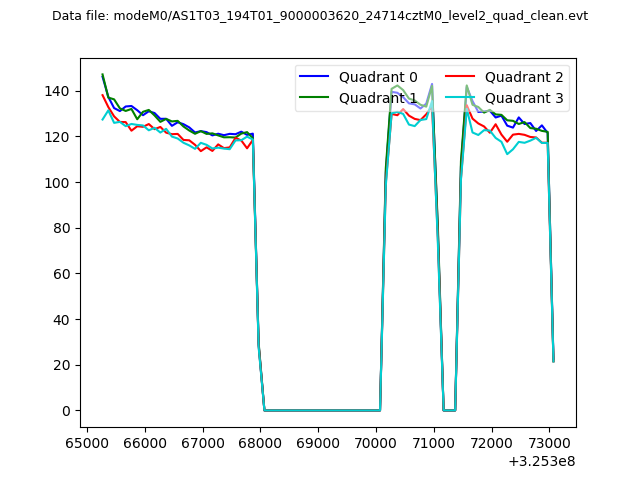 |
|
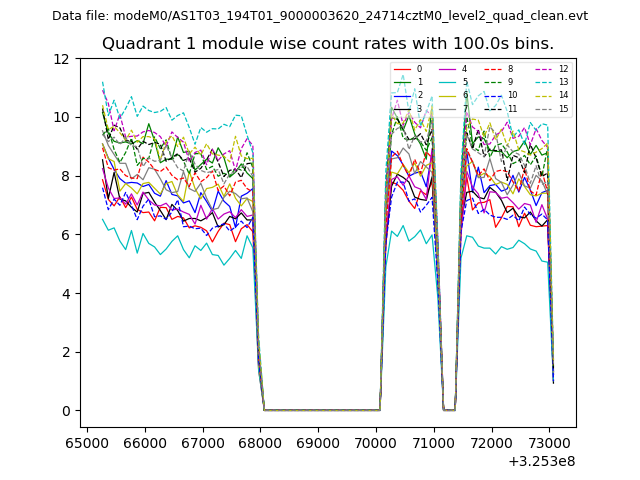
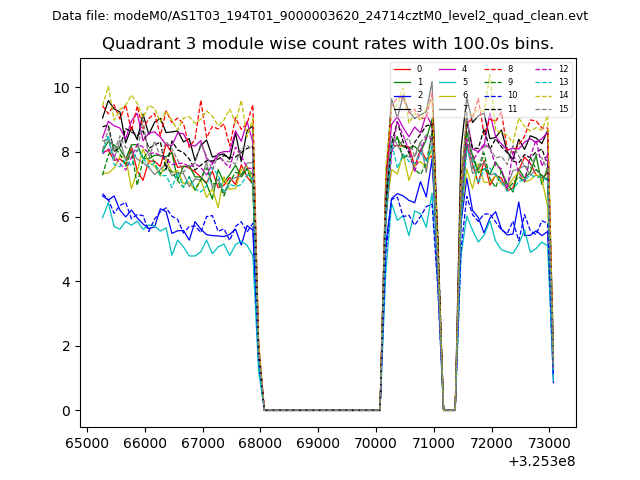
| Module-wise count rates for Quadrant A Data is divided into 100 sec bins |
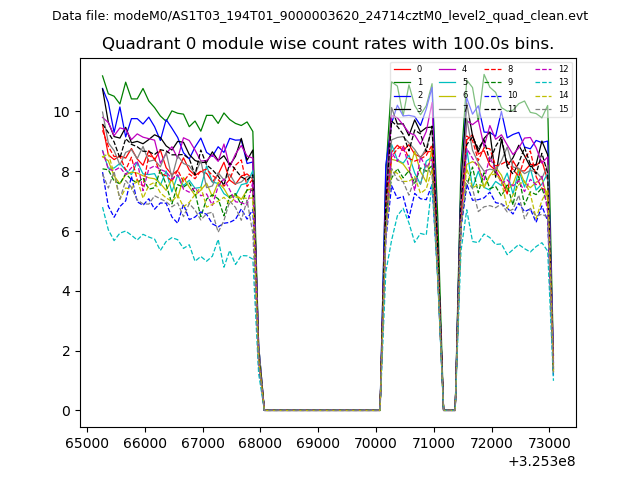 |
 |
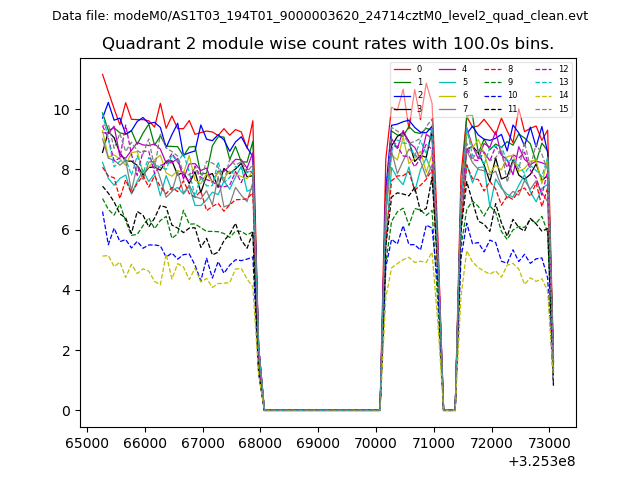
| Module-wise count rates for Quadrant B Data is divided into 100 sec bins |
 |
 |
| Module-wise count rates for Quadrant C Data is divided into 100 sec bins |
 |
 |
| Module-wise count rates for Quadrant D Data is divided into 100 sec bins |
 |
 |
| Parameter | Plot |
|---|---|
| CZT HV Monitor | 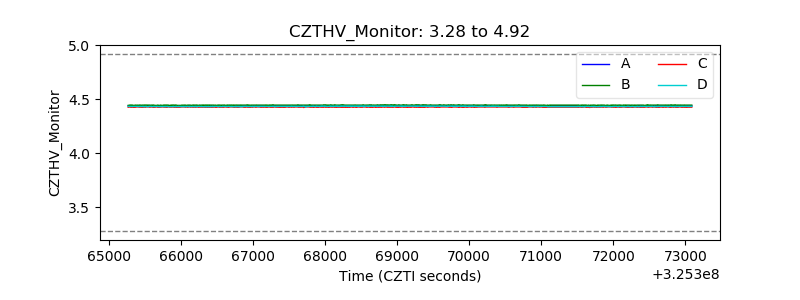 |
| D_VDD | 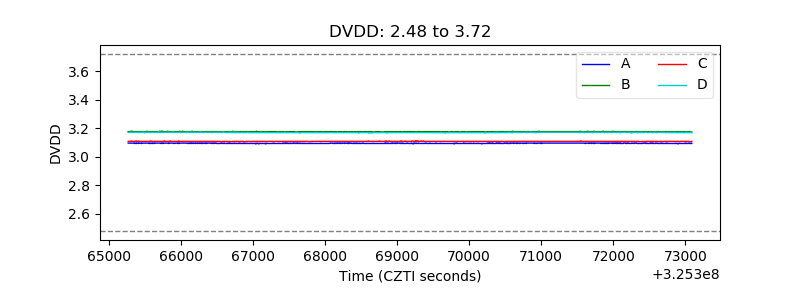 |
| Temperature 1 | 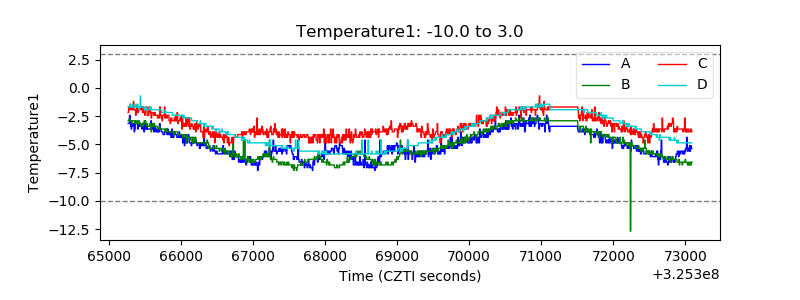 |
| Veto HV Monitor | 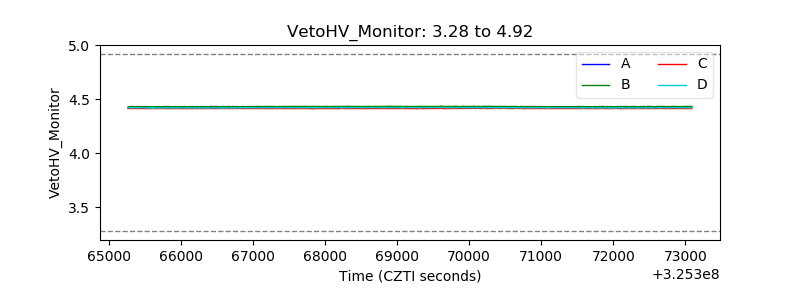 |
| Veto LLD | 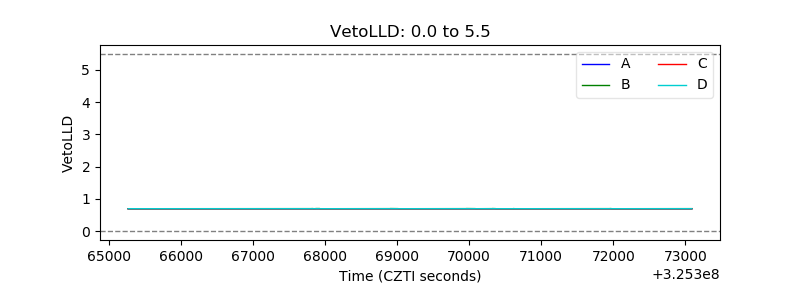 |
| Alpha Counter | 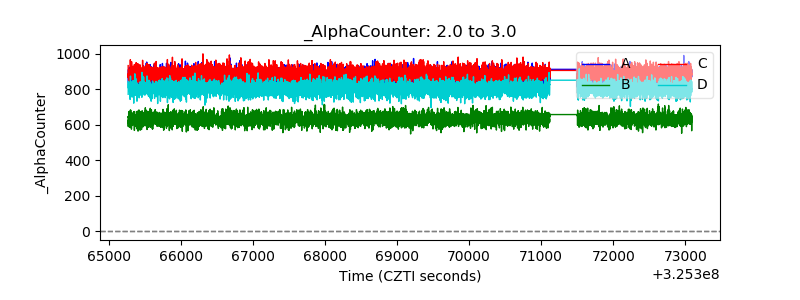 |
| _CPM_Rate | 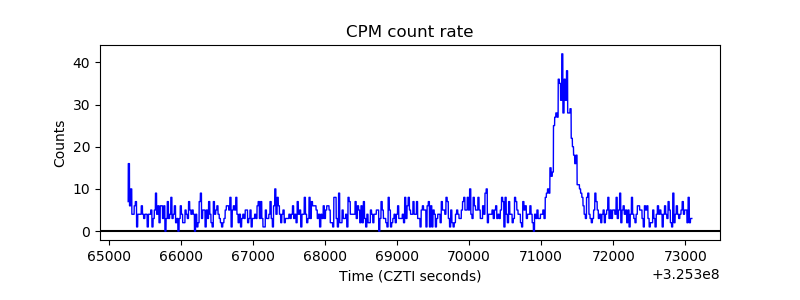 |
| CZT Counter | 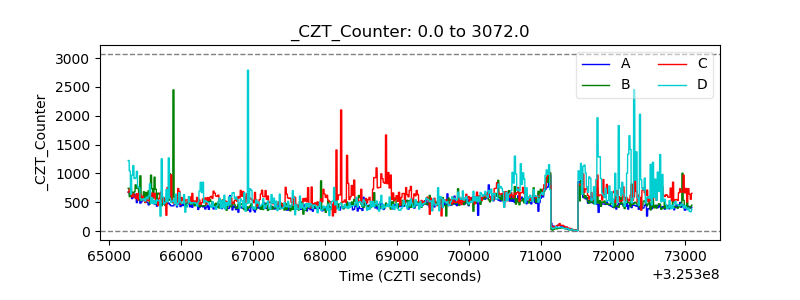 |
| +2.5 Volts monitor | 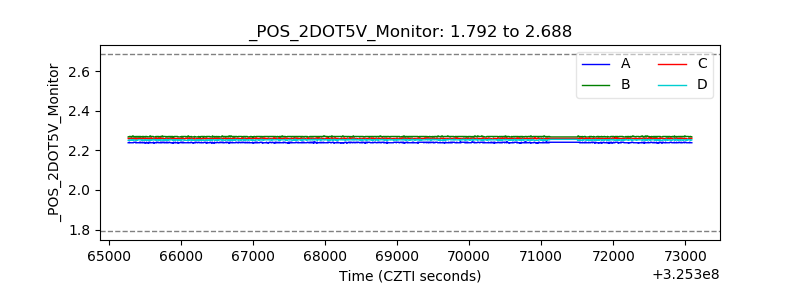 |
| +5 Volts monitor |  |
| _ROLL_ROT | 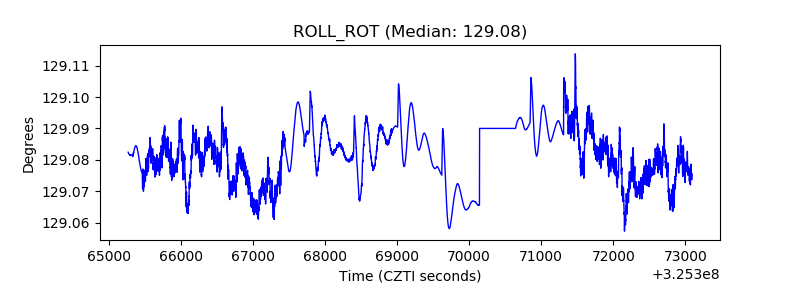 |
| _Roll_DEC | 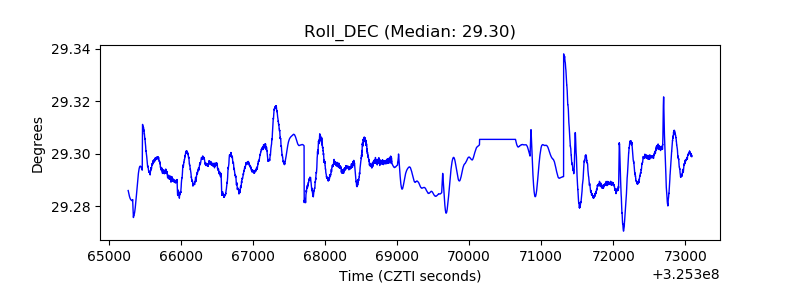 |
| _Roll_RA | 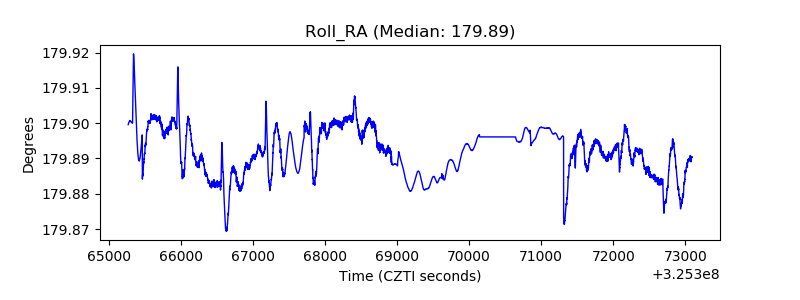 |
| Veto Counter | 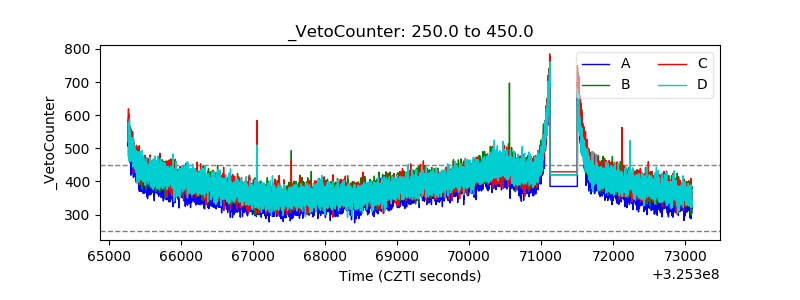 |