| Param | Original file | Final file |
|---|---|---|
| Filename | modeM0/AS1T03_194T01_9000003620_24716cztM0_level2.evt | modeM0/AS1T03_194T01_9000003620_24716cztM0_level2_quad_clean.evt |
| Size (bytes) | 946,244,160 | 160,608,960 |
| Size | 902.4 MB | 153.2 MB |
| Events in quadrant A | 5,768,794 | 1,029,944 |
| Events in quadrant B | 6,150,415 | 1,037,302 |
| Events in quadrant C | 8,937,181 | 971,783 |
| Events in quadrant D | 6,969,829 | 975,111 |
| Mode M9 | |||
|---|---|---|---|
| Quadrant | BADHDUFLAG | Total packets | Discarded packets |
| A | 0 | 17 | 0 |
| B | 0 | 17 | 0 |
| C | 0 | 17 | 0 |
| D | 0 | 17 | 0 |
| Mode M0 | |||
|---|---|---|---|
| Quadrant | BADHDUFLAG | Total packets | Discarded packets |
| A | 0 | 25284 | 3 |
| B | 0 | 26313 | 3 |
| C | 0 | 35128 | 3 |
| D | 0 | 29414 | 3 |
| Mode SS | |||
|---|---|---|---|
| Quadrant | BADHDUFLAG | Total packets | Discarded packets |
| A | 0 | 252 | 0 |
| B | 0 | 252 | 0 |
| C | 0 | 252 | 0 |
| D | 0 | 252 | 0 |
| Quadrant | Total seconds | Saturated seconds | Saturation percentage |
|---|---|---|---|
| A | 12294 | 50 | 0.406702% |
| B | 12294 | 97 | 0.789003% |
| C | 12294 | 464 | 3.774199% |
| D | 12294 | 150 | 1.220107% |
Noise dominated data is calculated using 1-second bins in cleaned event files. If a bin has >2000 counts, and if more than 50% of those come from <1% of pixels, then it is considered to be noise-dominated and hence unusable.
| Quadrant | # 1 sec bins | Bins with >0 counts | Bins with >2000 counts | High rate bins dominated by noise | Noise dominated (total time) | Noise dominated (detector-on time) | Marked lightcurve |
|---|---|---|---|---|---|---|---|
| A | 13964 | 12296 | 0 | 0 | 0.00% | 0.00% | 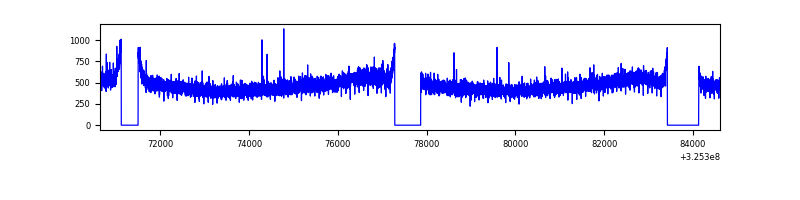 |
| B | 13964 | 12295 | 16 | 16 | 0.11% | 0.13% | 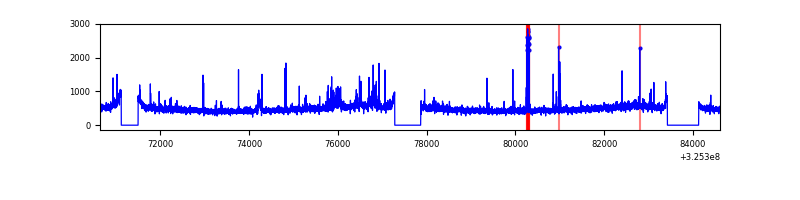 |
| C | 13964 | 12295 | 26 | 26 | 0.19% | 0.21% | 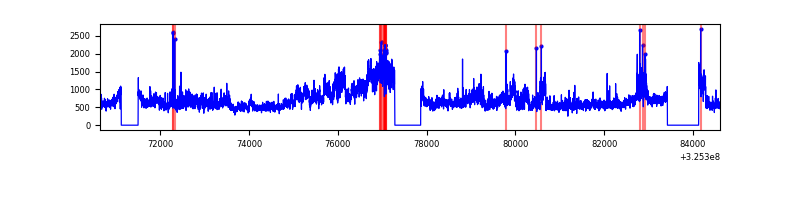 |
| D | 13964 | 12297 | 88 | 88 | 0.63% | 0.72% | 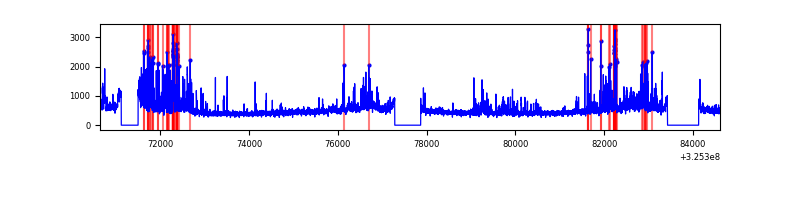 |
Top three noisy pixels from each quadrant. If the there are fewer than three noisy pixels in the level2.evt file, extra rows are filled as -1
| Pixel properties | Quadrant properties | ||||||
|---|---|---|---|---|---|---|---|
| Quadrant | DetID | PixID | Counts | Sigma | Mean | Median | Sigma |
| A | 13 | 254 | 18176 | 55.87 | 1492 | 1458 | 299.2 |
| A | 10 | 255 | 16865 | 51.49 | 1492 | 1458 | 299.2 |
| A | 3 | 137 | 14150 | 42.42 | 1492 | 1458 | 299.2 |
| B | 0 | 189 | 176843 | 612.59 | 1476 | 1433 | 286.3 |
| B | 0 | 230 | 75806 | 259.73 | 1476 | 1433 | 286.3 |
| B | 3 | 64 | 48330 | 163.78 | 1476 | 1433 | 286.3 |
| C | 7 | 247 | 2282218 | 6808.92 | 1423 | 1433 | 335.0 |
| C | 3 | 233 | 429624 | 1278.29 | 1423 | 1433 | 335.0 |
| C | 10 | 91 | 322601 | 958.79 | 1423 | 1433 | 335.0 |
| D | 1 | 52 | 1258745 | 3554.22 | 1452 | 1411 | 353.8 |
| D | 8 | 195 | 165307 | 463.3 | 1452 | 1411 | 353.8 |
| D | 2 | 234 | 47921 | 131.47 | 1452 | 1411 | 353.8 |
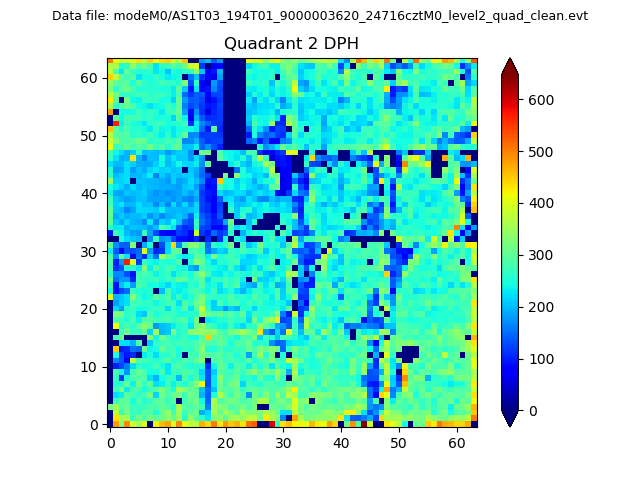
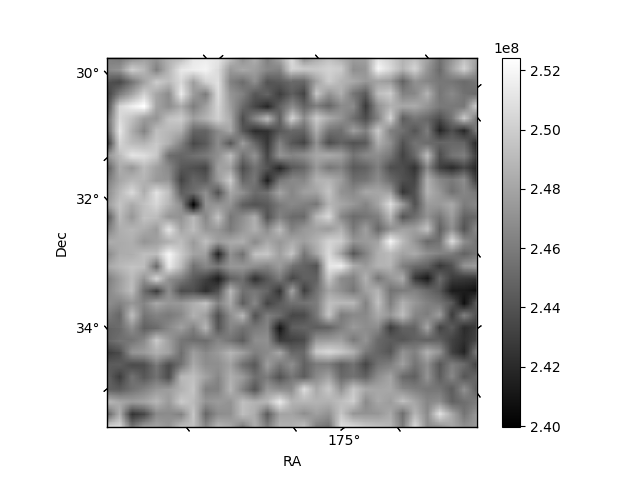
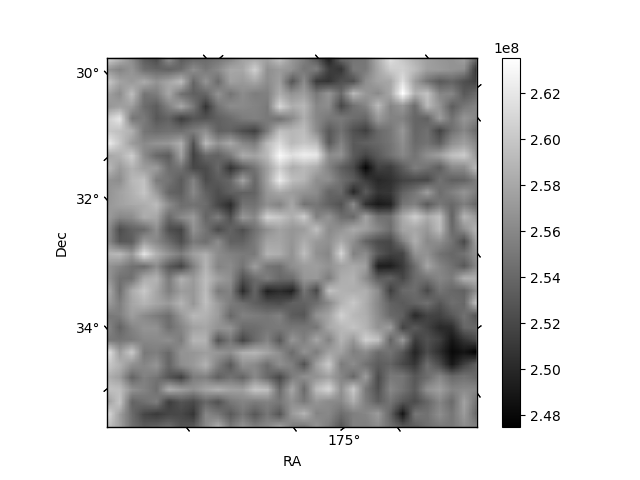
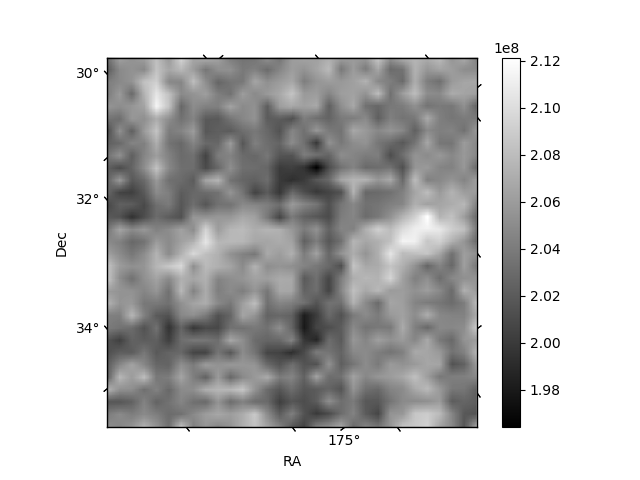
Histogram calculated using DETX and DETY for each event in the final _common_clean file
| Quadrant A | 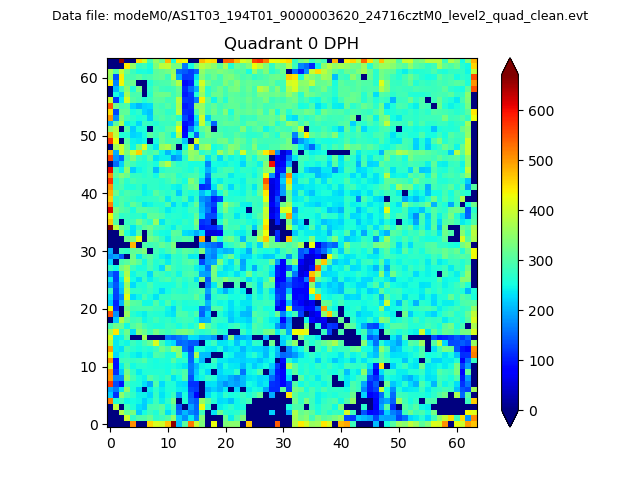 |
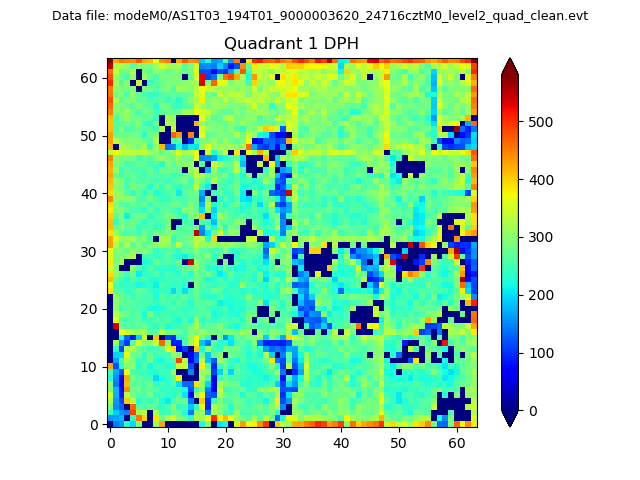 |
Quadrant B |
|---|---|---|---|
| Quadrant D | 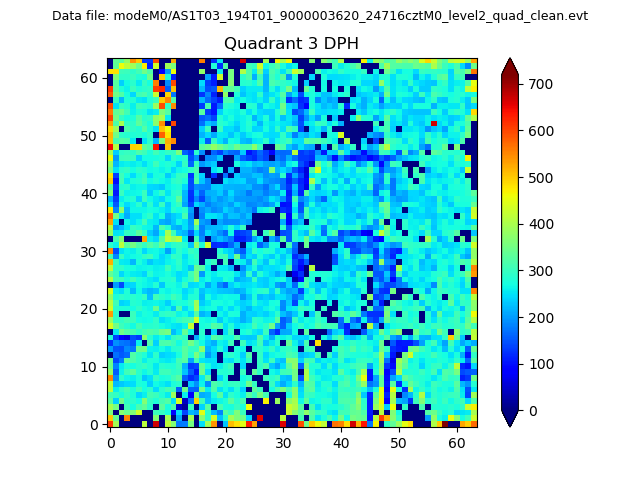 |
 |
Quadrant C |
| Plot type | Count rate plots | Images |
|---|---|---|
| Comparison with Poisson distribution Blue bars denote a histogram of data divided into 1 sec bins. Red curve is a Poisson curve with rate = median count rate of data. |
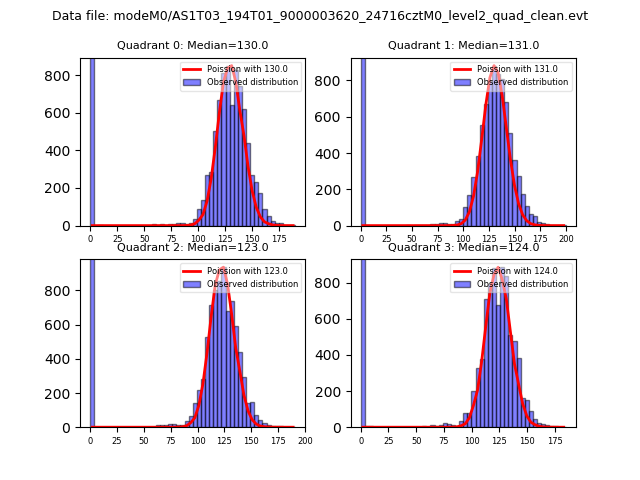 |
 |
| Quadrant-wise count rates Data is divided into 100 sec bins |
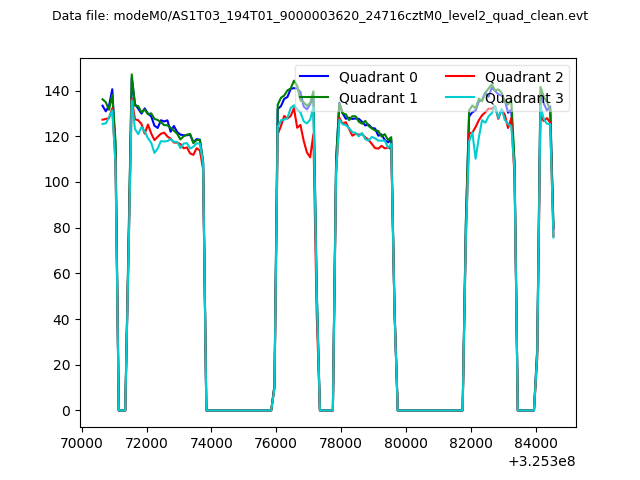 |
|
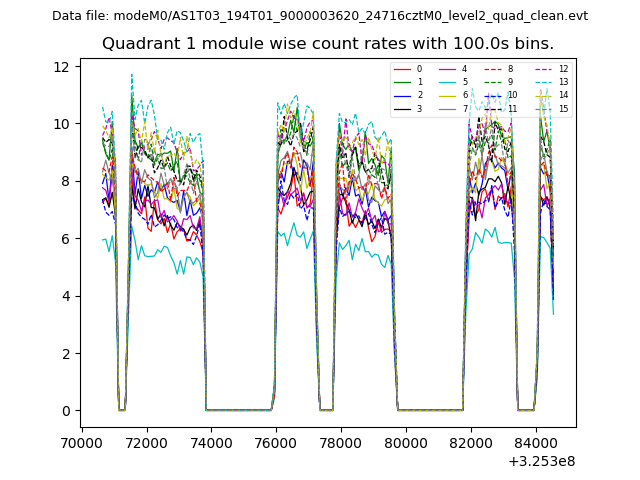
| Module-wise count rates for Quadrant A Data is divided into 100 sec bins |
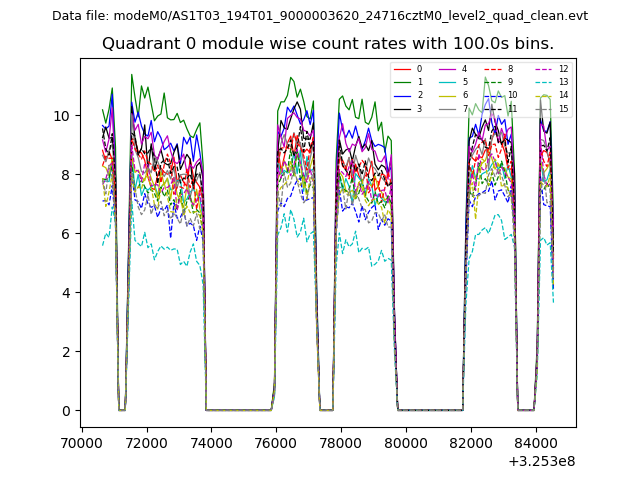 |
 |
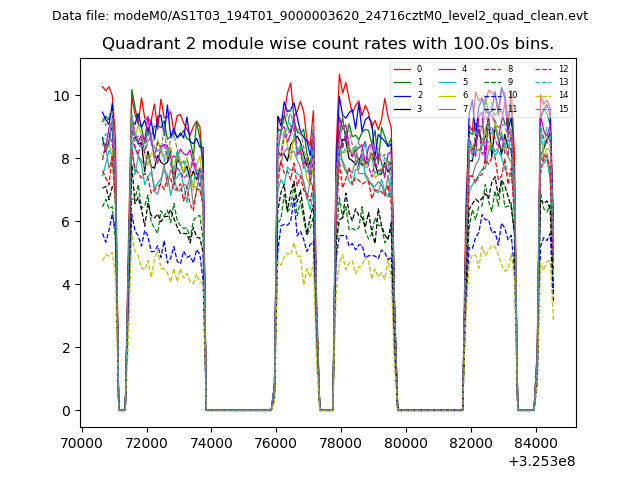
| Module-wise count rates for Quadrant B Data is divided into 100 sec bins |
 |
 |
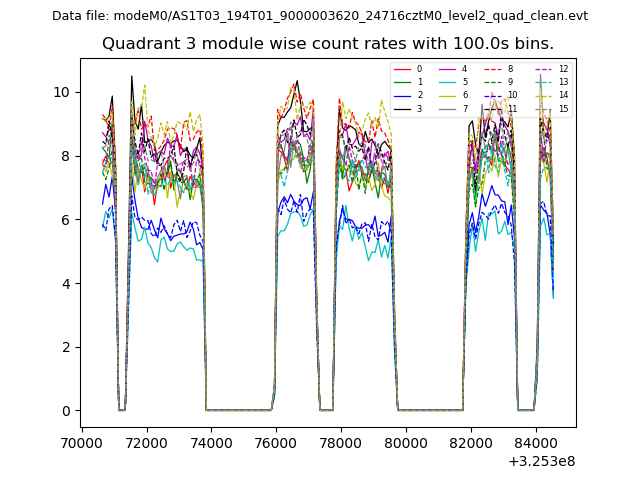
| Module-wise count rates for Quadrant C Data is divided into 100 sec bins |
 |
 |
| Module-wise count rates for Quadrant D Data is divided into 100 sec bins |
 |
 |
| Parameter | Plot |
|---|---|
| CZT HV Monitor | 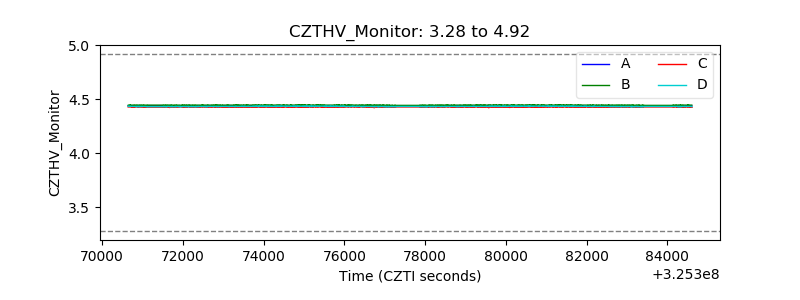 |
| D_VDD |  |
| Temperature 1 | 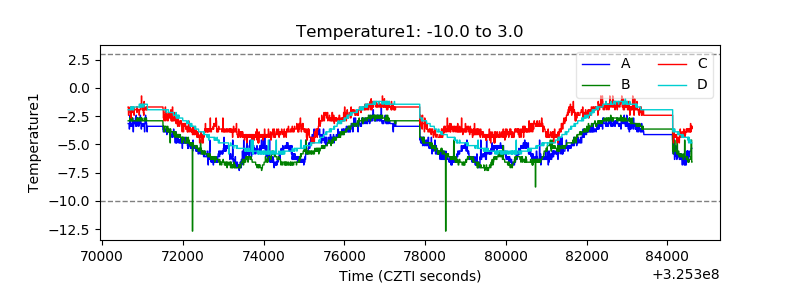 |
| Veto HV Monitor | 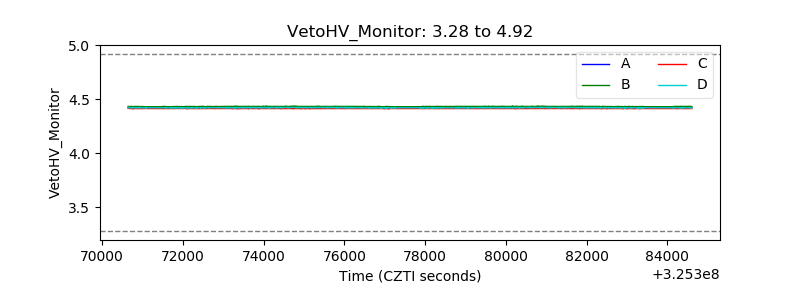 |
| Veto LLD | 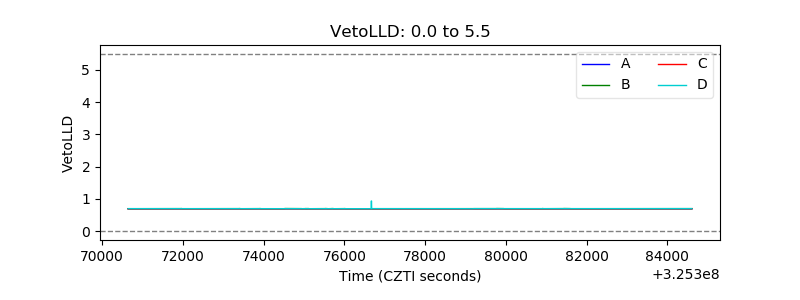 |
| Alpha Counter | 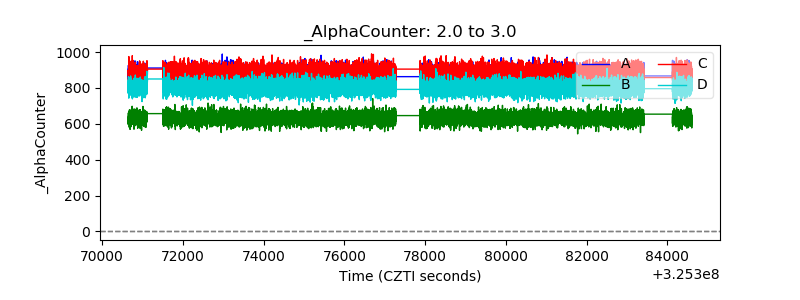 |
| _CPM_Rate | 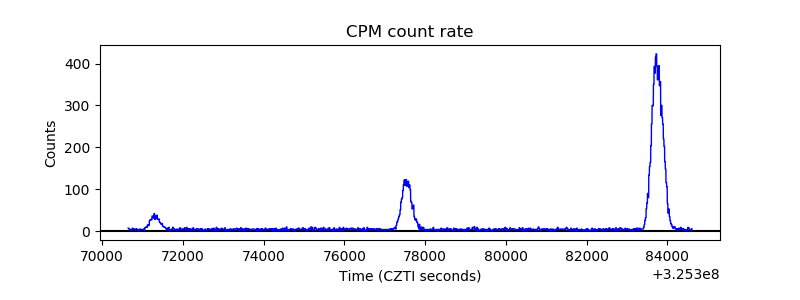 |
| CZT Counter | 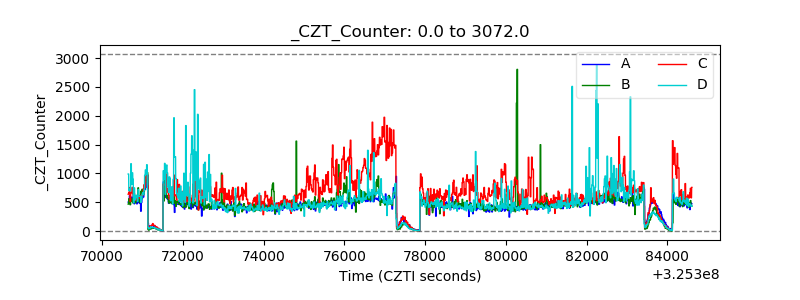 |
| +2.5 Volts monitor |  |
| +5 Volts monitor |  |
| _ROLL_ROT | 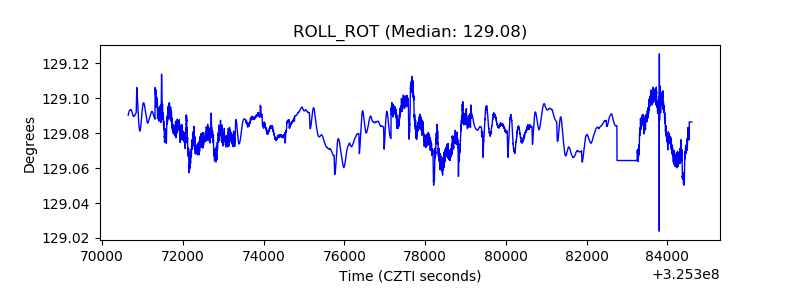 |
| _Roll_DEC | 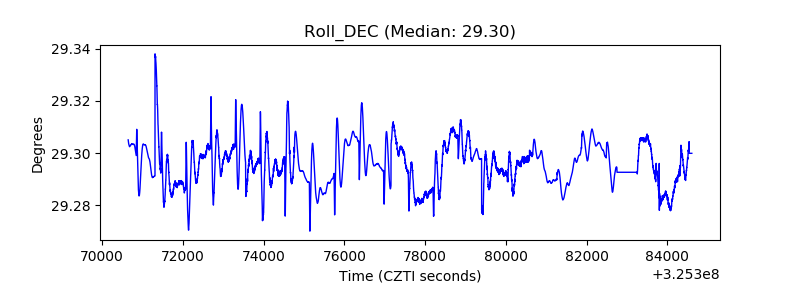 |
| _Roll_RA |  |
| Veto Counter | 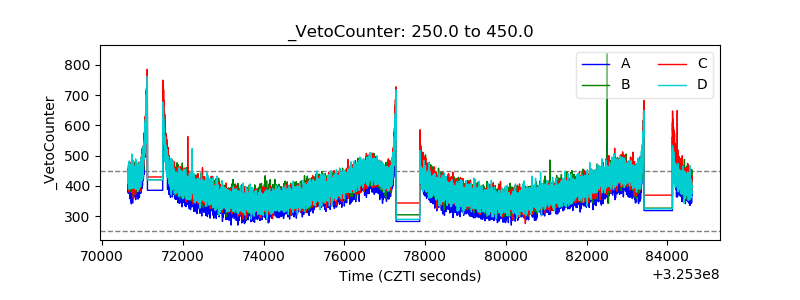 |