| Param | Original file | Final file |
|---|---|---|
| Filename | modeM0/AS1T03_194T01_9000003620_24717cztM0_level2.evt | modeM0/AS1T03_194T01_9000003620_24717cztM0_level2_quad_clean.evt |
| Size (bytes) | 30,458,880 | 3,991,680 |
| Size | 29.0 MB | 3.8 MB |
| Events in quadrant A | 206,493 | 19,646 |
| Events in quadrant B | 206,612 | 21,939 |
| Events in quadrant C | 259,438 | 18,564 |
| Events in quadrant D | 215,812 | 20,734 |
| Mode M9 | |||
|---|---|---|---|
| Quadrant | BADHDUFLAG | Total packets | Discarded packets |
| A | 0 | 8 | 8 |
| B | 0 | 8 | 8 |
| C | 0 | 8 | 8 |
| D | 0 | 9 | 9 |
| Mode M0 | |||
|---|---|---|---|
| Quadrant | BADHDUFLAG | Total packets | Discarded packets |
| A | 0 | 5589 | 4670 |
| B | 0 | 5667 | 4771 |
| C | 0 | 7021 | 5963 |
| D | 0 | 6316 | 5348 |
| Mode SS | |||
|---|---|---|---|
| Quadrant | BADHDUFLAG | Total packets | Discarded packets |
| A | 0 | 60 | 52 |
| B | 0 | 51 | 43 |
| C | 0 | 52 | 40 |
| D | 0 | 45 | 37 |
| Quadrant | Total seconds | Saturated seconds | Saturation percentage |
|---|---|---|---|
| A | 458 | 0 | 0.000000% |
| B | 447 | 0 | 0.000000% |
| C | 418 | 2 | 0.478469% |
| D | 473 | 0 | 0.000000% |
Noise dominated data is calculated using 1-second bins in cleaned event files. If a bin has >2000 counts, and if more than 50% of those come from <1% of pixels, then it is considered to be noise-dominated and hence unusable.
| Quadrant | # 1 sec bins | Bins with >0 counts | Bins with >2000 counts | High rate bins dominated by noise | Noise dominated (total time) | Noise dominated (detector-on time) | Marked lightcurve |
|---|---|---|---|---|---|---|---|
| A | 1343 | 614 | 0 | 0 | 0.00% | 0.00% | 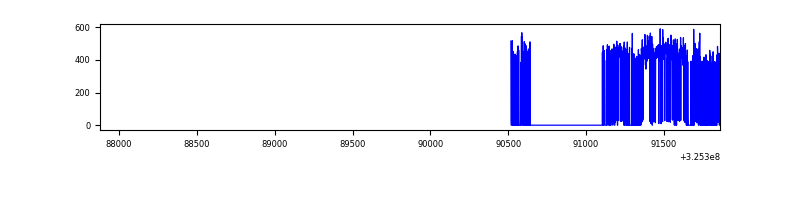 |
| B | 3982 | 605 | 0 | 0 | 0.00% | 0.00% | 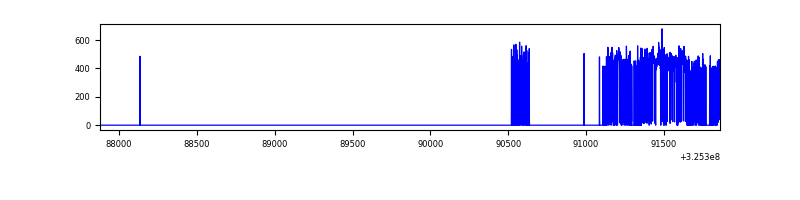 |
| C | 1326 | 578 | 0 | 0 | 0.00% | 0.00% | 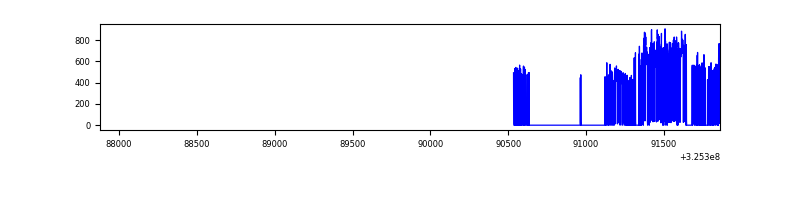 |
| D | 1341 | 629 | 0 | 0 | 0.00% | 0.00% | 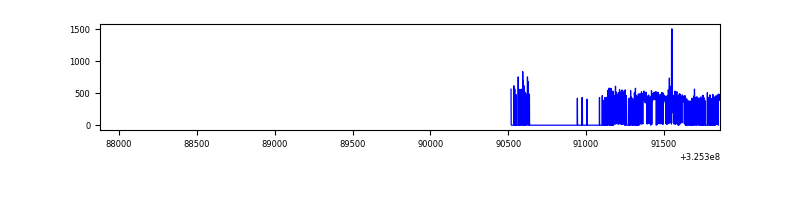 |
Top three noisy pixels from each quadrant. If the there are fewer than three noisy pixels in the level2.evt file, extra rows are filled as -1
| Pixel properties | Quadrant properties | ||||||
|---|---|---|---|---|---|---|---|
| Quadrant | DetID | PixID | Counts | Sigma | Mean | Median | Sigma |
| A | 13 | 254 | 727 | 52.29 | 53 | 52 | 12.9 |
| A | 3 | 137 | 499 | 34.63 | 53 | 52 | 12.9 |
| A | 0 | 226 | 438 | 29.9 | 53 | 52 | 12.9 |
| B | 12 | 111 | 1305 | 101.3 | 52 | 51 | 12.4 |
| B | 14 | 111 | 1054 | 81.03 | 52 | 51 | 12.4 |
| B | 11 | 111 | 1039 | 79.82 | 52 | 51 | 12.4 |
| C | 7 | 247 | 67155 | 5195.91 | 46 | 46 | 12.9 |
| C | 14 | 238 | 7309 | 562.34 | 46 | 46 | 12.9 |
| C | 3 | 233 | 2981 | 227.24 | 46 | 46 | 12.9 |
| D | 8 | 195 | 9834 | 650.82 | 52 | 50 | 15.0 |
| D | 13 | 104 | 4933 | 324.81 | 52 | 50 | 15.0 |
| D | 1 | 52 | 2504 | 163.24 | 52 | 50 | 15.0 |
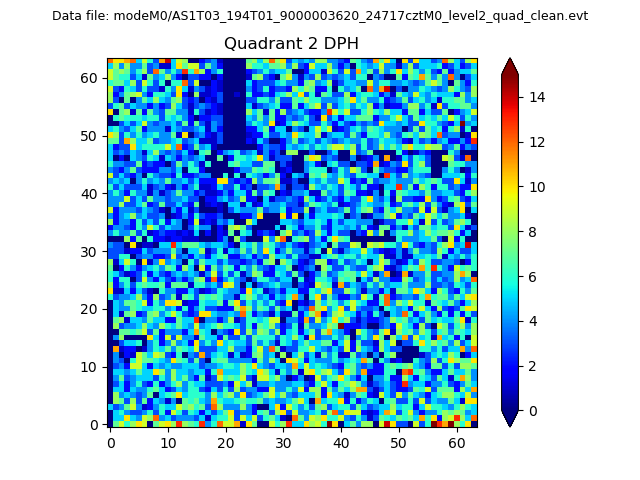
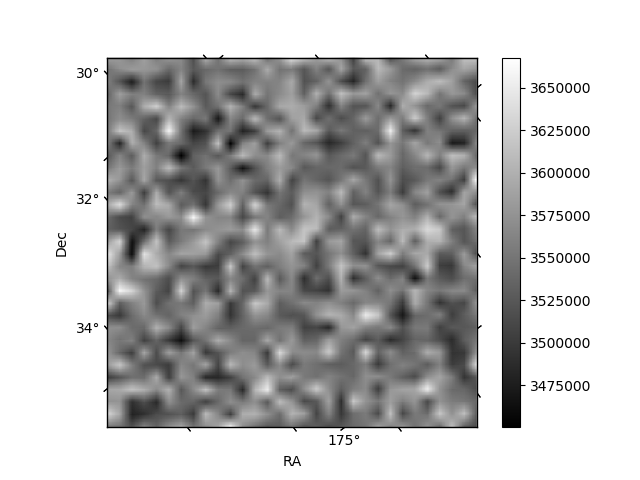
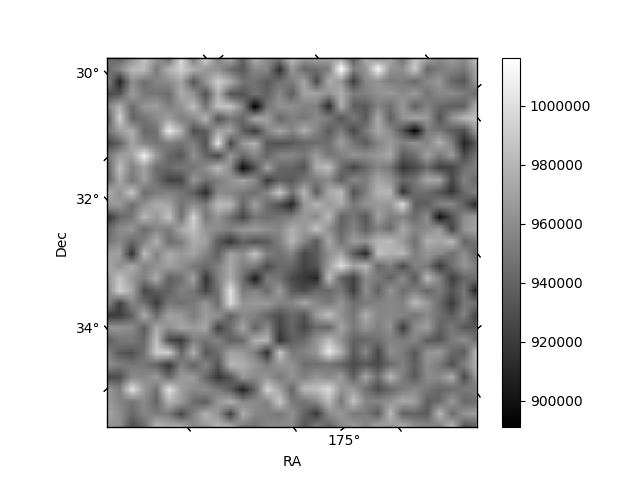
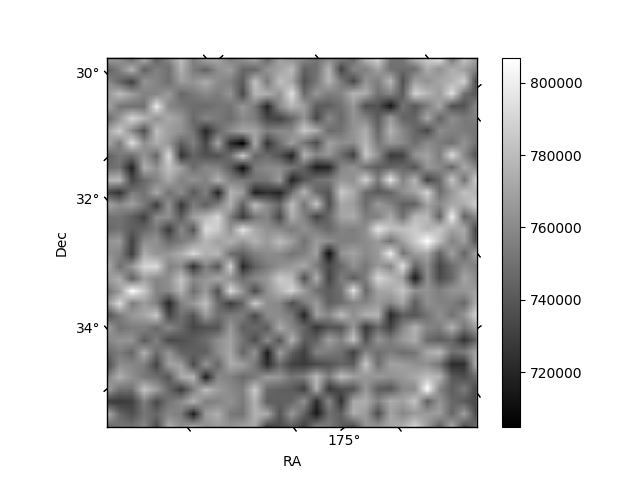
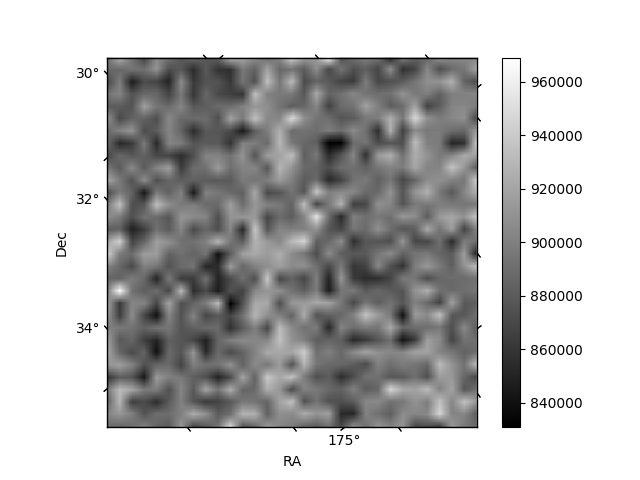
Histogram calculated using DETX and DETY for each event in the final _common_clean file
| Quadrant A | 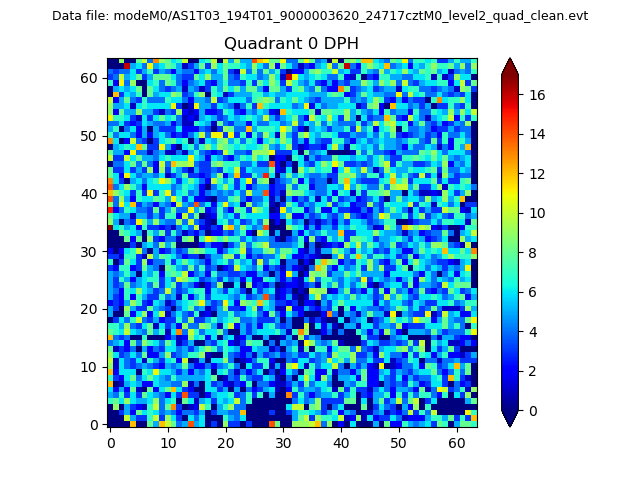 |
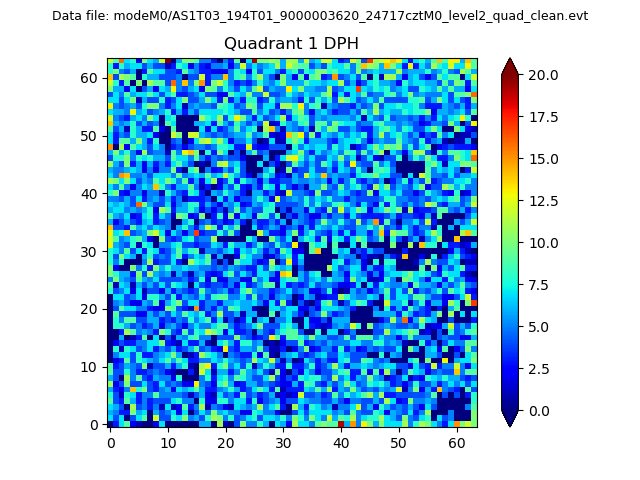 |
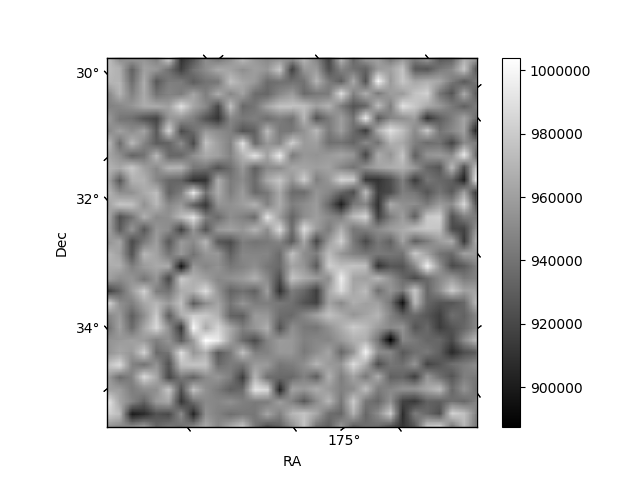
Quadrant B |
|---|---|---|---|
| Quadrant D | 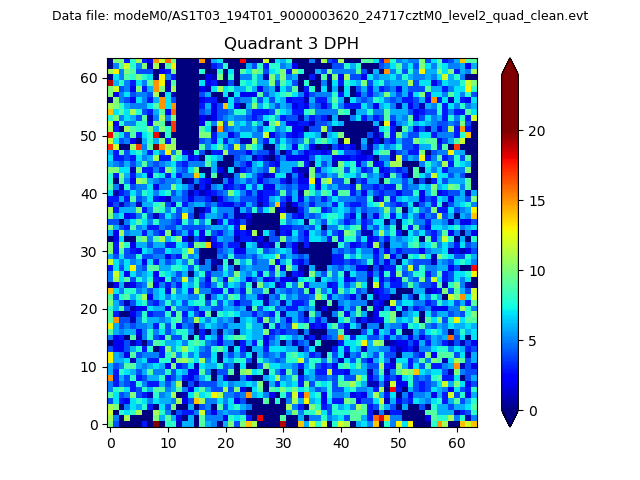 |
 |
Quadrant C |
| Plot type | Count rate plots | Images |
|---|---|---|
| Comparison with Poisson distribution Blue bars denote a histogram of data divided into 1 sec bins. Red curve is a Poisson curve with rate = median count rate of data. |
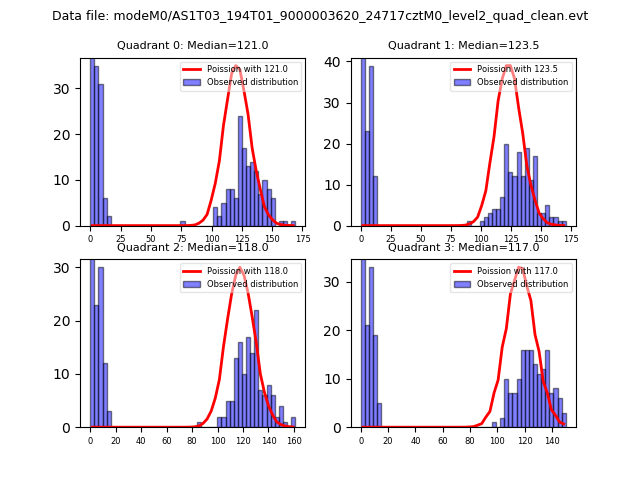 |
 |
| Quadrant-wise count rates Data is divided into 100 sec bins |
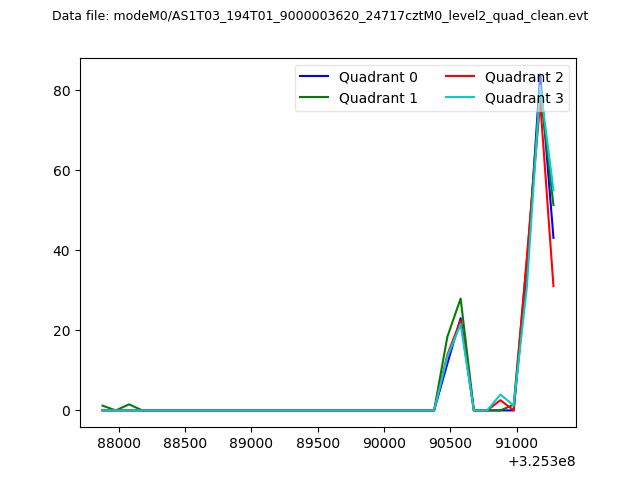 |
|
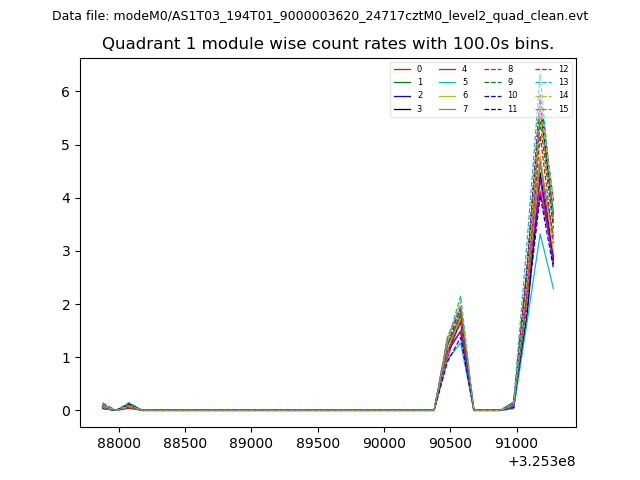
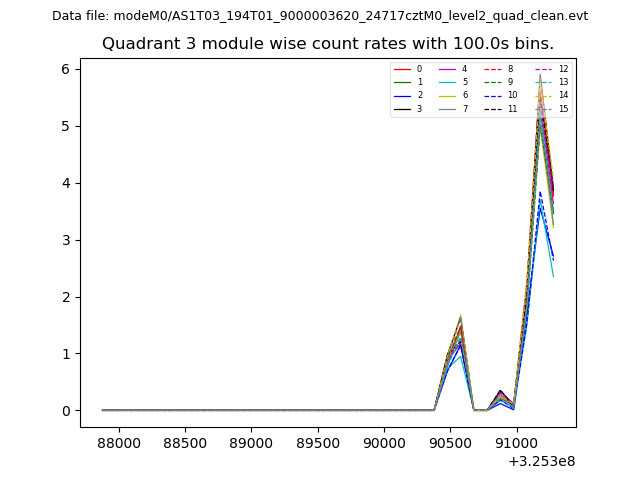
| Module-wise count rates for Quadrant A Data is divided into 100 sec bins |
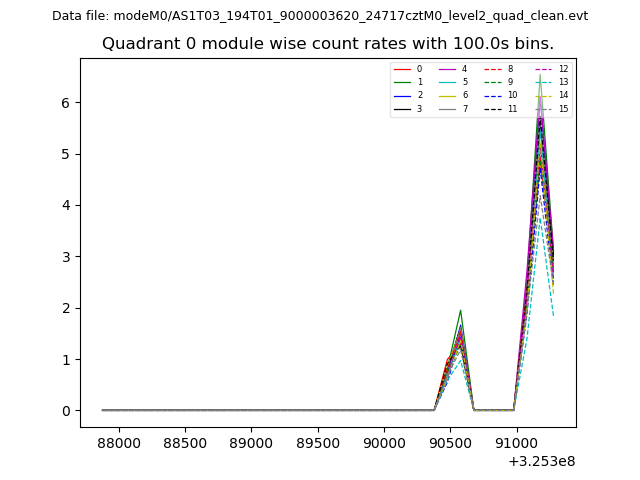 |
 |
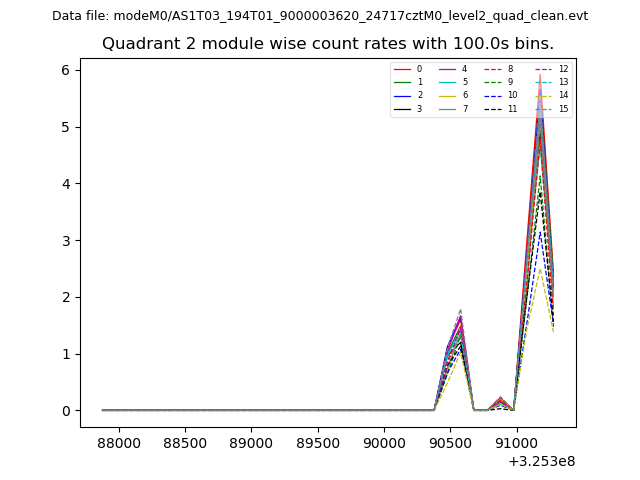
| Module-wise count rates for Quadrant B Data is divided into 100 sec bins |
 |
 |
| Module-wise count rates for Quadrant C Data is divided into 100 sec bins |
 |
 |
| Module-wise count rates for Quadrant D Data is divided into 100 sec bins |
 |
 |
| Parameter | Plot |
|---|---|
| CZT HV Monitor | 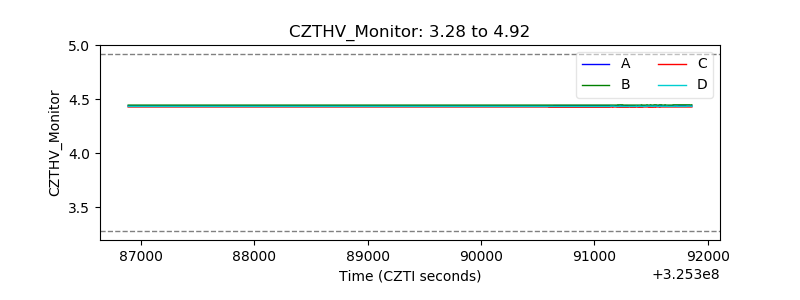 |
| D_VDD | 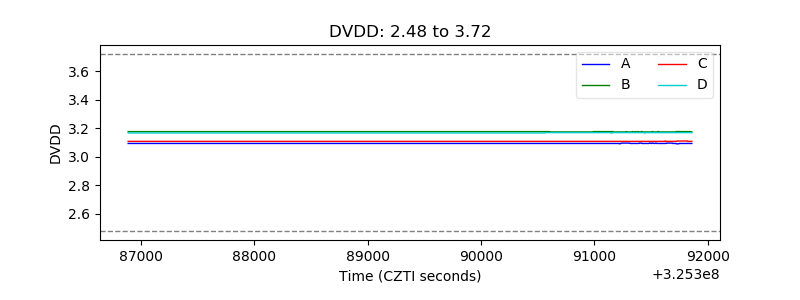 |
| Temperature 1 |  |
| Veto HV Monitor | 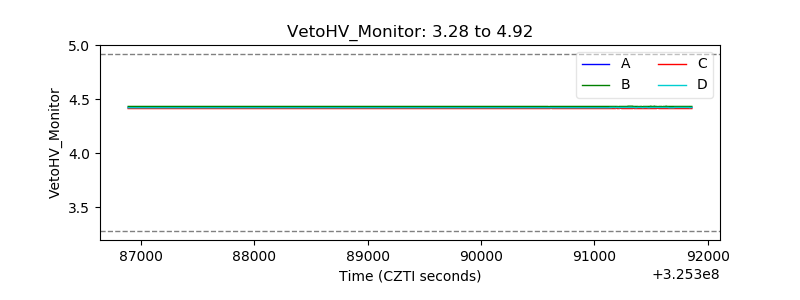 |
| Veto LLD | 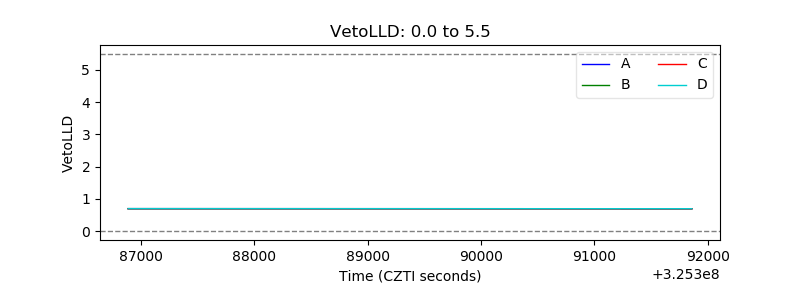 |
| Alpha Counter | 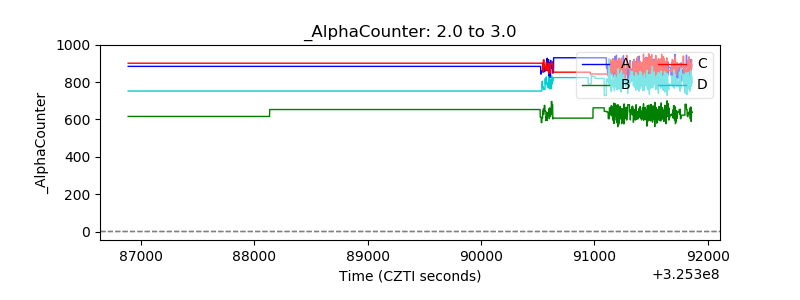 |
| _CPM_Rate | 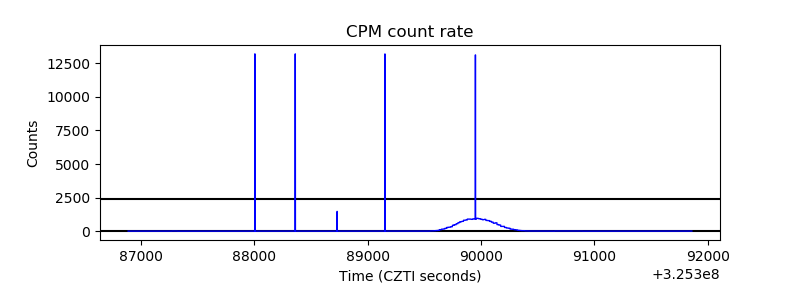 |
| CZT Counter | 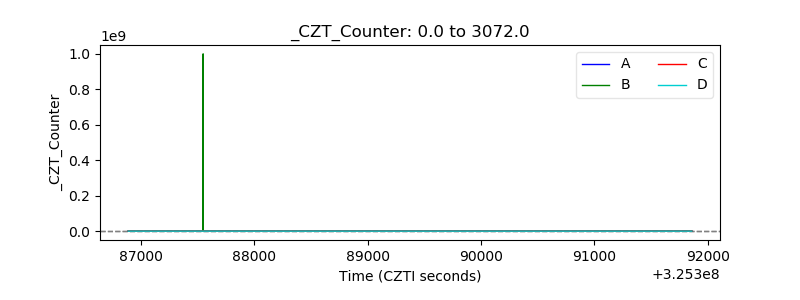 |
| +2.5 Volts monitor |  |
| +5 Volts monitor | 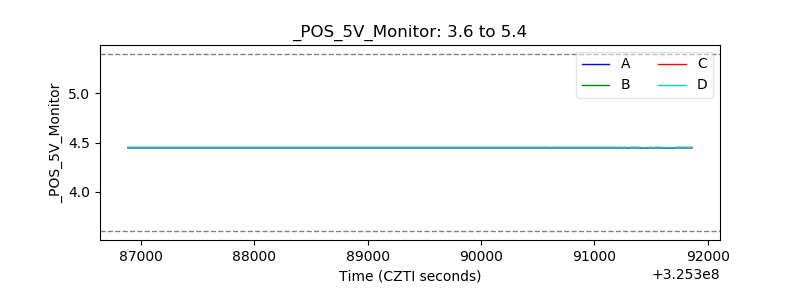 |
| _ROLL_ROT |  |
| _Roll_DEC | 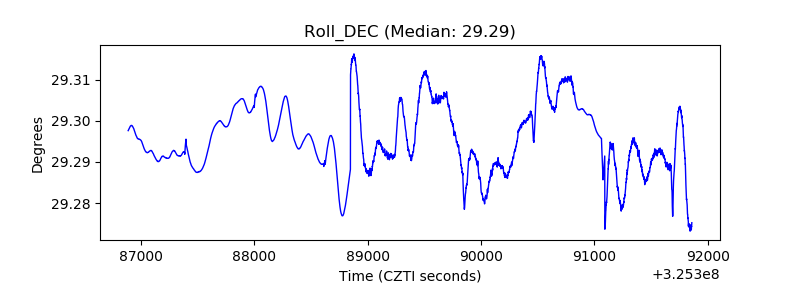 |
| _Roll_RA | 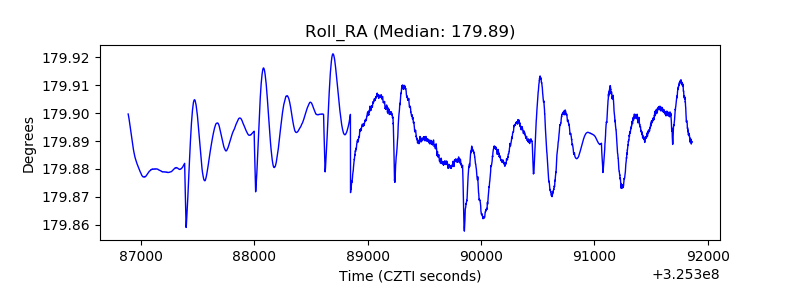 |
| Veto Counter | 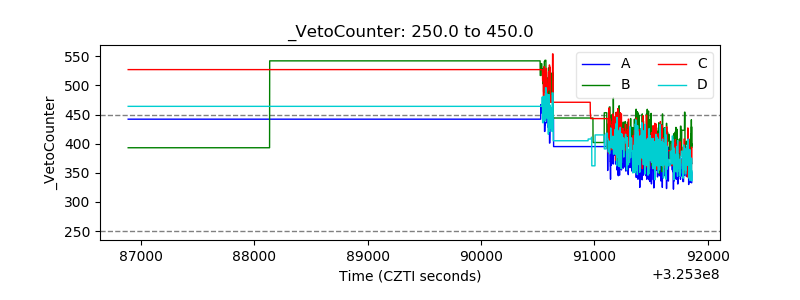 |