| Param | Original file | Final file |
|---|---|---|
| Filename | modeM0/AS1T03_194T01_9000003620_24721cztM0_level2.evt | modeM0/AS1T03_194T01_9000003620_24721cztM0_level2_quad_clean.evt |
| Size (bytes) | 489,767,040 | 66,614,400 |
| Size | 467.1 MB | 63.5 MB |
| Events in quadrant A | 3,343,860 | 407,113 |
| Events in quadrant B | 3,784,451 | 408,121 |
| Events in quadrant C | 3,831,160 | 384,415 |
| Events in quadrant D | 3,450,409 | 382,250 |
| Mode M9 | |||
|---|---|---|---|
| Quadrant | BADHDUFLAG | Total packets | Discarded packets |
| A | 0 | 16 | 0 |
| B | 0 | 17 | 0 |
| C | 0 | 17 | 0 |
| D | 0 | 17 | 0 |
| Mode M0 | |||
|---|---|---|---|
| Quadrant | BADHDUFLAG | Total packets | Discarded packets |
| A | 0 | 13670 | 2 |
| B | 0 | 15184 | 3 |
| C | 0 | 15653 | 2 |
| D | 0 | 14039 | 2 |
| Mode SS | |||
|---|---|---|---|
| Quadrant | BADHDUFLAG | Total packets | Discarded packets |
| A | 0 | 128 | 0 |
| B | 0 | 128 | 0 |
| C | 0 | 128 | 0 |
| D | 0 | 128 | 0 |
| Quadrant | Total seconds | Saturated seconds | Saturation percentage |
|---|---|---|---|
| A | 6228 | 58 | 0.931278% |
| B | 6227 | 142 | 2.280392% |
| C | 6227 | 106 | 1.702264% |
| D | 6227 | 44 | 0.706600% |
Noise dominated data is calculated using 1-second bins in cleaned event files. If a bin has >2000 counts, and if more than 50% of those come from <1% of pixels, then it is considered to be noise-dominated and hence unusable.
| Quadrant | # 1 sec bins | Bins with >0 counts | Bins with >2000 counts | High rate bins dominated by noise | Noise dominated (total time) | Noise dominated (detector-on time) | Marked lightcurve |
|---|---|---|---|---|---|---|---|
| A | 7473 | 6228 | 0 | 0 | 0.00% | 0.00% |  |
| B | 7472 | 6227 | 60 | 60 | 0.80% | 0.96% |  |
| C | 7472 | 6227 | 7 | 7 | 0.09% | 0.11% | 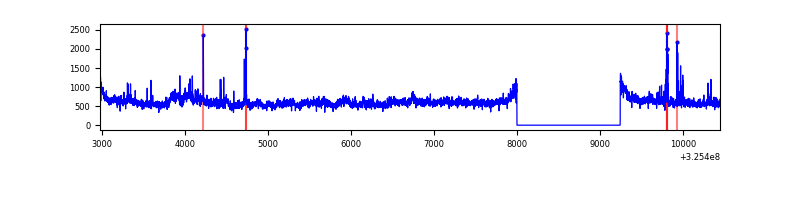 |
| D | 7472 | 6227 | 16 | 16 | 0.21% | 0.26% | 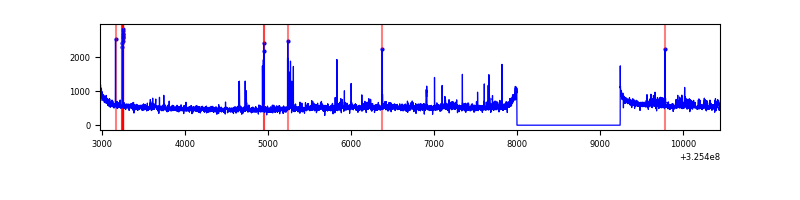 |
Top three noisy pixels from each quadrant. If the there are fewer than three noisy pixels in the level2.evt file, extra rows are filled as -1
| Pixel properties | Quadrant properties | ||||||
|---|---|---|---|---|---|---|---|
| Quadrant | DetID | PixID | Counts | Sigma | Mean | Median | Sigma |
| A | 13 | 254 | 8806 | 46.65 | 867 | 854 | 170.4 |
| A | 0 | 226 | 7540 | 39.23 | 867 | 854 | 170.4 |
| A | 3 | 137 | 7337 | 38.04 | 867 | 854 | 170.4 |
| B | 4 | 200 | 379402 | 2343.56 | 855 | 837 | 161.5 |
| B | 0 | 189 | 29731 | 178.87 | 855 | 837 | 161.5 |
| B | 12 | 111 | 19553 | 115.86 | 855 | 837 | 161.5 |
| C | 7 | 247 | 313008 | 1683.3 | 809 | 817 | 185.5 |
| C | 14 | 238 | 131221 | 703.12 | 809 | 817 | 185.5 |
| C | 2 | 16 | 107362 | 574.48 | 809 | 817 | 185.5 |
| D | 1 | 52 | 150461 | 757.39 | 826 | 805 | 197.6 |
| D | 8 | 195 | 106284 | 533.82 | 826 | 805 | 197.6 |
| D | 13 | 138 | 26383 | 129.45 | 826 | 805 | 197.6 |
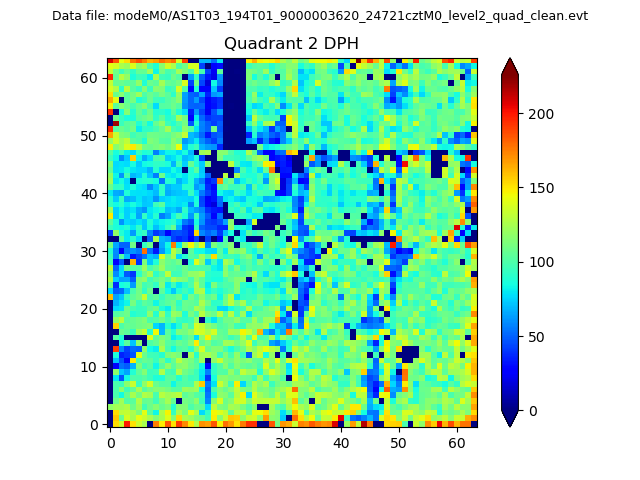
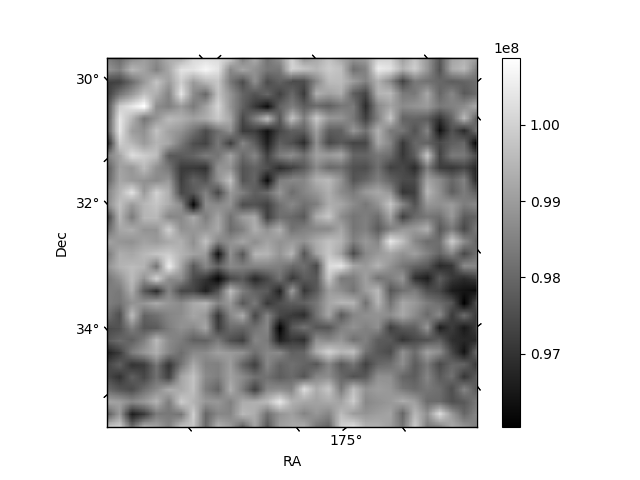
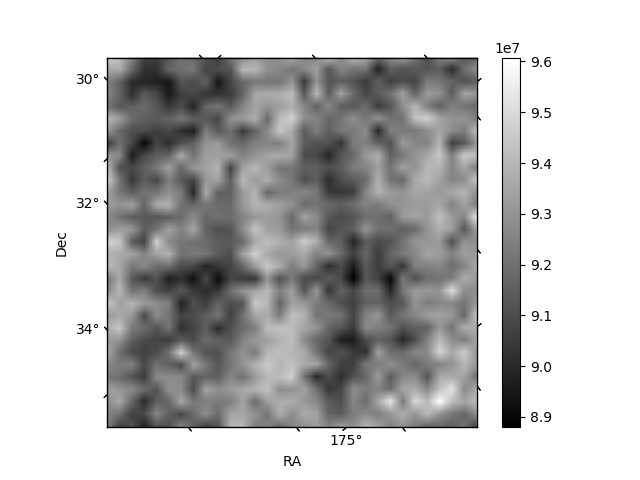
Histogram calculated using DETX and DETY for each event in the final _common_clean file
| Quadrant A | 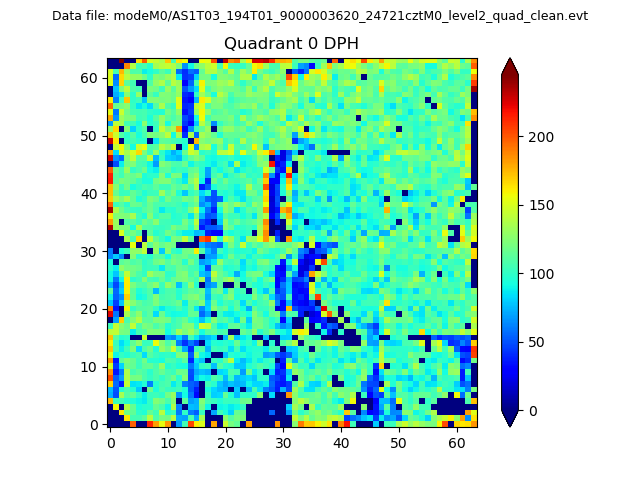 |
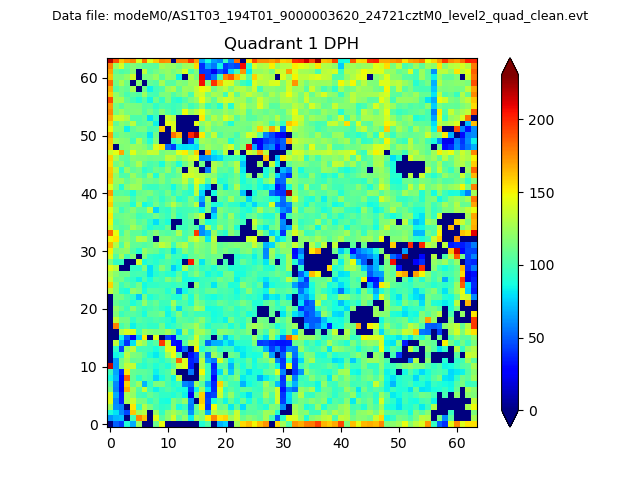 |
Quadrant B |
|---|---|---|---|
| Quadrant D | 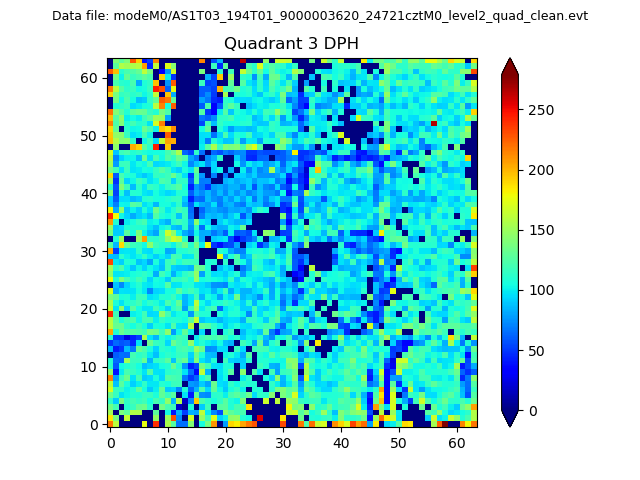 |
 |
Quadrant C |
| Plot type | Count rate plots | Images |
|---|---|---|
| Comparison with Poisson distribution Blue bars denote a histogram of data divided into 1 sec bins. Red curve is a Poisson curve with rate = median count rate of data. |
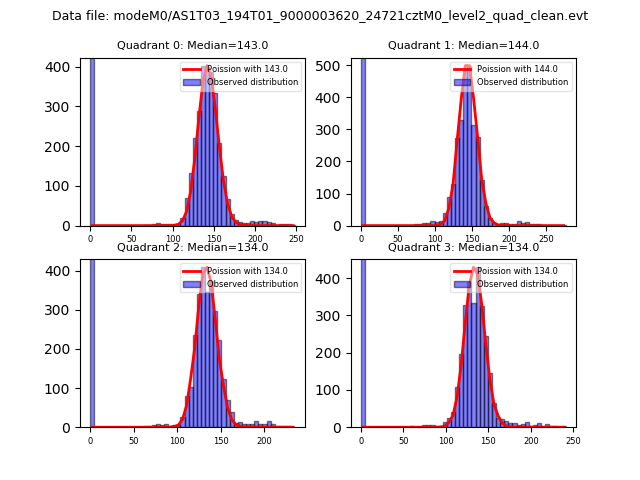 |
 |
| Quadrant-wise count rates Data is divided into 100 sec bins |
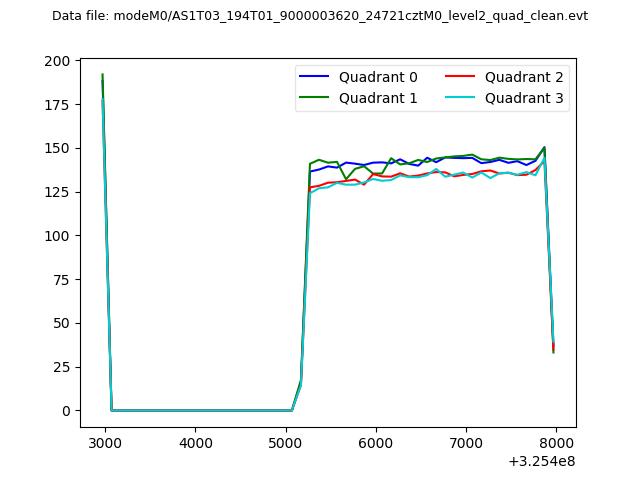 |
|
| Module-wise count rates for Quadrant A Data is divided into 100 sec bins |
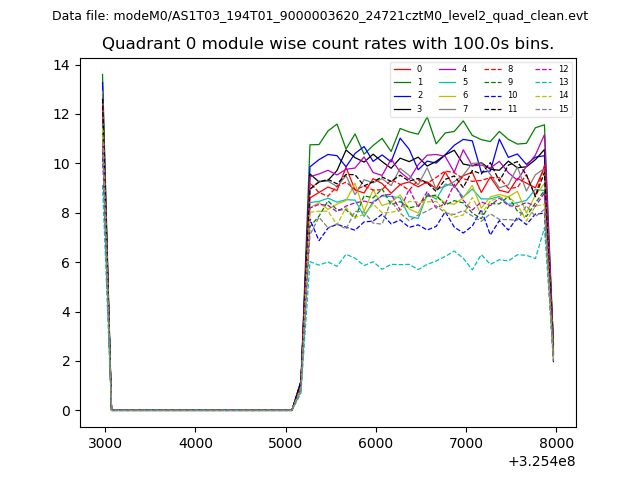 |
 |
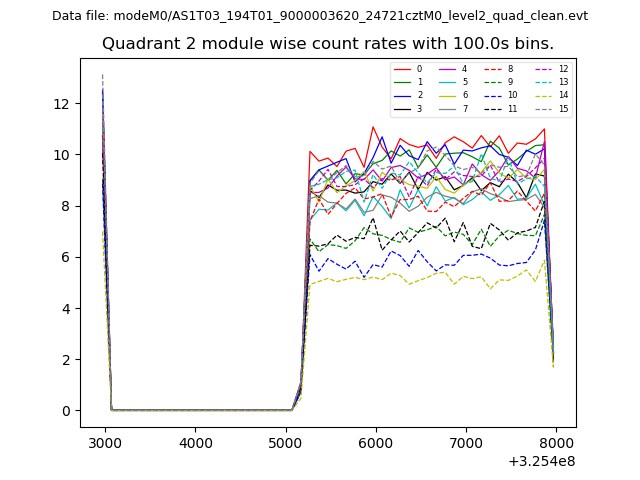
| Module-wise count rates for Quadrant B Data is divided into 100 sec bins |
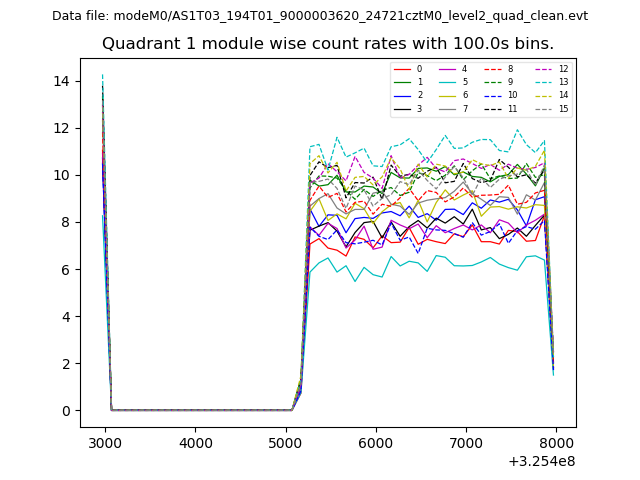 |
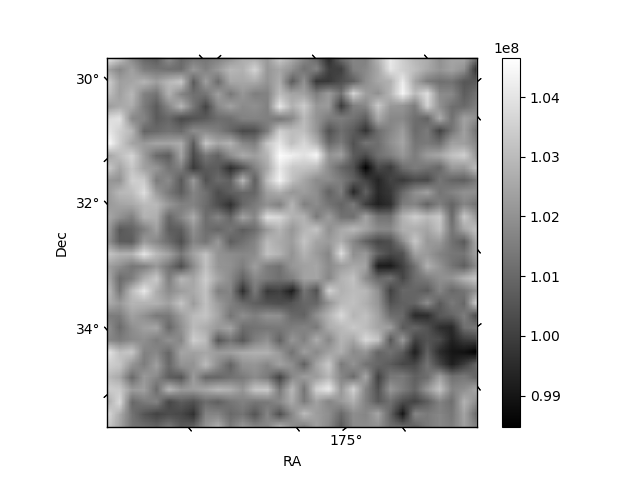 |
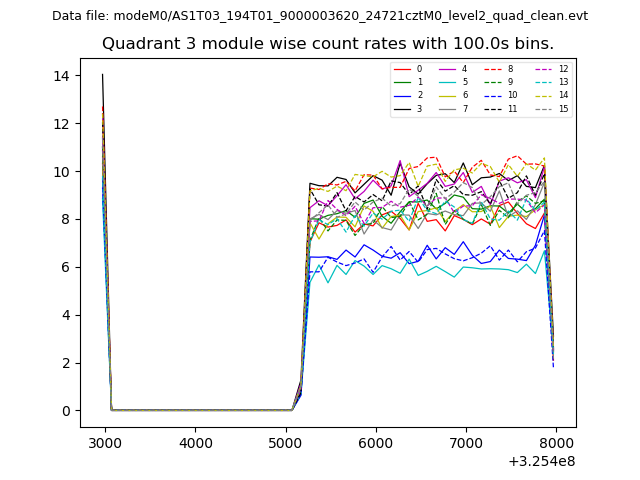
| Module-wise count rates for Quadrant C Data is divided into 100 sec bins |
 |
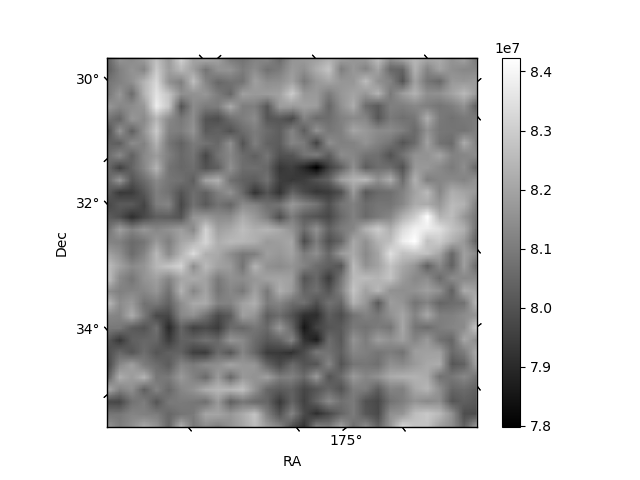 |
| Module-wise count rates for Quadrant D Data is divided into 100 sec bins |
 |
 |
| Parameter | Plot |
|---|---|
| CZT HV Monitor | 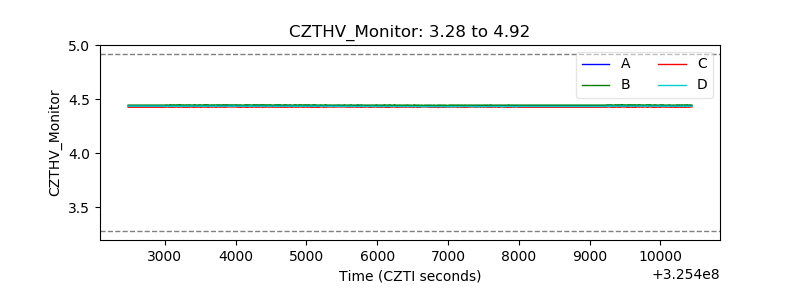 |
| D_VDD | 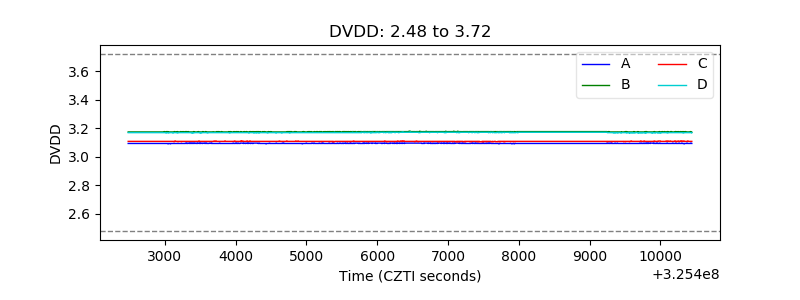 |
| Temperature 1 | 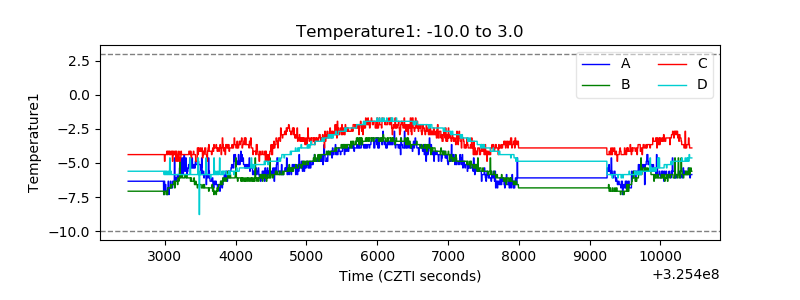 |
| Veto HV Monitor |  |
| Veto LLD | 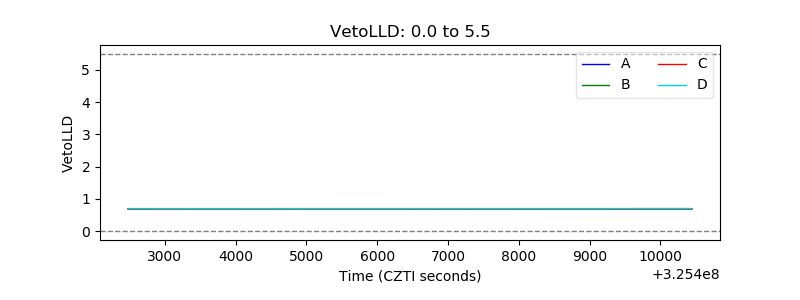 |
| Alpha Counter | 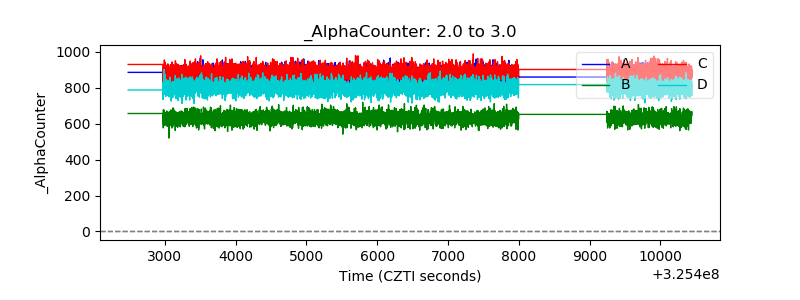 |
| _CPM_Rate | 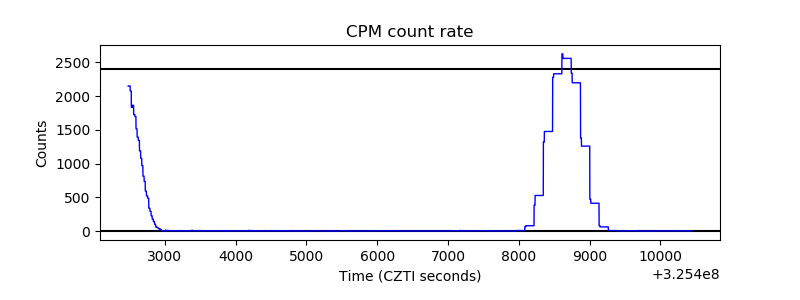 |
| CZT Counter | 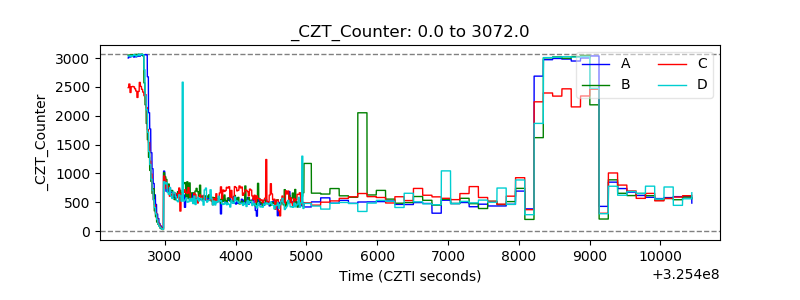 |
| +2.5 Volts monitor |  |
| +5 Volts monitor |  |
| _ROLL_ROT | 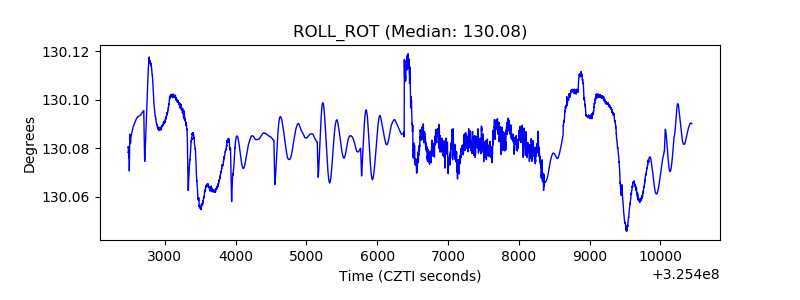 |
| _Roll_DEC | 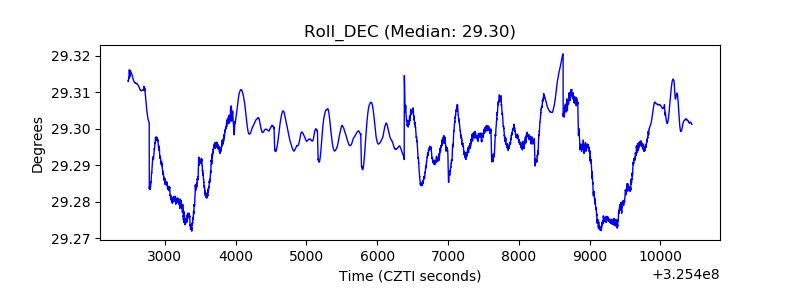 |
| _Roll_RA | 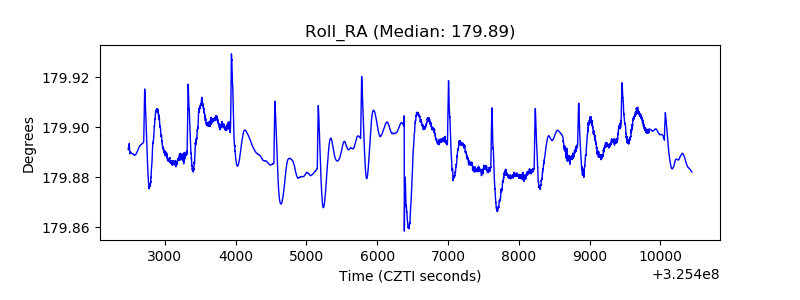 |
| Veto Counter | 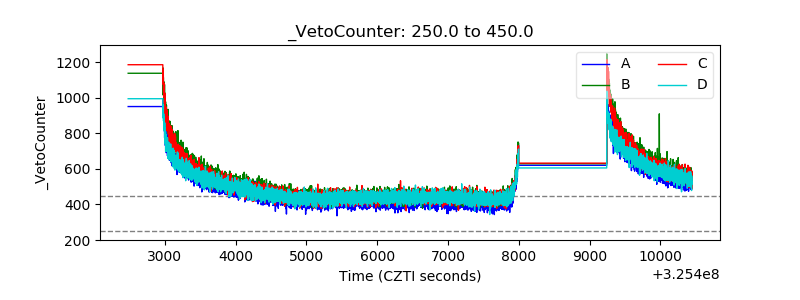 |