| Param | Original file | Final file |
|---|---|---|
| Filename | modeM0/AS1T03_194T01_9000003620_24722cztM0_level2.evt | modeM0/AS1T03_194T01_9000003620_24722cztM0_level2_quad_clean.evt |
| Size (bytes) | 494,127,360 | 73,134,720 |
| Size | 471.2 MB | 69.7 MB |
| Events in quadrant A | 3,504,614 | 459,475 |
| Events in quadrant B | 3,551,574 | 463,697 |
| Events in quadrant C | 3,657,805 | 429,870 |
| Events in quadrant D | 3,828,371 | 426,706 |
| Mode M9 | |||
|---|---|---|---|
| Quadrant | BADHDUFLAG | Total packets | Discarded packets |
| A | 0 | 20 | 0 |
| B | 0 | 21 | 0 |
| C | 0 | 21 | 0 |
| D | 0 | 21 | 0 |
| Mode M0 | |||
|---|---|---|---|
| Quadrant | BADHDUFLAG | Total packets | Discarded packets |
| A | 0 | 14253 | 2 |
| B | 0 | 14424 | 2 |
| C | 0 | 14793 | 2 |
| D | 0 | 15427 | 2 |
| Mode SS | |||
|---|---|---|---|
| Quadrant | BADHDUFLAG | Total packets | Discarded packets |
| A | 0 | 126 | 0 |
| B | 0 | 126 | 0 |
| C | 0 | 126 | 0 |
| D | 0 | 126 | 0 |
| Quadrant | Total seconds | Saturated seconds | Saturation percentage |
|---|---|---|---|
| A | 6230 | 64 | 1.027287% |
| B | 6230 | 83 | 1.332263% |
| C | 6230 | 105 | 1.685393% |
| D | 6230 | 73 | 1.171750% |
Noise dominated data is calculated using 1-second bins in cleaned event files. If a bin has >2000 counts, and if more than 50% of those come from <1% of pixels, then it is considered to be noise-dominated and hence unusable.
| Quadrant | # 1 sec bins | Bins with >0 counts | Bins with >2000 counts | High rate bins dominated by noise | Noise dominated (total time) | Noise dominated (detector-on time) | Marked lightcurve |
|---|---|---|---|---|---|---|---|
| A | 7545 | 6230 | 0 | 0 | 0.00% | 0.00% | 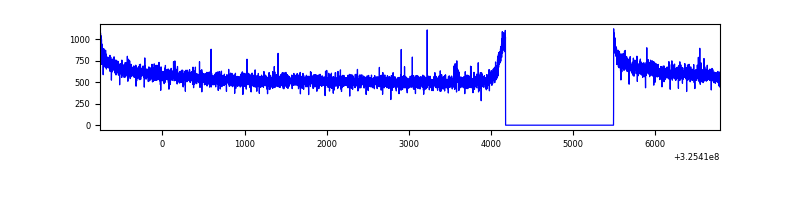 |
| B | 7545 | 6230 | 0 | 0 | 0.00% | 0.00% | 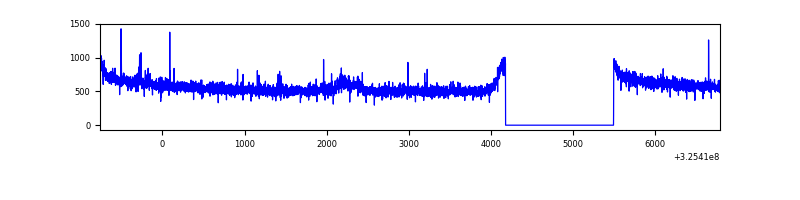 |
| C | 7545 | 6230 | 4 | 4 | 0.05% | 0.06% | 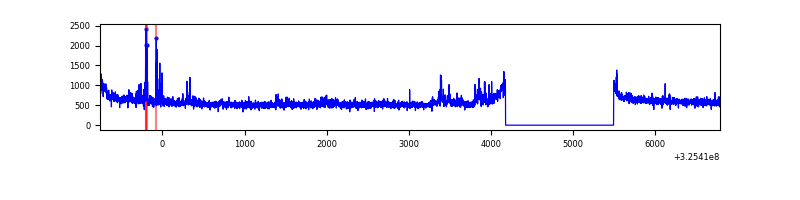 |
| D | 7545 | 6230 | 37 | 37 | 0.49% | 0.59% | 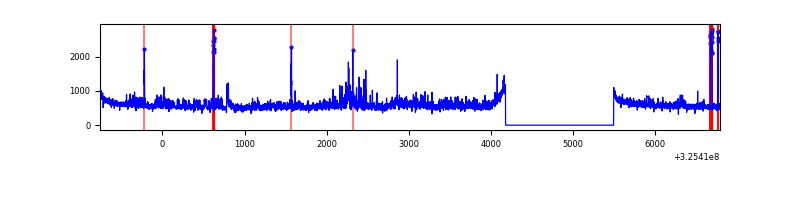 |
Top three noisy pixels from each quadrant. If the there are fewer than three noisy pixels in the level2.evt file, extra rows are filled as -1
| Pixel properties | Quadrant properties | ||||||
|---|---|---|---|---|---|---|---|
| Quadrant | DetID | PixID | Counts | Sigma | Mean | Median | Sigma |
| A | 13 | 254 | 9778 | 49.97 | 908 | 895 | 177.7 |
| A | 0 | 226 | 7747 | 38.55 | 908 | 895 | 177.7 |
| A | 3 | 137 | 7575 | 37.58 | 908 | 895 | 177.7 |
| B | 7 | 202 | 32046 | 187.08 | 892 | 875 | 166.6 |
| B | 0 | 189 | 26005 | 150.83 | 892 | 875 | 166.6 |
| B | 12 | 111 | 20002 | 114.8 | 892 | 875 | 166.6 |
| C | 14 | 238 | 136877 | 702.17 | 841 | 850 | 193.7 |
| C | 7 | 247 | 123163 | 631.38 | 841 | 850 | 193.7 |
| C | 3 | 233 | 71690 | 365.67 | 841 | 850 | 193.7 |
| D | 1 | 52 | 375258 | 1834.03 | 860 | 837 | 204.2 |
| D | 8 | 195 | 148356 | 722.6 | 860 | 837 | 204.2 |
| D | 7 | 238 | 36031 | 172.39 | 860 | 837 | 204.2 |
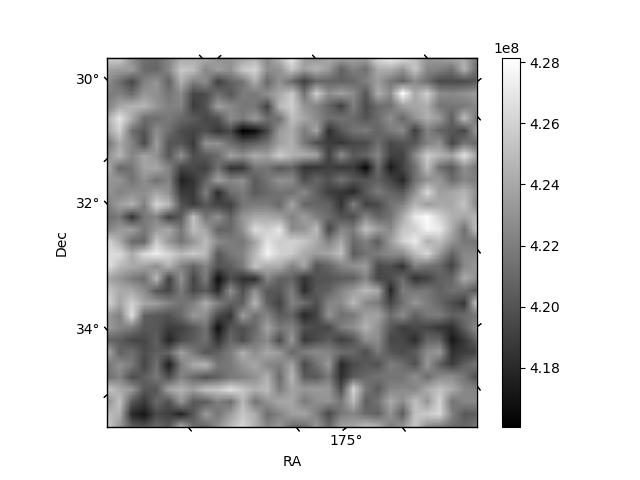
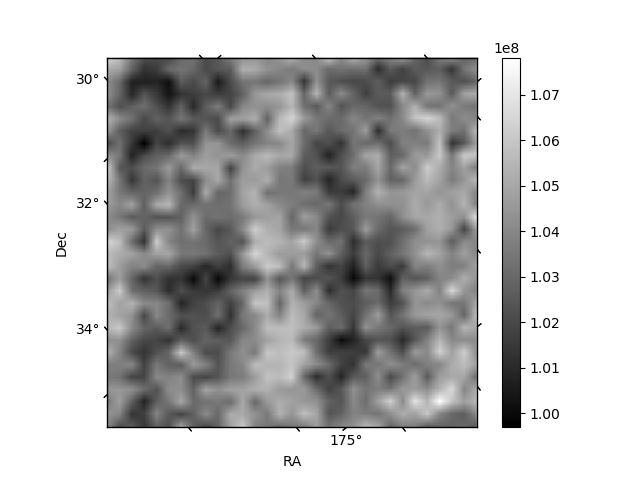
Histogram calculated using DETX and DETY for each event in the final _common_clean file
| Quadrant A | 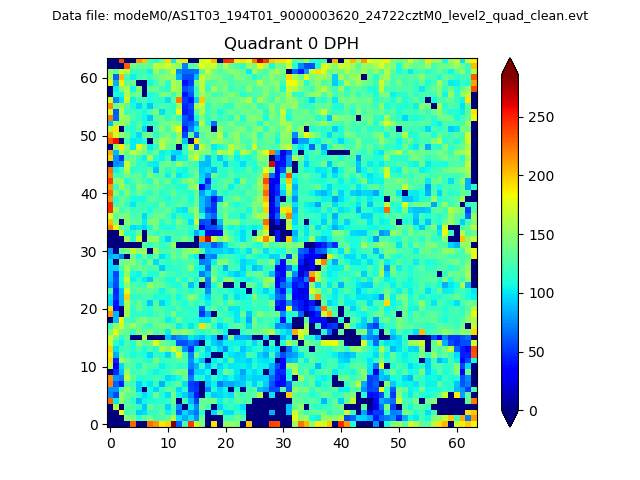 |
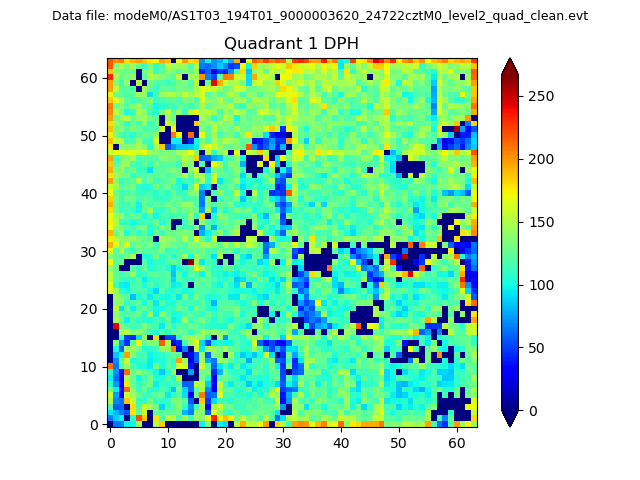 |
Quadrant B |
|---|---|---|---|
| Quadrant D | 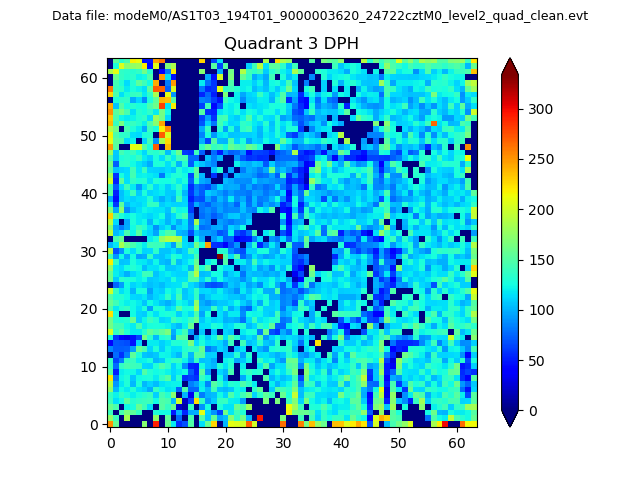 |
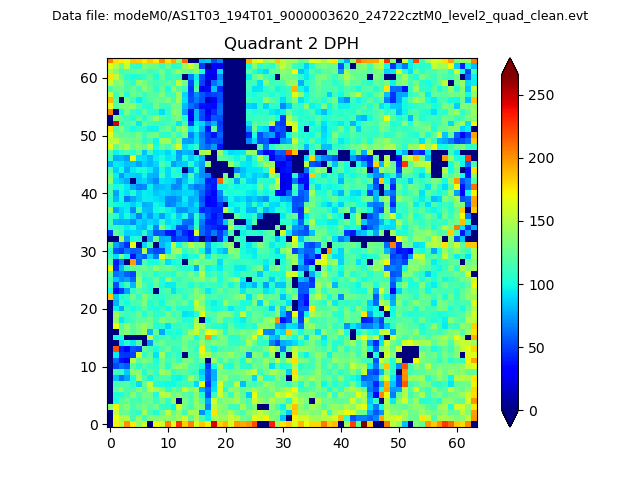 |
Quadrant C |
| Plot type | Count rate plots | Images |
|---|---|---|
| Comparison with Poisson distribution Blue bars denote a histogram of data divided into 1 sec bins. Red curve is a Poisson curve with rate = median count rate of data. |
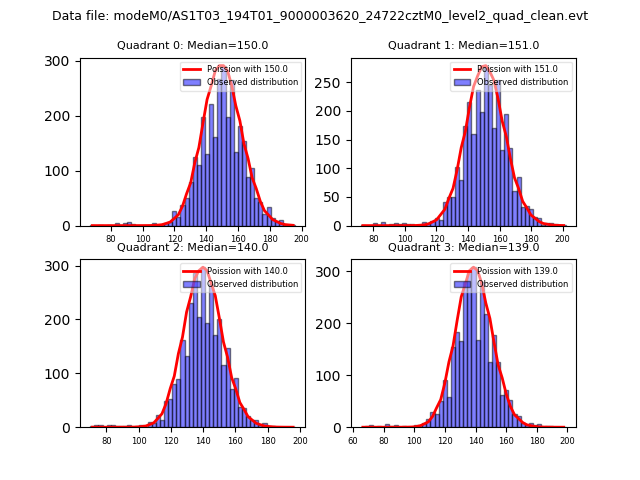 |
 |
| Quadrant-wise count rates Data is divided into 100 sec bins |
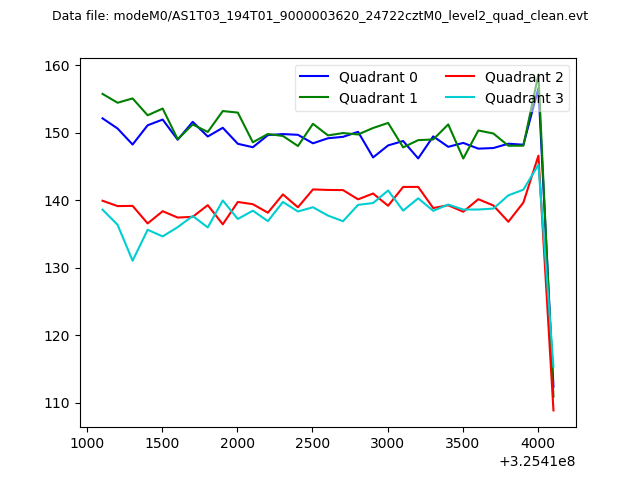 |
|
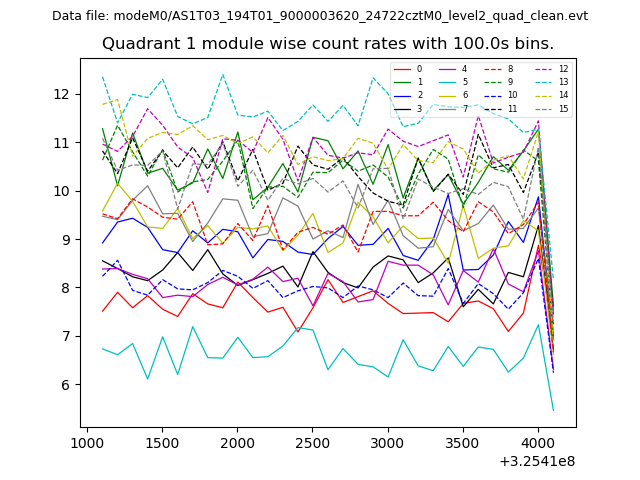
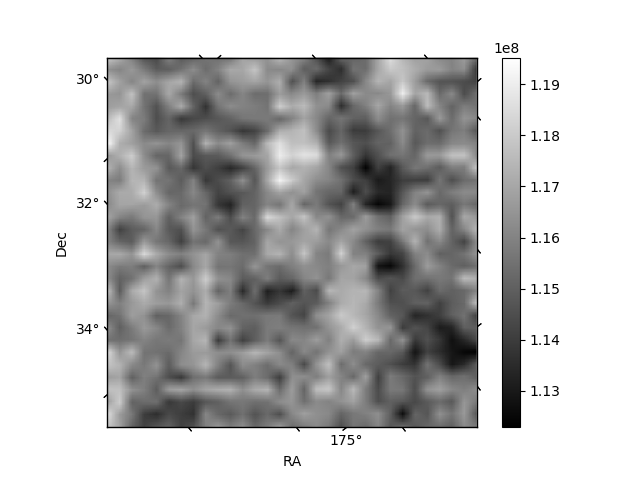
| Module-wise count rates for Quadrant A Data is divided into 100 sec bins |
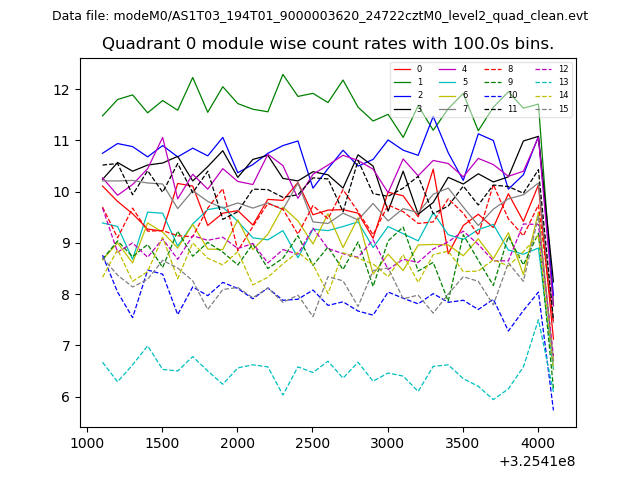 |
 |
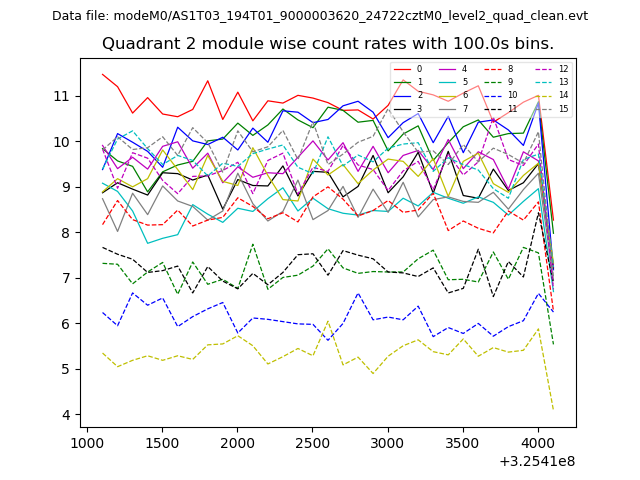
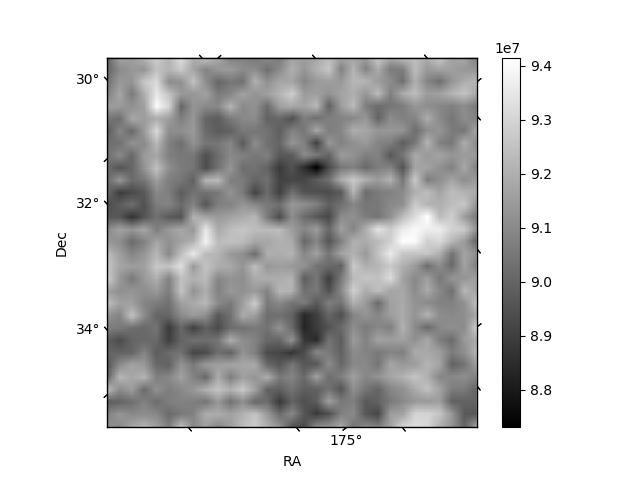
| Module-wise count rates for Quadrant B Data is divided into 100 sec bins |
 |
 |
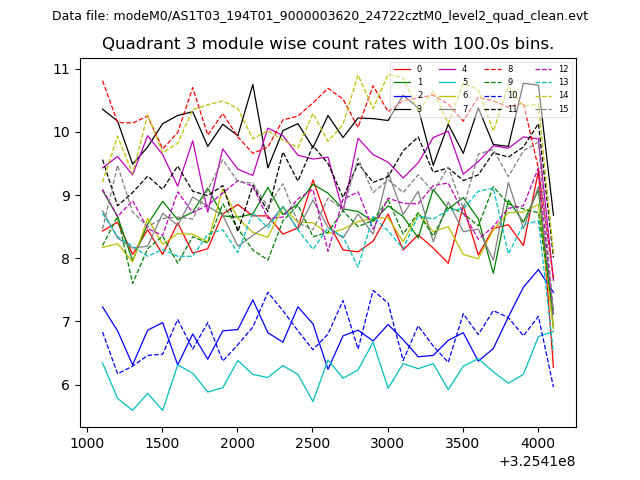
| Module-wise count rates for Quadrant C Data is divided into 100 sec bins |
 |
 |
| Module-wise count rates for Quadrant D Data is divided into 100 sec bins |
 |
 |
| Parameter | Plot |
|---|---|
| CZT HV Monitor | 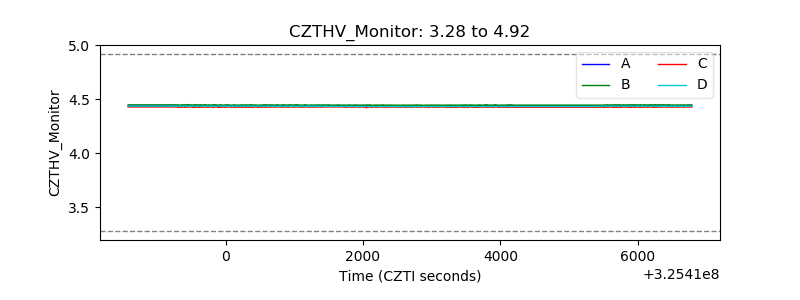 |
| D_VDD | 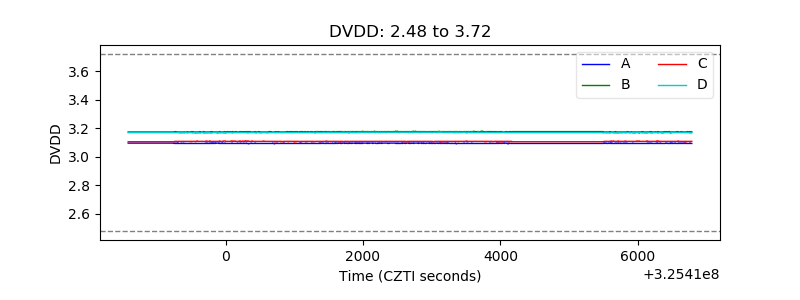 |
| Temperature 1 |  |
| Veto HV Monitor | 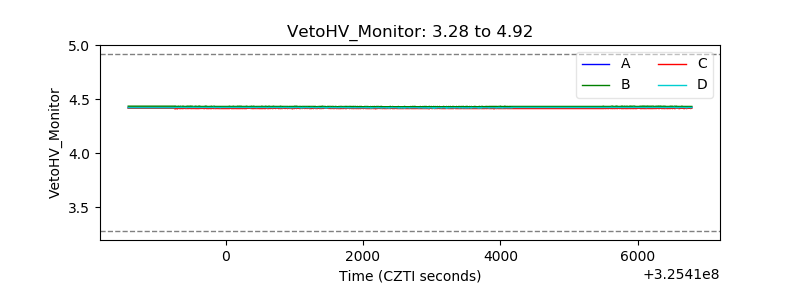 |
| Veto LLD | 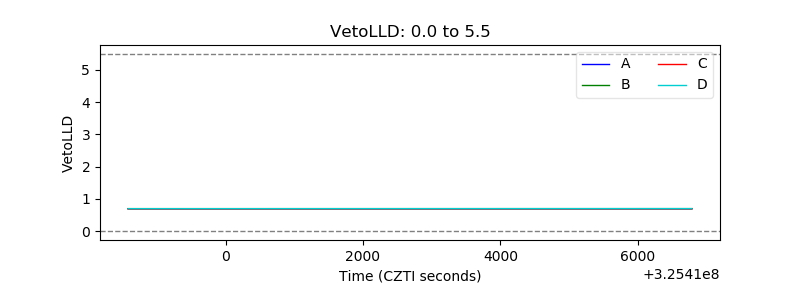 |
| Alpha Counter | 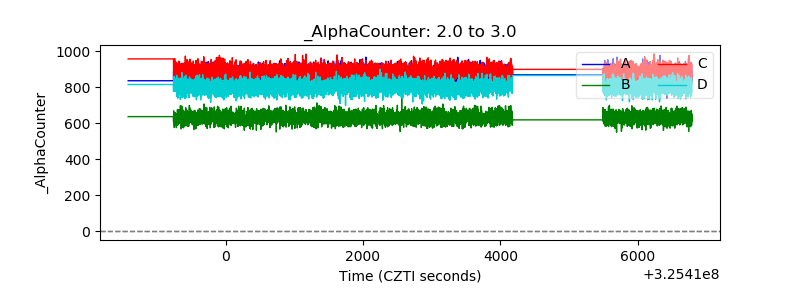 |
| _CPM_Rate | 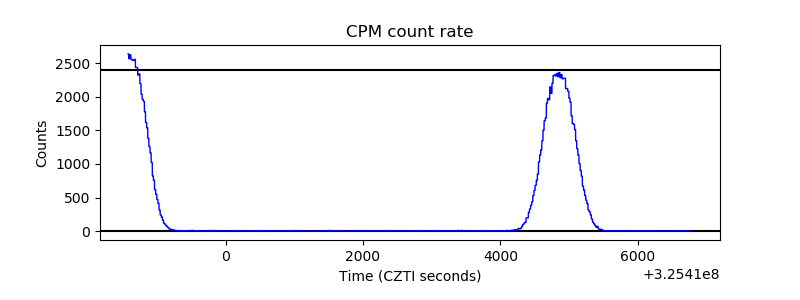 |
| CZT Counter | 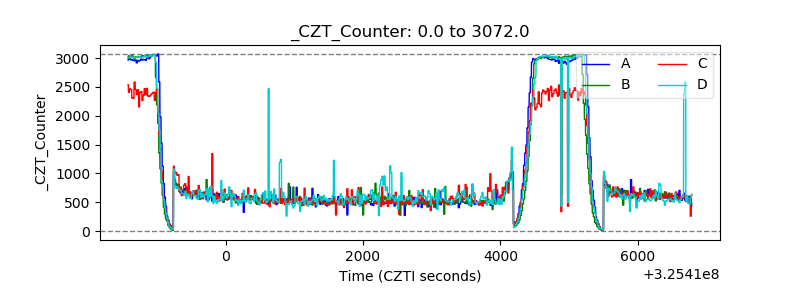 |
| +2.5 Volts monitor |  |
| +5 Volts monitor | 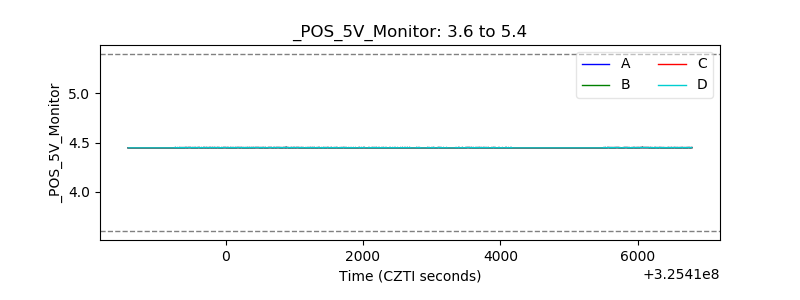 |
| _ROLL_ROT |  |
| _Roll_DEC | 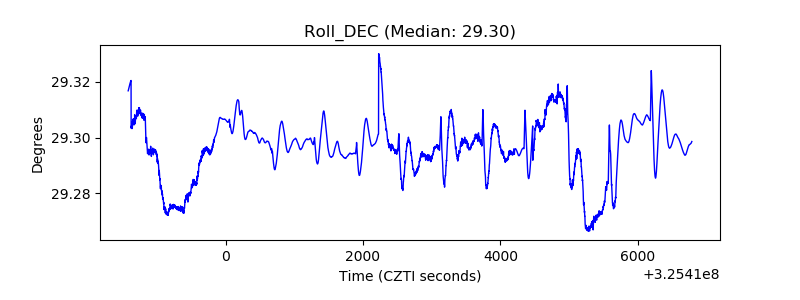 |
| _Roll_RA | 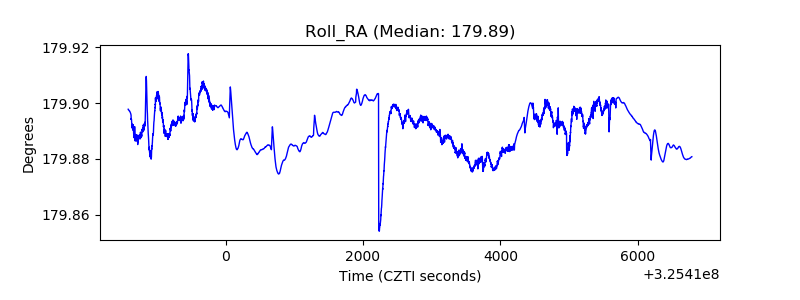 |
| Veto Counter | 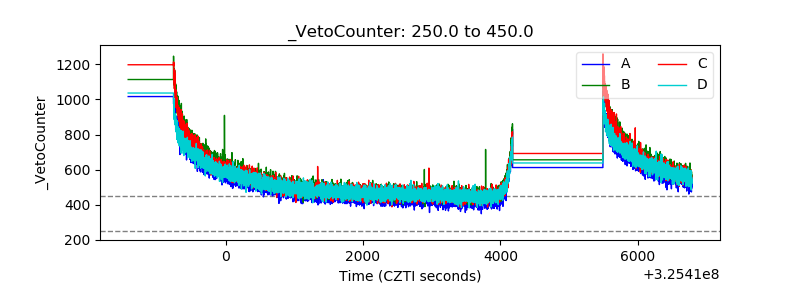 |