| Param | Original file | Final file |
|---|---|---|
| Filename | modeM0/AS1T03_194T01_9000003620_24724cztM0_level2.evt | modeM0/AS1T03_194T01_9000003620_24724cztM0_level2_quad_clean.evt |
| Size (bytes) | 534,196,800 | 103,080,960 |
| Size | 509.4 MB | 98.3 MB |
| Events in quadrant A | 3,604,556 | 690,036 |
| Events in quadrant B | 3,803,471 | 690,794 |
| Events in quadrant C | 4,624,992 | 638,890 |
| Events in quadrant D | 3,699,135 | 643,332 |
| Mode M9 | |||
|---|---|---|---|
| Quadrant | BADHDUFLAG | Total packets | Discarded packets |
| A | 0 | 18 | 0 |
| B | 0 | 19 | 0 |
| C | 0 | 19 | 0 |
| D | 0 | 19 | 0 |
| Mode M0 | |||
|---|---|---|---|
| Quadrant | BADHDUFLAG | Total packets | Discarded packets |
| A | 0 | 14696 | 4 |
| B | 0 | 15307 | 2 |
| C | 0 | 18987 | 2 |
| D | 0 | 14891 | 2 |
| Mode SS | |||
|---|---|---|---|
| Quadrant | BADHDUFLAG | Total packets | Discarded packets |
| A | 0 | 132 | 0 |
| B | 0 | 132 | 0 |
| C | 0 | 132 | 0 |
| D | 0 | 132 | 0 |
| Quadrant | Total seconds | Saturated seconds | Saturation percentage |
|---|---|---|---|
| A | 6586 | 144 | 2.186456% |
| B | 6586 | 150 | 2.277558% |
| C | 6586 | 250 | 3.795931% |
| D | 6586 | 111 | 1.685393% |
Noise dominated data is calculated using 1-second bins in cleaned event files. If a bin has >2000 counts, and if more than 50% of those come from <1% of pixels, then it is considered to be noise-dominated and hence unusable.
| Quadrant | # 1 sec bins | Bins with >0 counts | Bins with >2000 counts | High rate bins dominated by noise | Noise dominated (total time) | Noise dominated (detector-on time) | Marked lightcurve |
|---|---|---|---|---|---|---|---|
| A | 7811 | 6586 | 0 | 0 | 0.00% | 0.00% | 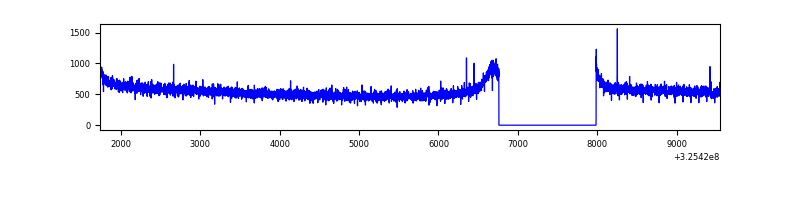 |
| B | 7811 | 6586 | 2 | 2 | 0.03% | 0.03% | 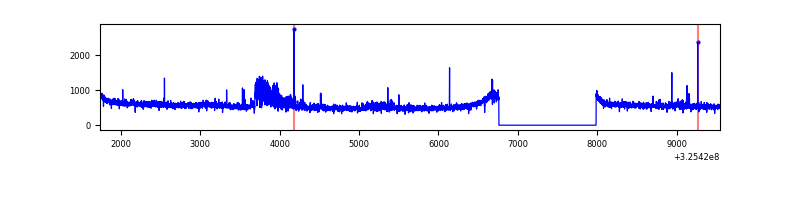 |
| C | 7811 | 6586 | 0 | 0 | 0.00% | 0.00% | 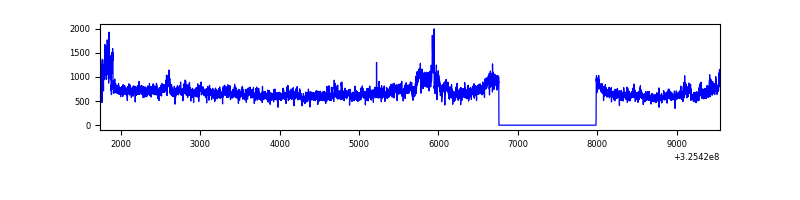 |
| D | 7811 | 6586 | 8 | 8 | 0.10% | 0.12% | 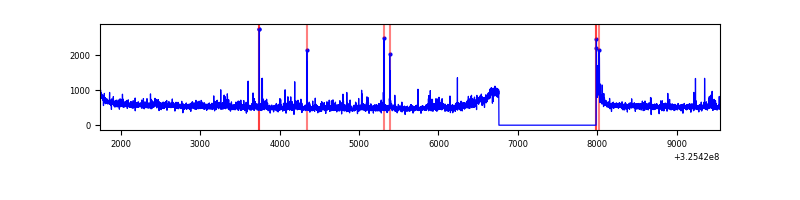 |
Top three noisy pixels from each quadrant. If the there are fewer than three noisy pixels in the level2.evt file, extra rows are filled as -1
| Pixel properties | Quadrant properties | ||||||
|---|---|---|---|---|---|---|---|
| Quadrant | DetID | PixID | Counts | Sigma | Mean | Median | Sigma |
| A | 13 | 254 | 10158 | 49.99 | 933 | 918 | 184.9 |
| A | 8 | 4 | 8961 | 43.51 | 933 | 918 | 184.9 |
| A | 0 | 226 | 8020 | 38.42 | 933 | 918 | 184.9 |
| B | 0 | 230 | 192326 | 1112.59 | 908 | 886 | 172.1 |
| B | 0 | 189 | 38171 | 216.69 | 908 | 886 | 172.1 |
| B | 12 | 111 | 20501 | 114.0 | 908 | 886 | 172.1 |
| C | 7 | 247 | 1079565 | 5371.24 | 869 | 877 | 200.8 |
| C | 14 | 238 | 139329 | 689.41 | 869 | 877 | 200.8 |
| C | 3 | 233 | 18225 | 86.38 | 869 | 877 | 200.8 |
| D | 8 | 195 | 140336 | 643.18 | 899 | 873 | 216.8 |
| D | 1 | 52 | 90799 | 414.72 | 899 | 873 | 216.8 |
| D | 7 | 238 | 80249 | 366.07 | 899 | 873 | 216.8 |
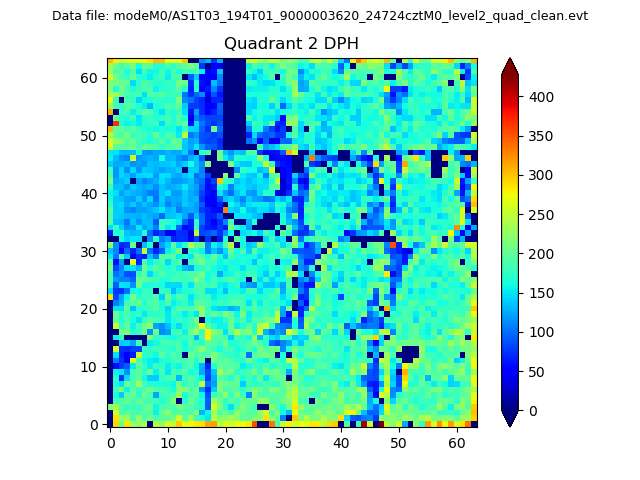
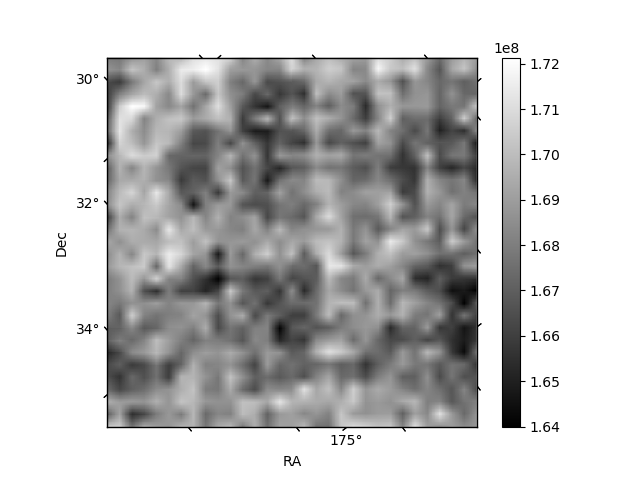
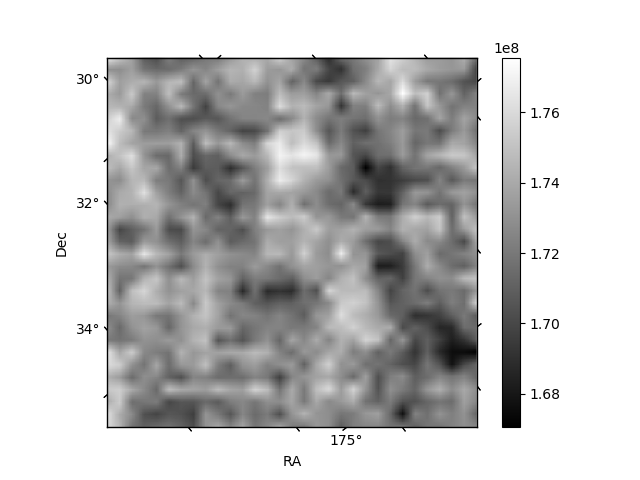
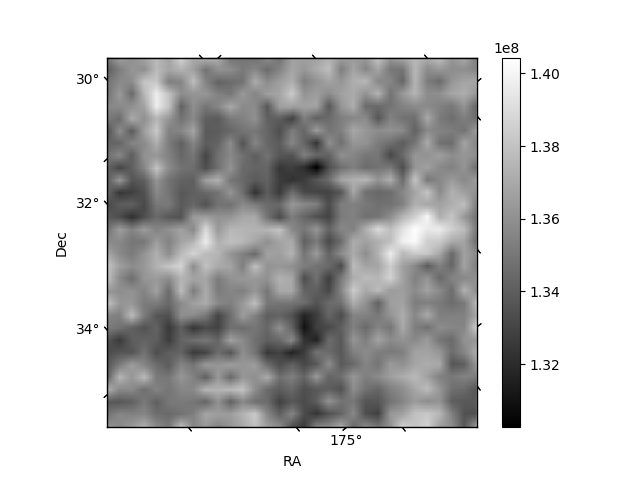
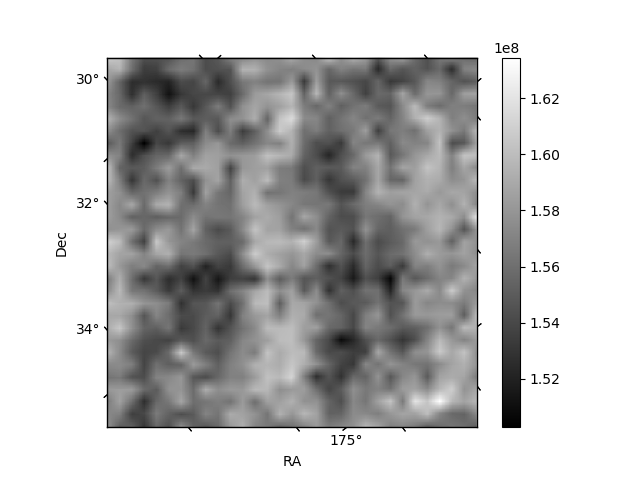
Histogram calculated using DETX and DETY for each event in the final _common_clean file
| Quadrant A | 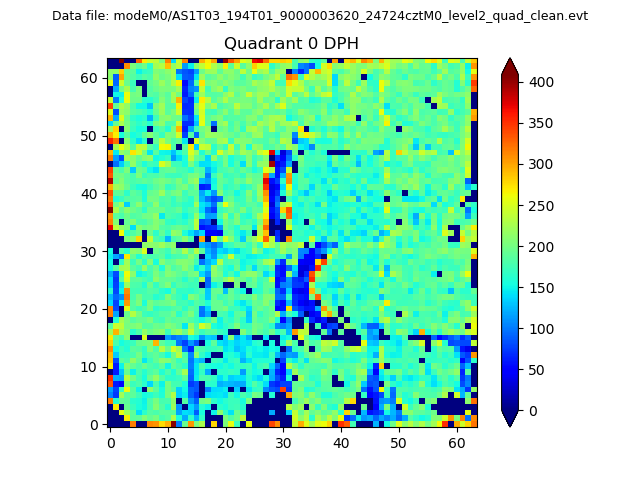 |
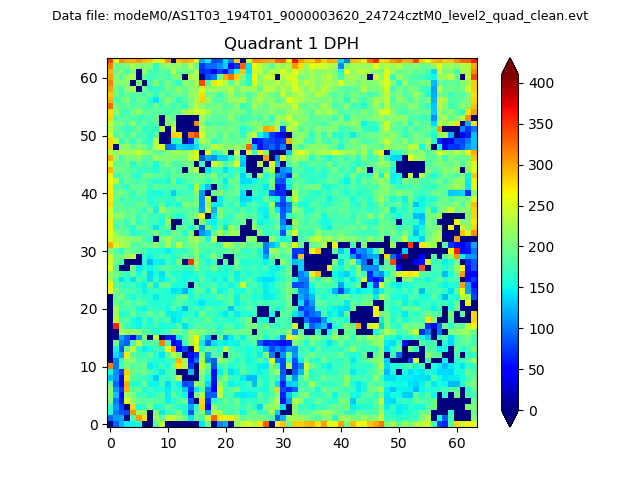 |
Quadrant B |
|---|---|---|---|
| Quadrant D | 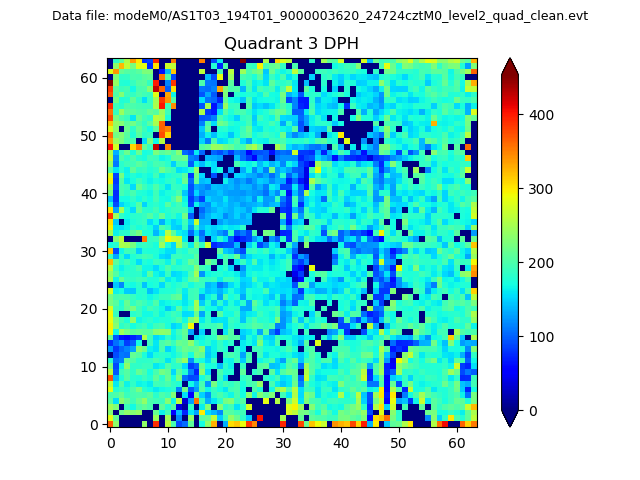 |
 |
Quadrant C |
| Plot type | Count rate plots | Images |
|---|---|---|
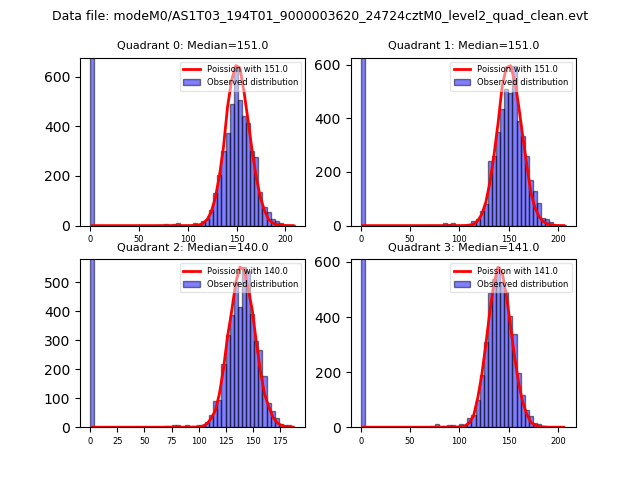
| Comparison with Poisson distribution Blue bars denote a histogram of data divided into 1 sec bins. Red curve is a Poisson curve with rate = median count rate of data. |
 |
 |
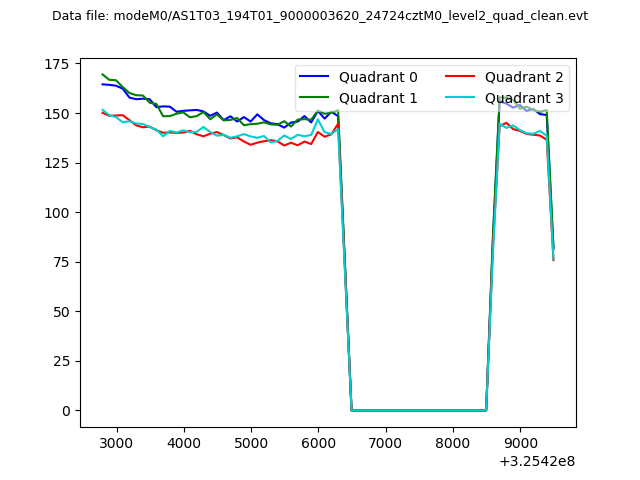
| Quadrant-wise count rates Data is divided into 100 sec bins |
 |
|
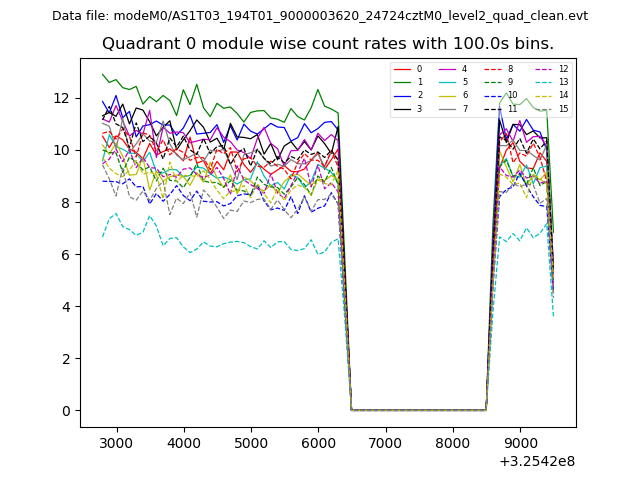
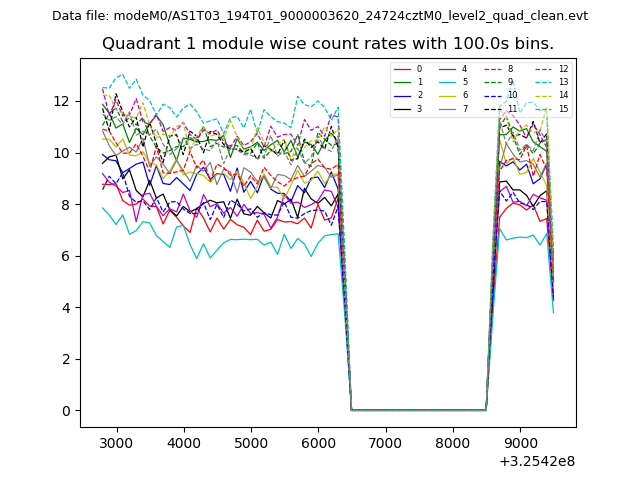
| Module-wise count rates for Quadrant A Data is divided into 100 sec bins |
 |
 |
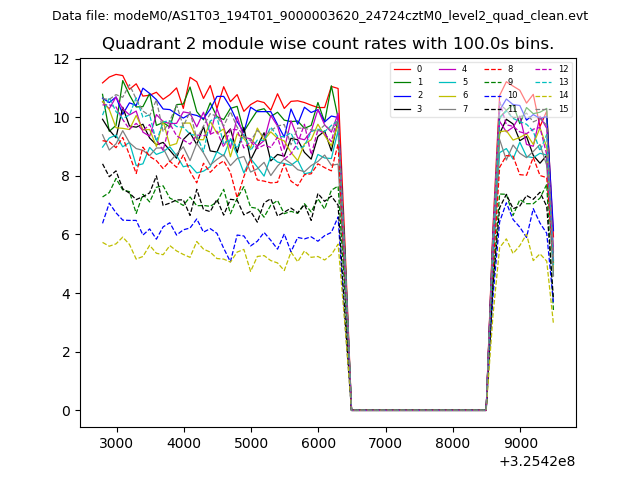
| Module-wise count rates for Quadrant B Data is divided into 100 sec bins |
 |
 |
| Module-wise count rates for Quadrant C Data is divided into 100 sec bins |
 |
 |
| Module-wise count rates for Quadrant D Data is divided into 100 sec bins |
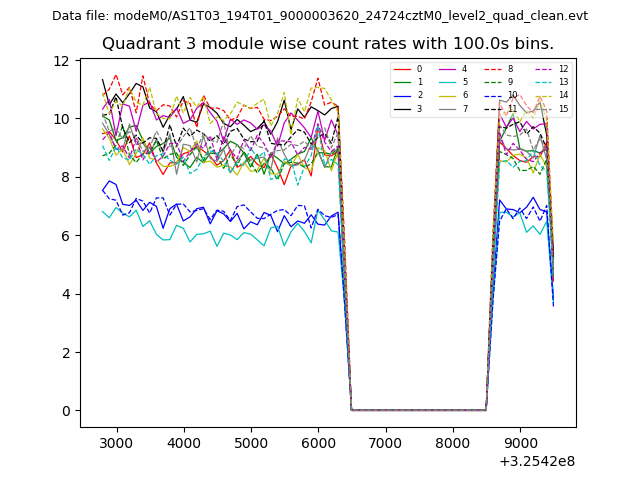 |
 |
| Parameter | Plot |
|---|---|
| CZT HV Monitor | 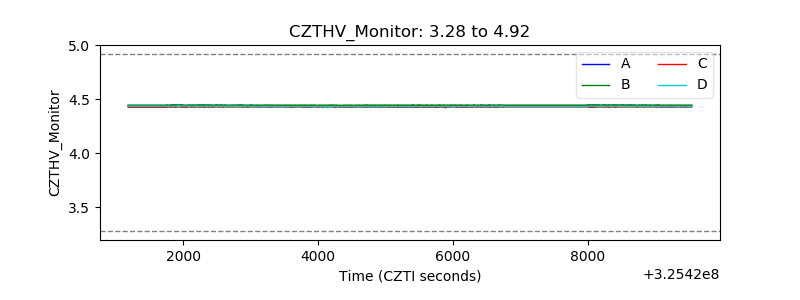 |
| D_VDD | 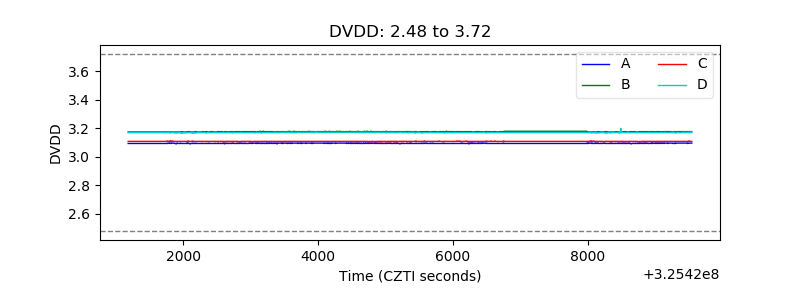 |
| Temperature 1 | 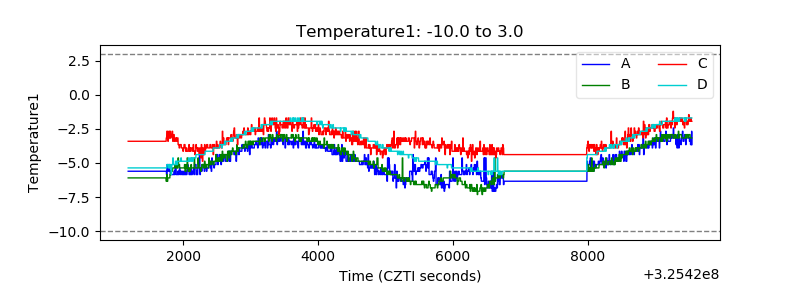 |
| Veto HV Monitor |  |
| Veto LLD | 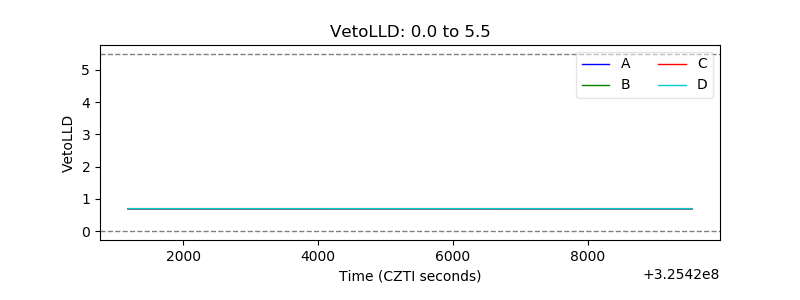 |
| Alpha Counter | 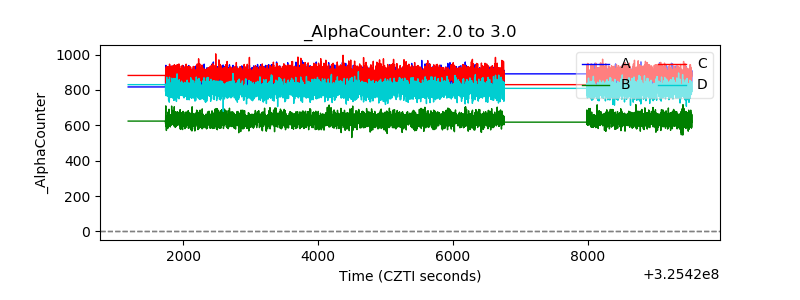 |
| _CPM_Rate | 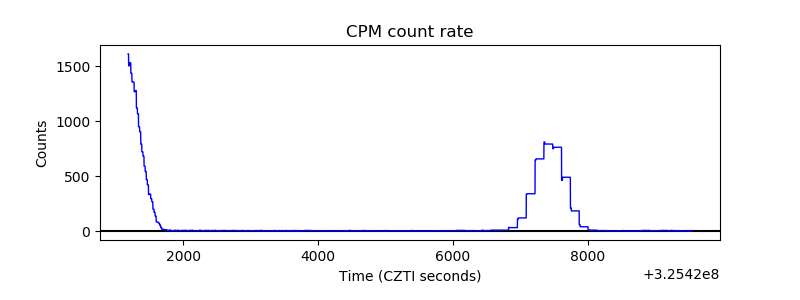 |
| CZT Counter | 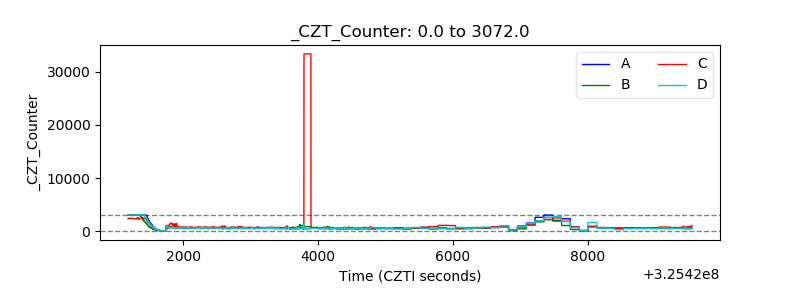 |
| +2.5 Volts monitor | 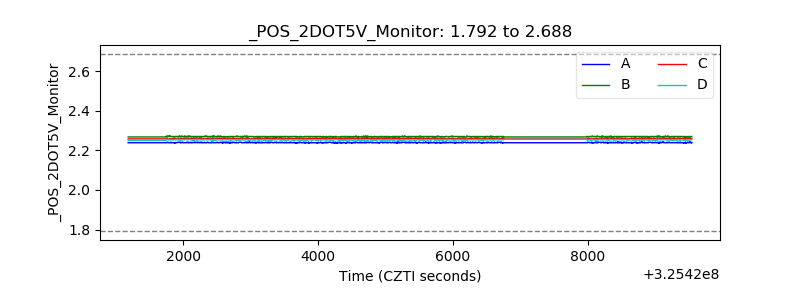 |
| +5 Volts monitor | 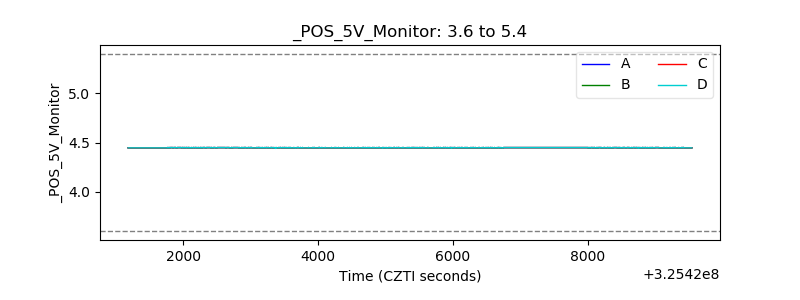 |
| _ROLL_ROT | 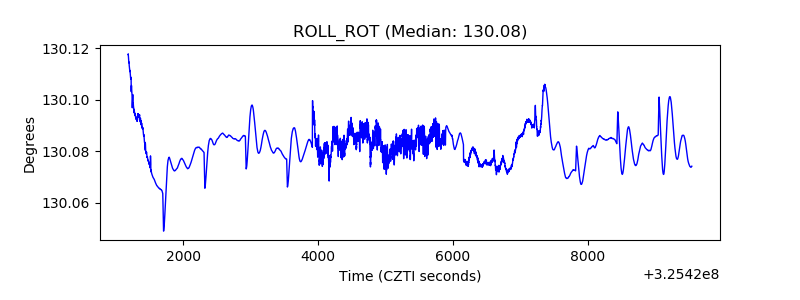 |
| _Roll_DEC | 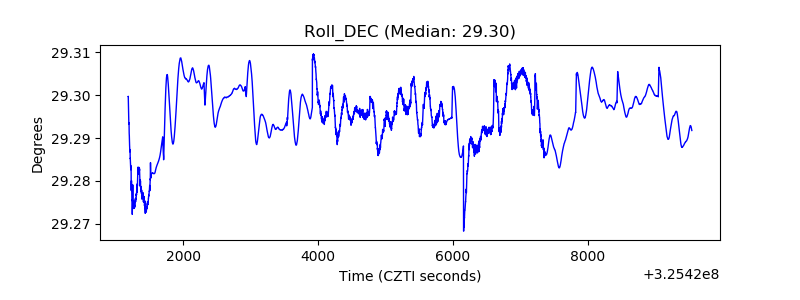 |
| _Roll_RA | 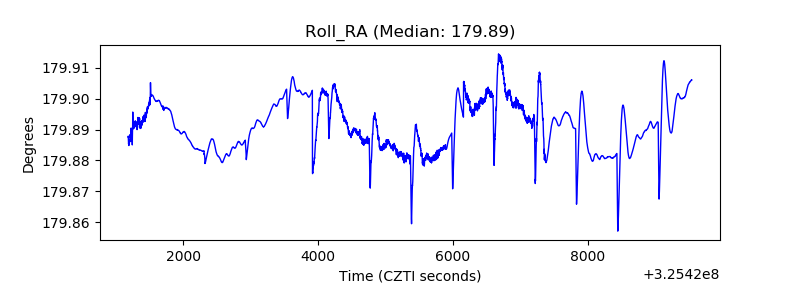 |
| Veto Counter | 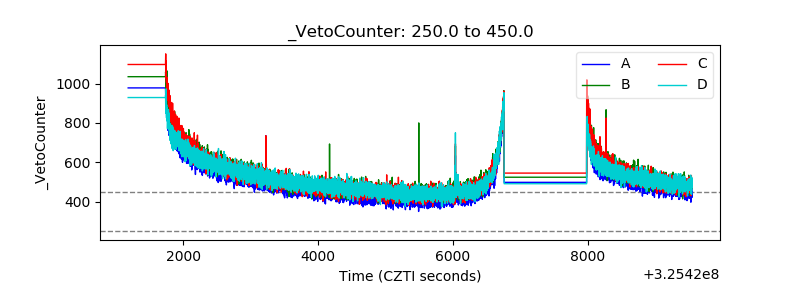 |