| Param | Original file | Final file |
|---|---|---|
| Filename | modeM0/AS1T03_194T01_9000003620_24726cztM0_level2.evt | modeM0/AS1T03_194T01_9000003620_24726cztM0_level2_quad_clean.evt |
| Size (bytes) | 481,216,320 | 98,608,320 |
| Size | 458.9 MB | 94.0 MB |
| Events in quadrant A | 3,198,964 | 652,253 |
| Events in quadrant B | 3,417,319 | 649,924 |
| Events in quadrant C | 4,122,973 | 613,099 |
| Events in quadrant D | 3,391,276 | 615,999 |
| Mode M9 | |||
|---|---|---|---|
| Quadrant | BADHDUFLAG | Total packets | Discarded packets |
| A | 0 | 6 | 0 |
| B | 0 | 6 | 0 |
| C | 0 | 6 | 0 |
| D | 0 | 6 | 0 |
| Mode M0 | |||
|---|---|---|---|
| Quadrant | BADHDUFLAG | Total packets | Discarded packets |
| A | 0 | 13578 | 1 |
| B | 0 | 14125 | 1 |
| C | 0 | 17171 | 1 |
| D | 0 | 14291 | 1 |
| Mode SS | |||
|---|---|---|---|
| Quadrant | BADHDUFLAG | Total packets | Discarded packets |
| A | 0 | 132 | 0 |
| B | 0 | 132 | 0 |
| C | 0 | 132 | 0 |
| D | 0 | 132 | 0 |
| Quadrant | Total seconds | Saturated seconds | Saturation percentage |
|---|---|---|---|
| A | 6525 | 117 | 1.793103% |
| B | 6525 | 168 | 2.574713% |
| C | 6525 | 234 | 3.586207% |
| D | 6525 | 99 | 1.517241% |
Noise dominated data is calculated using 1-second bins in cleaned event files. If a bin has >2000 counts, and if more than 50% of those come from <1% of pixels, then it is considered to be noise-dominated and hence unusable.
| Quadrant | # 1 sec bins | Bins with >0 counts | Bins with >2000 counts | High rate bins dominated by noise | Noise dominated (total time) | Noise dominated (detector-on time) | Marked lightcurve |
|---|---|---|---|---|---|---|---|
| A | 7105 | 6525 | 0 | 0 | 0.00% | 0.00% | 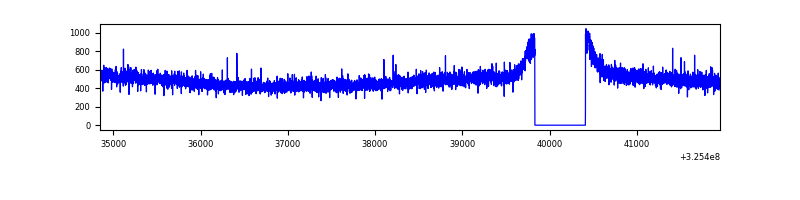 |
| B | 7105 | 6525 | 11 | 11 | 0.15% | 0.17% | 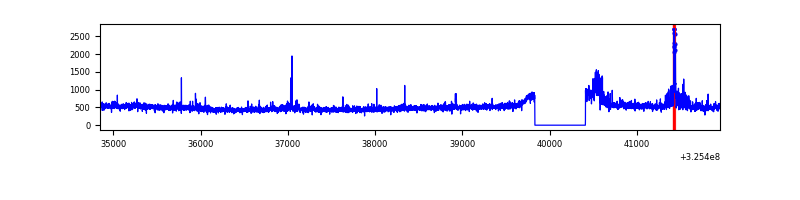 |
| C | 7105 | 6525 | 5 | 5 | 0.07% | 0.08% | 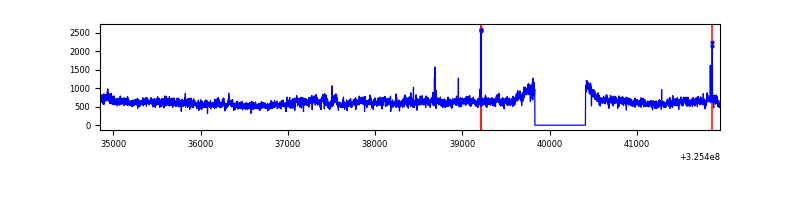 |
| D | 7105 | 6525 | 10 | 10 | 0.14% | 0.15% | 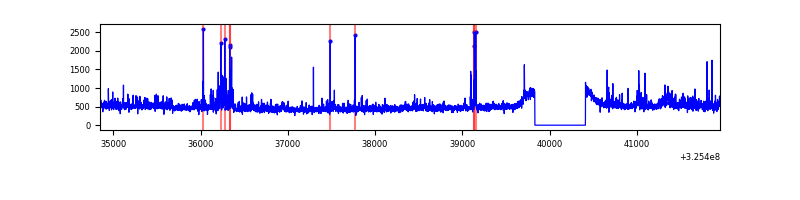 |
Top three noisy pixels from each quadrant. If the there are fewer than three noisy pixels in the level2.evt file, extra rows are filled as -1
| Pixel properties | Quadrant properties | ||||||
|---|---|---|---|---|---|---|---|
| Quadrant | DetID | PixID | Counts | Sigma | Mean | Median | Sigma |
| A | 13 | 254 | 10490 | 57.56 | 827 | 807 | 168.2 |
| A | 3 | 137 | 7605 | 40.41 | 827 | 807 | 168.2 |
| A | 0 | 226 | 7085 | 37.32 | 827 | 807 | 168.2 |
| B | 0 | 230 | 105441 | 663.51 | 812 | 791 | 157.7 |
| B | 0 | 189 | 67355 | 422.03 | 812 | 791 | 157.7 |
| B | 5 | 172 | 31468 | 194.5 | 812 | 791 | 157.7 |
| C | 7 | 247 | 813394 | 4438.38 | 785 | 790 | 183.1 |
| C | 14 | 238 | 125192 | 679.47 | 785 | 790 | 183.1 |
| C | 10 | 91 | 92238 | 499.48 | 785 | 790 | 183.1 |
| D | 8 | 195 | 147378 | 743.58 | 808 | 785 | 197.1 |
| D | 12 | 233 | 91428 | 459.78 | 808 | 785 | 197.1 |
| D | 10 | 199 | 35242 | 174.78 | 808 | 785 | 197.1 |
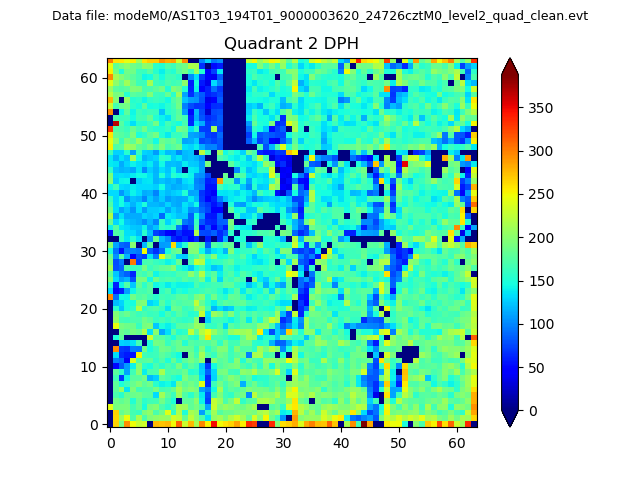
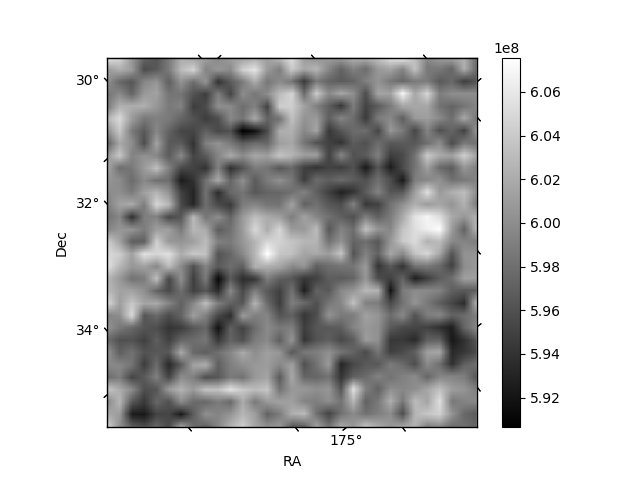
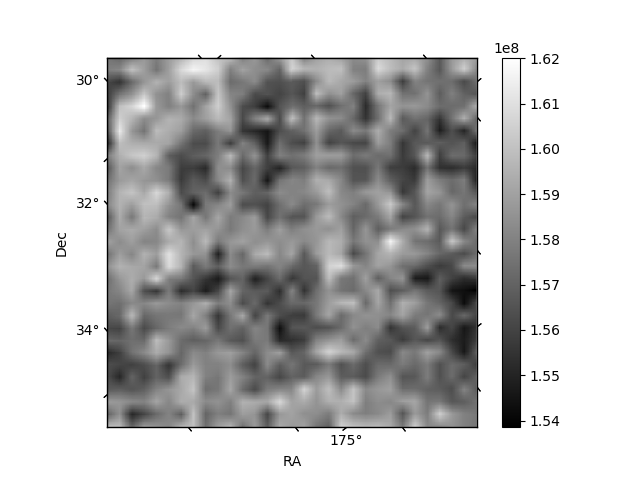
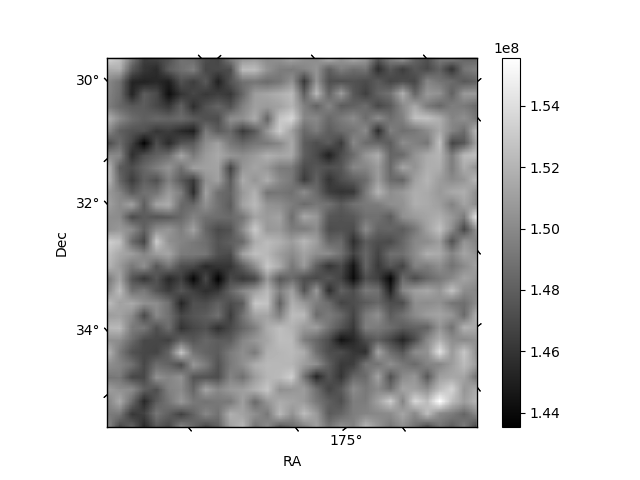
Histogram calculated using DETX and DETY for each event in the final _common_clean file
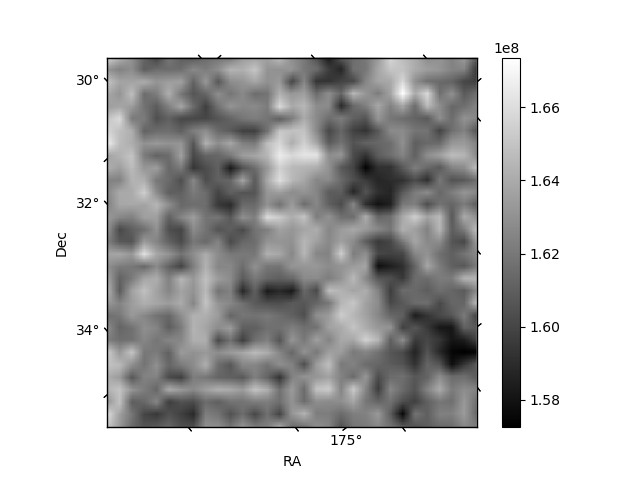
| Quadrant A | 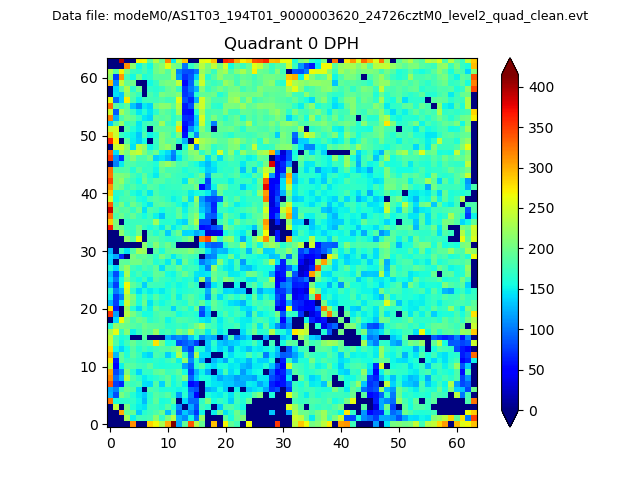 |
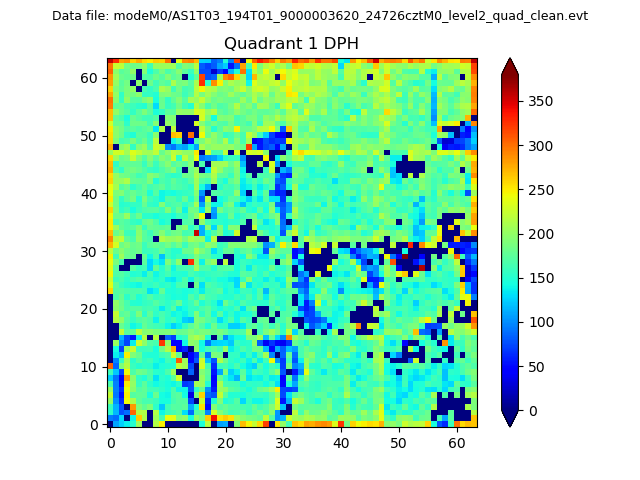 |
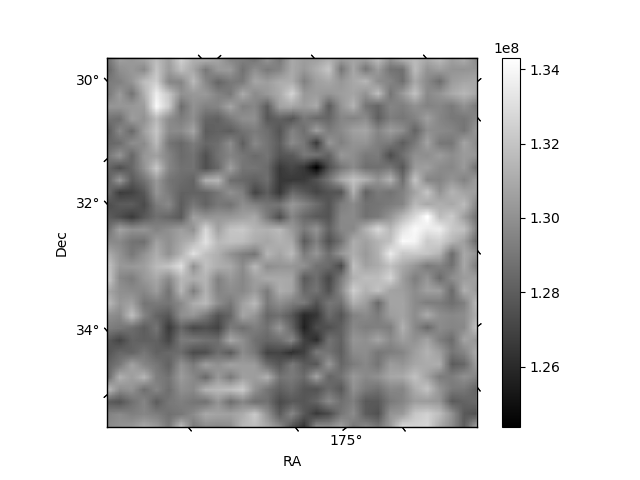
Quadrant B |
|---|---|---|---|
| Quadrant D | 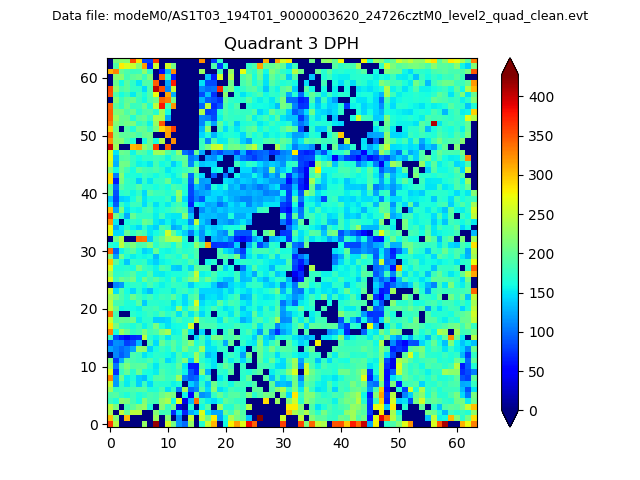 |
 |
Quadrant C |
| Plot type | Count rate plots | Images |
|---|---|---|
| Comparison with Poisson distribution Blue bars denote a histogram of data divided into 1 sec bins. Red curve is a Poisson curve with rate = median count rate of data. |
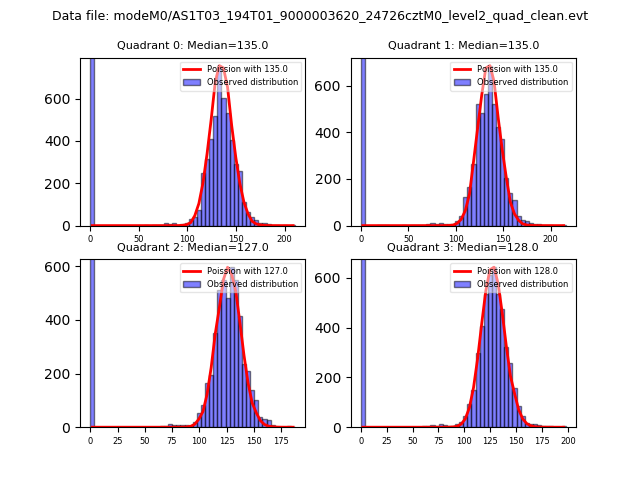 |
 |
| Quadrant-wise count rates Data is divided into 100 sec bins |
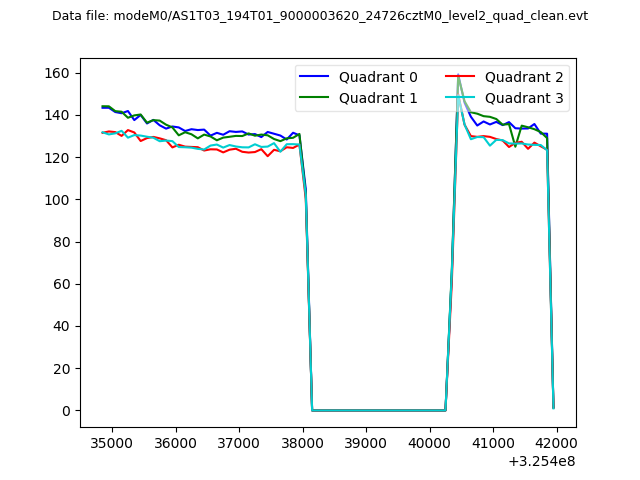 |
|
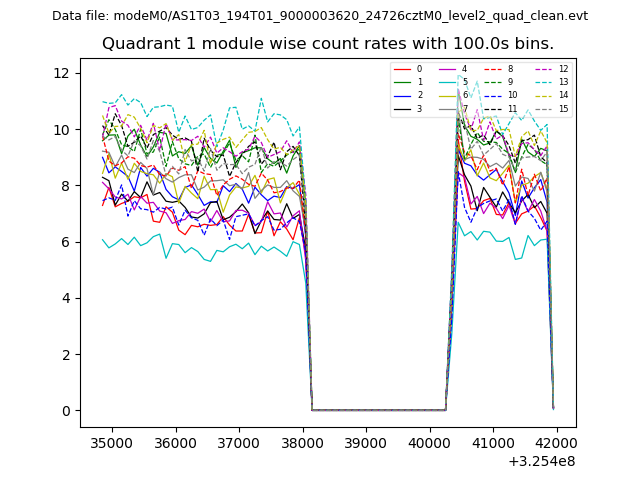
| Module-wise count rates for Quadrant A Data is divided into 100 sec bins |
 |
 |
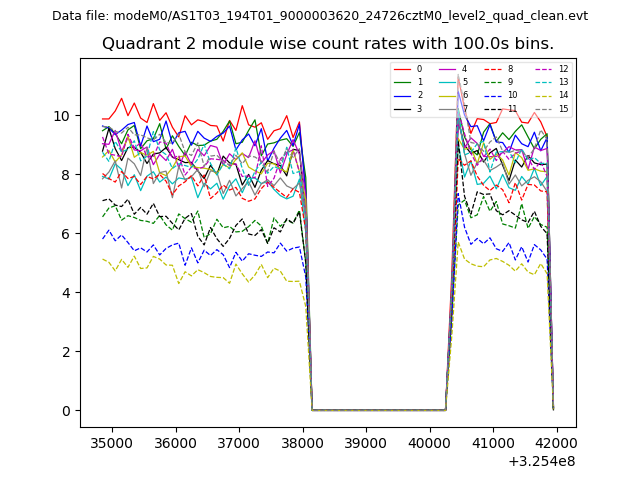
| Module-wise count rates for Quadrant B Data is divided into 100 sec bins |
 |
 |
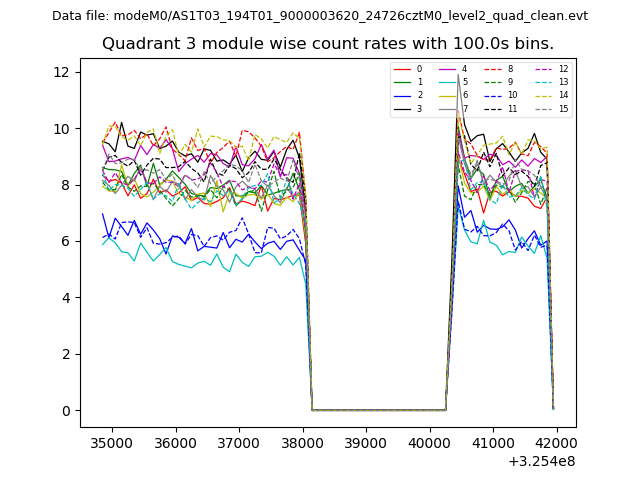
| Module-wise count rates for Quadrant C Data is divided into 100 sec bins |
 |
 |
| Module-wise count rates for Quadrant D Data is divided into 100 sec bins |
 |
 |
| Parameter | Plot |
|---|---|
| CZT HV Monitor | 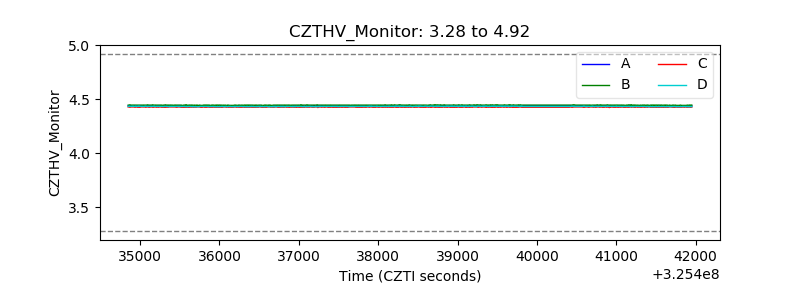 |
| D_VDD | 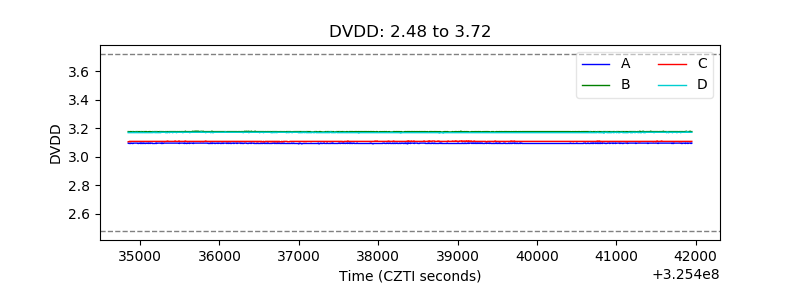 |
| Temperature 1 | 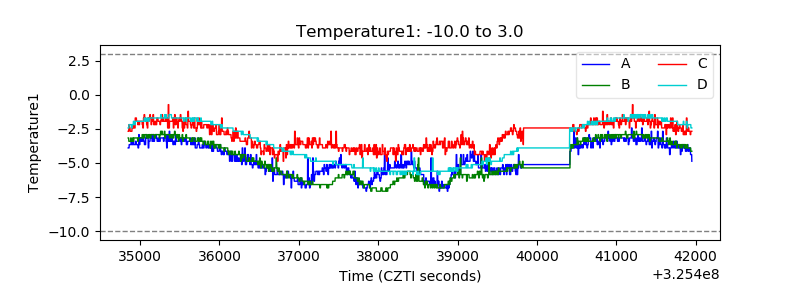 |
| Veto HV Monitor | 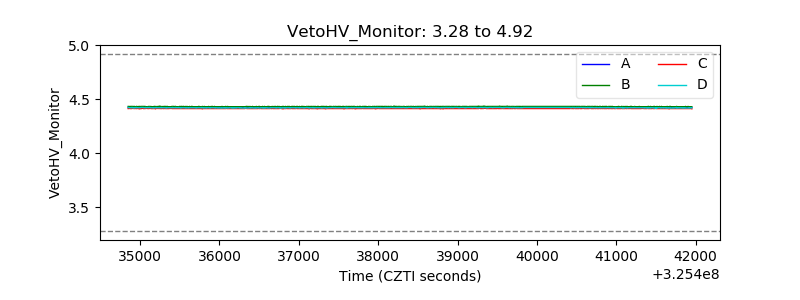 |
| Veto LLD | 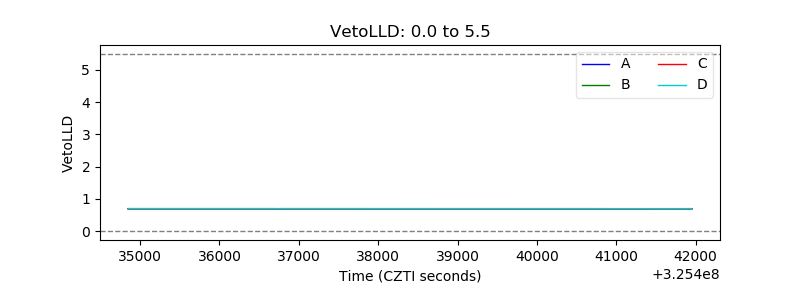 |
| Alpha Counter | 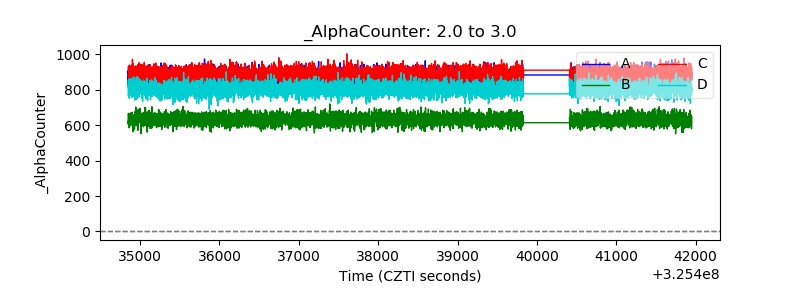 |
| _CPM_Rate | 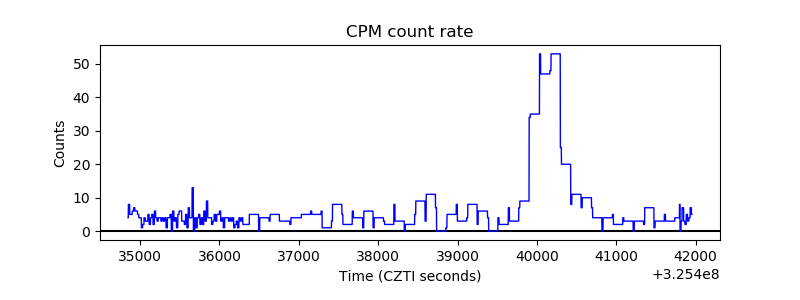 |
| CZT Counter | 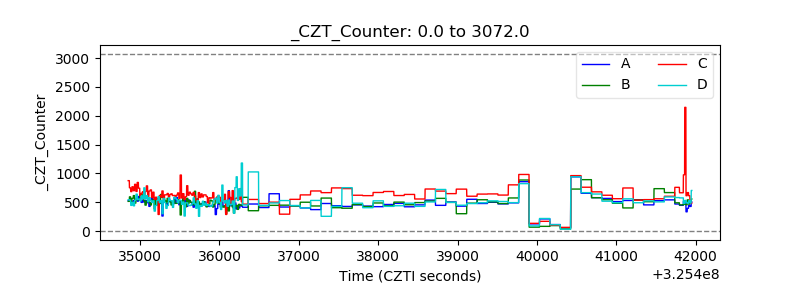 |
| +2.5 Volts monitor |  |
| +5 Volts monitor |  |
| _ROLL_ROT | 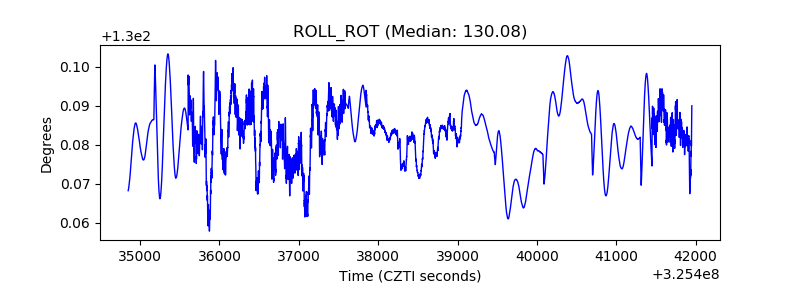 |
| _Roll_DEC |  |
| _Roll_RA | 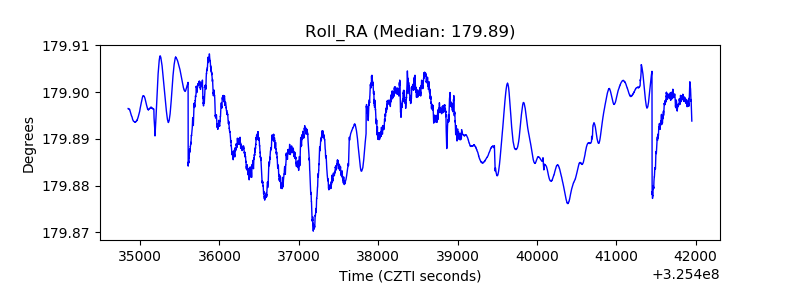 |
| Veto Counter |  |