| Param | Original file | Final file |
|---|---|---|
| Filename | modeM0/AS1T03_194T01_9000003620_24731cztM0_level2.evt | modeM0/AS1T03_194T01_9000003620_24731cztM0_level2_quad_clean.evt |
| Size (bytes) | 1,512,097,920 | 243,135,360 |
| Size | 1.4 GB | 231.9 MB |
| Events in quadrant A | 8,939,391 | 1,567,926 |
| Events in quadrant B | 9,185,188 | 1,574,396 |
| Events in quadrant C | 13,371,206 | 1,479,329 |
| Events in quadrant D | 13,027,280 | 1,443,756 |
| Mode M9 | |||
|---|---|---|---|
| Quadrant | BADHDUFLAG | Total packets | Discarded packets |
| A | 0 | 22 | 0 |
| B | 0 | 22 | 0 |
| C | 0 | 22 | 0 |
| D | 0 | 22 | 0 |
| Mode M0 | |||
|---|---|---|---|
| Quadrant | BADHDUFLAG | Total packets | Discarded packets |
| A | 0 | 39110 | 3 |
| B | 0 | 39594 | 3 |
| C | 0 | 53565 | 3 |
| D | 0 | 52012 | 3 |
| Mode SS | |||
|---|---|---|---|
| Quadrant | BADHDUFLAG | Total packets | Discarded packets |
| A | 0 | 382 | 0 |
| B | 0 | 382 | 0 |
| C | 0 | 382 | 0 |
| D | 0 | 382 | 0 |
| Quadrant | Total seconds | Saturated seconds | Saturation percentage |
|---|---|---|---|
| A | 18846 | 185 | 0.981641% |
| B | 18847 | 241 | 1.278718% |
| C | 18847 | 542 | 2.875789% |
| D | 18847 | 1285 | 6.818061% |
Noise dominated data is calculated using 1-second bins in cleaned event files. If a bin has >2000 counts, and if more than 50% of those come from <1% of pixels, then it is considered to be noise-dominated and hence unusable.
| Quadrant | # 1 sec bins | Bins with >0 counts | Bins with >2000 counts | High rate bins dominated by noise | Noise dominated (total time) | Noise dominated (detector-on time) | Marked lightcurve |
|---|---|---|---|---|---|---|---|
| A | 20956 | 18846 | 2 | 2 | 0.01% | 0.01% | 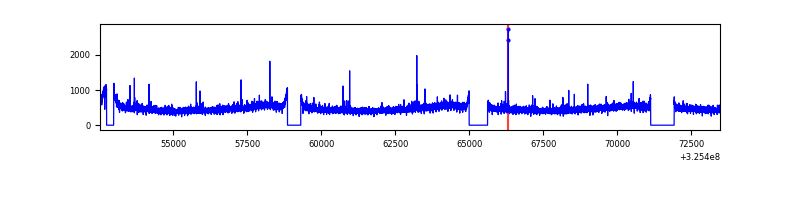 |
| B | 20957 | 18847 | 0 | 0 | 0.00% | 0.00% | 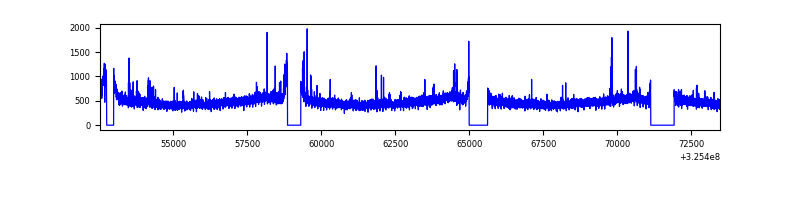 |
| C | 20957 | 18847 | 6 | 6 | 0.03% | 0.03% | 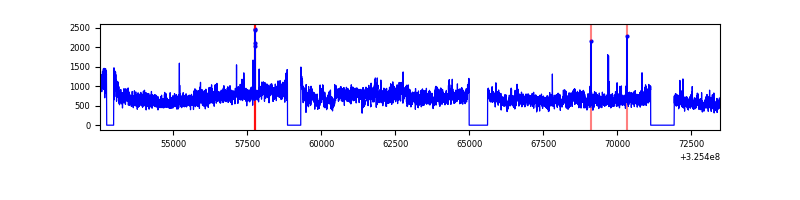 |
| D | 20957 | 18848 | 851 | 851 | 4.06% | 4.52% | 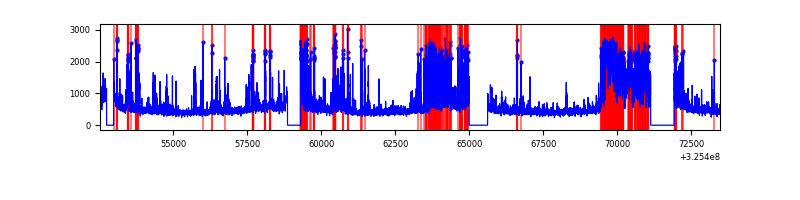 |
Top three noisy pixels from each quadrant. If the there are fewer than three noisy pixels in the level2.evt file, extra rows are filled as -1
| Pixel properties | Quadrant properties | ||||||
|---|---|---|---|---|---|---|---|
| Quadrant | DetID | PixID | Counts | Sigma | Mean | Median | Sigma |
| A | 10 | 255 | 41633 | 85.17 | 2300 | 2252 | 462.4 |
| A | 12 | 96 | 35571 | 72.06 | 2300 | 2252 | 462.4 |
| A | 13 | 254 | 28914 | 57.66 | 2300 | 2252 | 462.4 |
| B | 3 | 64 | 94428 | 209.98 | 2273 | 2212 | 439.2 |
| B | 0 | 189 | 64329 | 141.44 | 2273 | 2212 | 439.2 |
| B | 12 | 111 | 55742 | 121.89 | 2273 | 2212 | 439.2 |
| C | 7 | 247 | 4338752 | 8446.82 | 2185 | 2200 | 513.4 |
| C | 14 | 238 | 343634 | 665.05 | 2185 | 2200 | 513.4 |
| C | 10 | 91 | 66994 | 126.21 | 2185 | 2200 | 513.4 |
| D | 1 | 52 | 2463855 | 4600.74 | 2197 | 2131 | 535.1 |
| D | 12 | 233 | 1574907 | 2939.38 | 2197 | 2131 | 535.1 |
| D | 7 | 238 | 345247 | 641.25 | 2197 | 2131 | 535.1 |
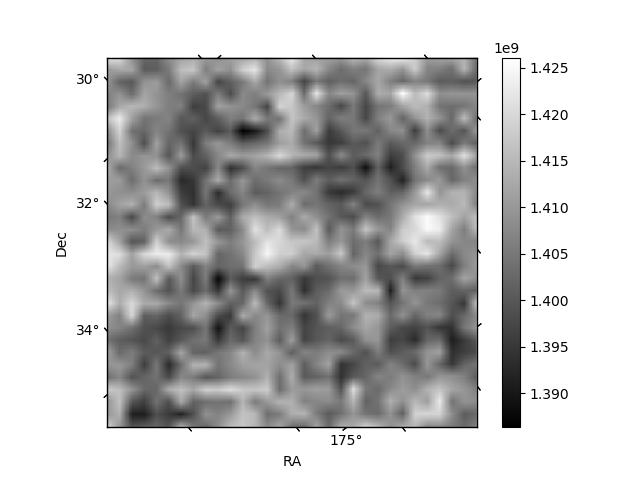
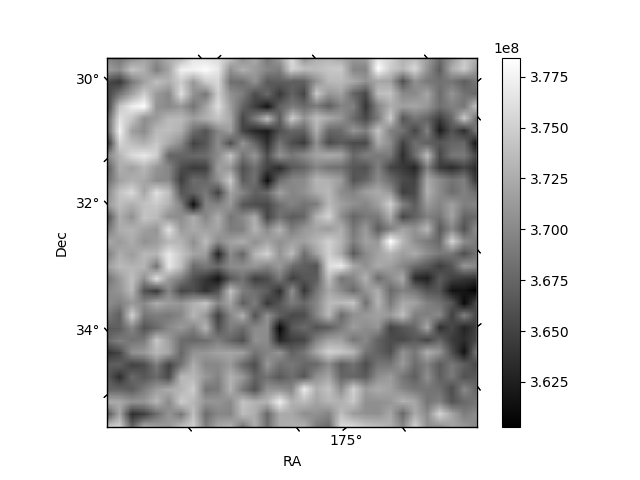
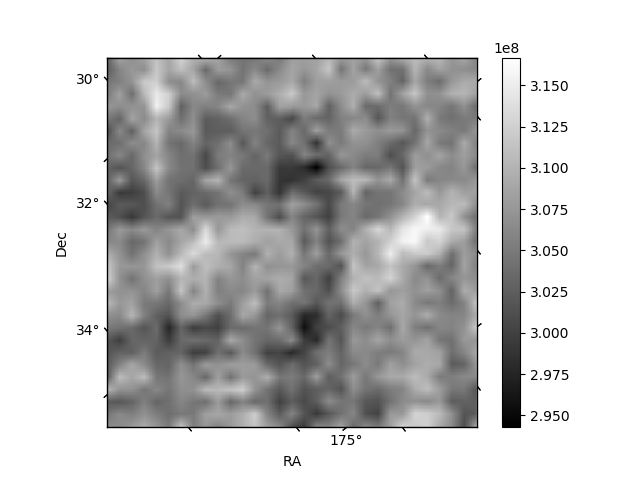
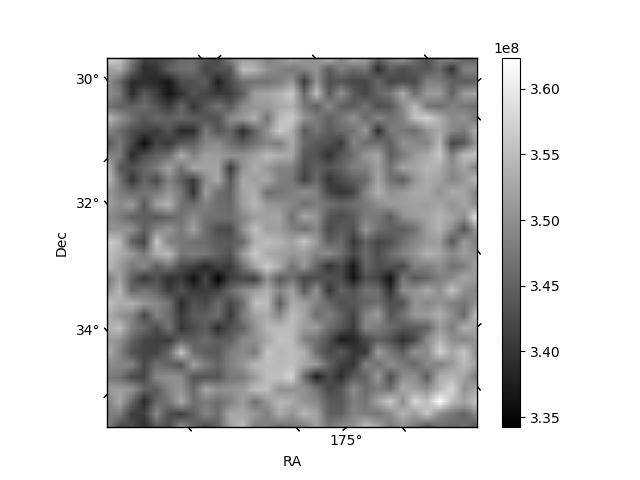
Histogram calculated using DETX and DETY for each event in the final _common_clean file
| Quadrant A | 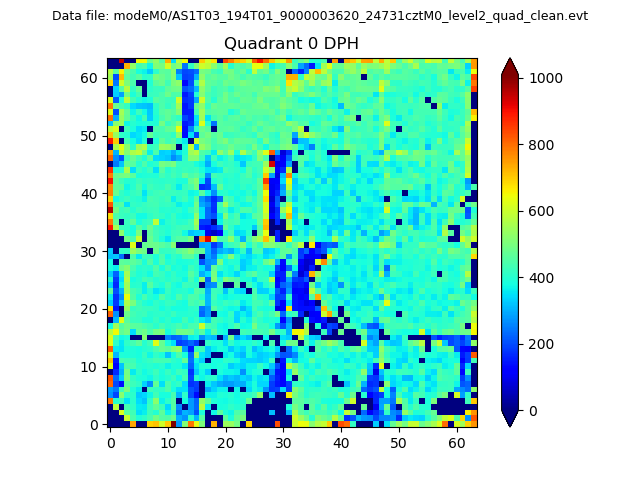 |
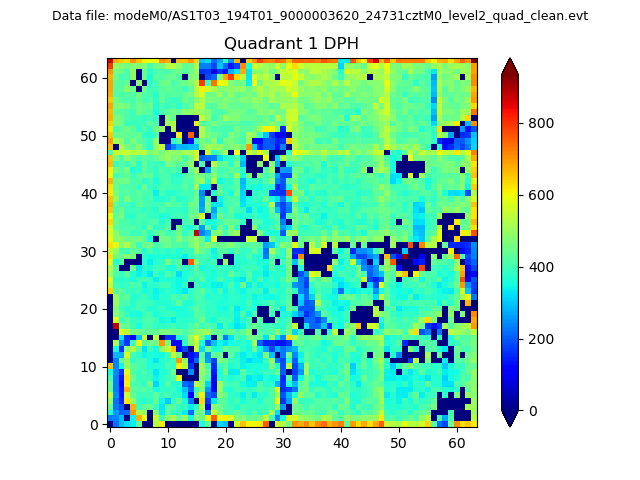 |
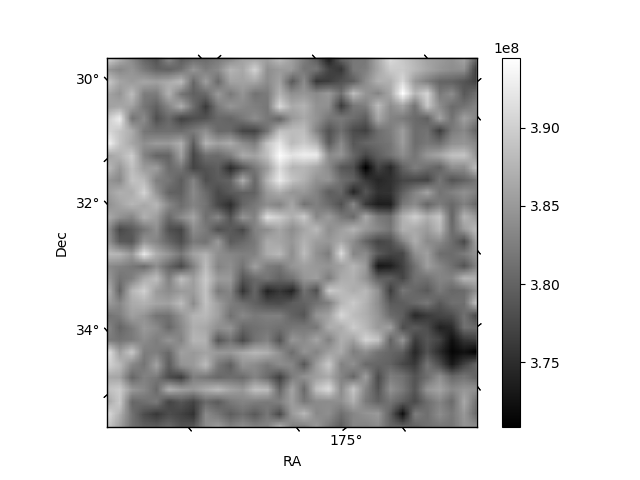
Quadrant B |
|---|---|---|---|
| Quadrant D | 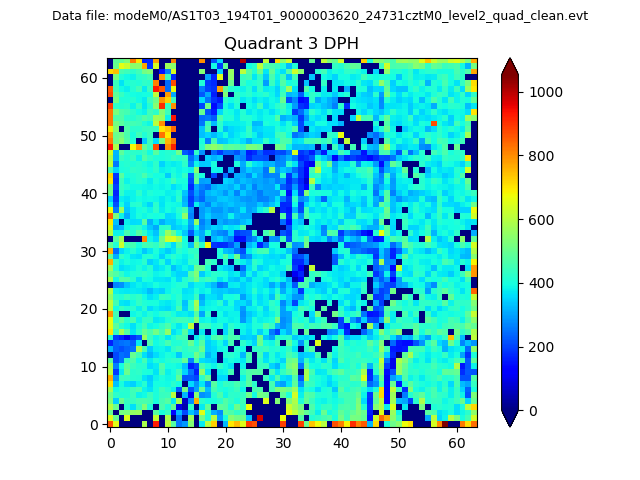 |
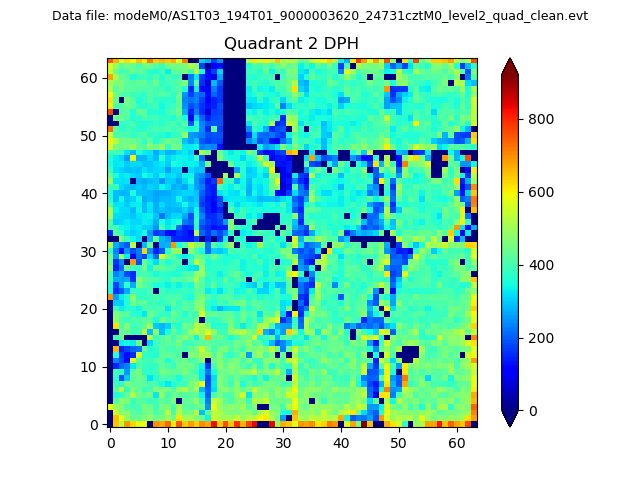 |
Quadrant C |
| Plot type | Count rate plots | Images |
|---|---|---|
| Comparison with Poisson distribution Blue bars denote a histogram of data divided into 1 sec bins. Red curve is a Poisson curve with rate = median count rate of data. |
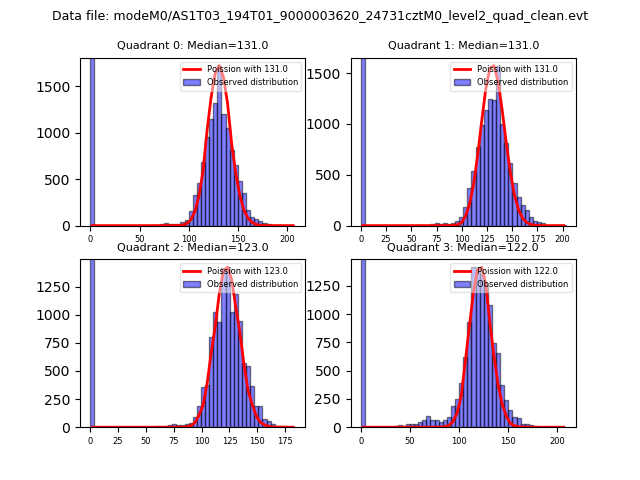 |
 |
| Quadrant-wise count rates Data is divided into 100 sec bins |
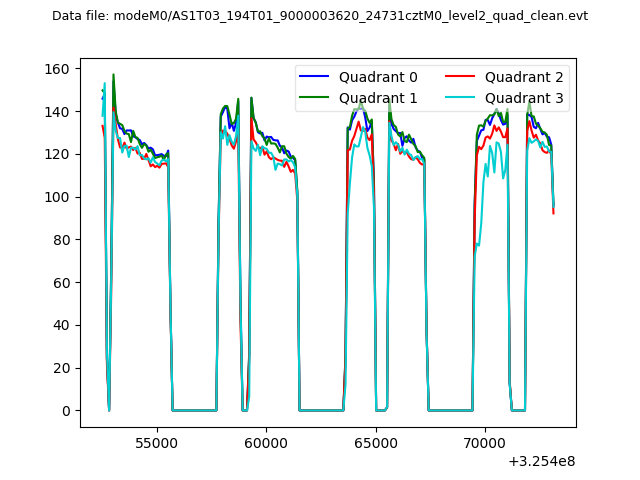 |
|
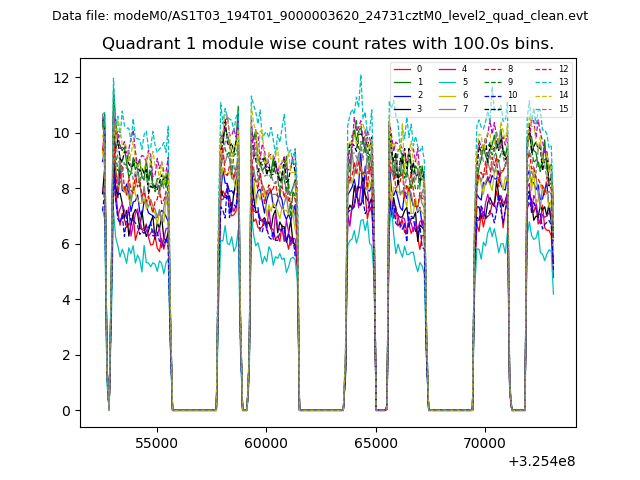
| Module-wise count rates for Quadrant A Data is divided into 100 sec bins |
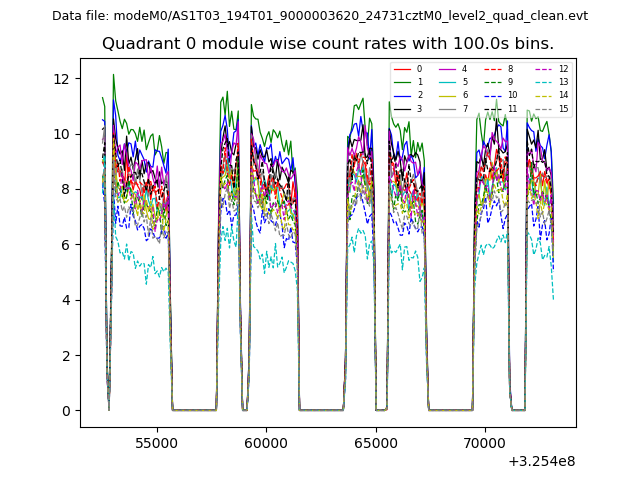 |
 |
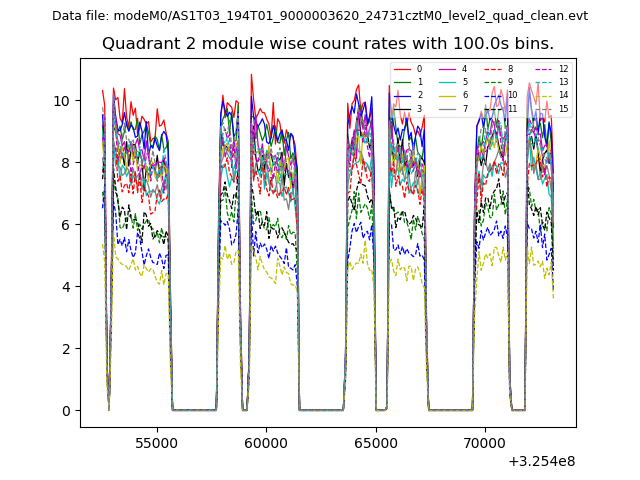
| Module-wise count rates for Quadrant B Data is divided into 100 sec bins |
 |
 |
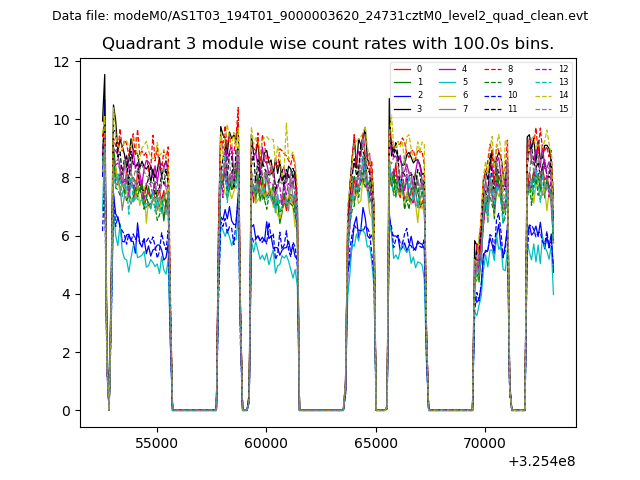
| Module-wise count rates for Quadrant C Data is divided into 100 sec bins |
 |
 |
| Module-wise count rates for Quadrant D Data is divided into 100 sec bins |
 |
 |
| Parameter | Plot |
|---|---|
| CZT HV Monitor | 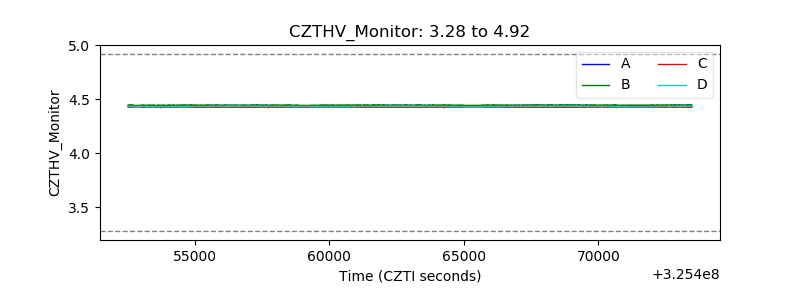 |
| D_VDD | 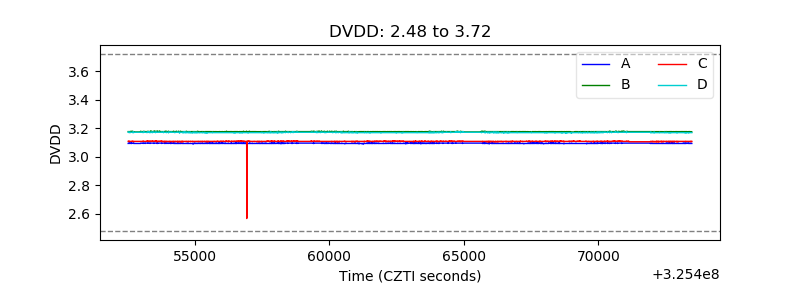 |
| Temperature 1 | 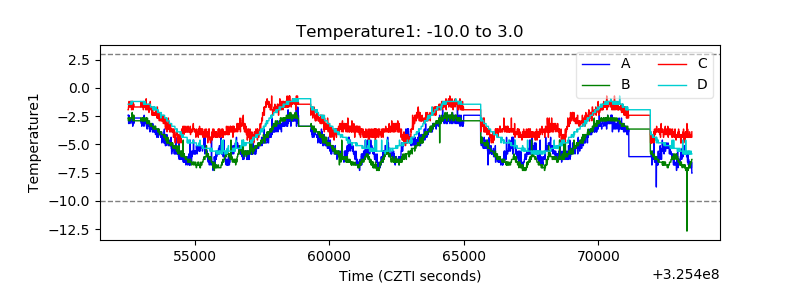 |
| Veto HV Monitor |  |
| Veto LLD | 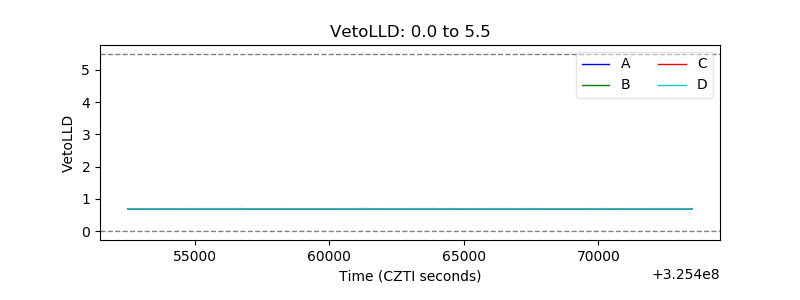 |
| Alpha Counter | 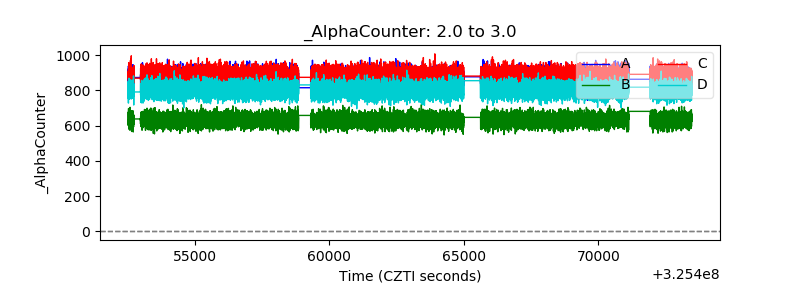 |
| _CPM_Rate | 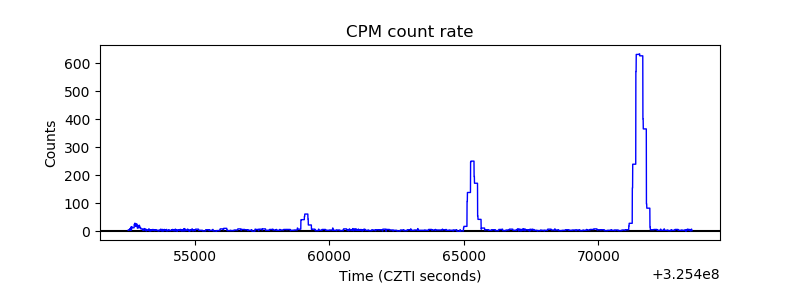 |
| CZT Counter | 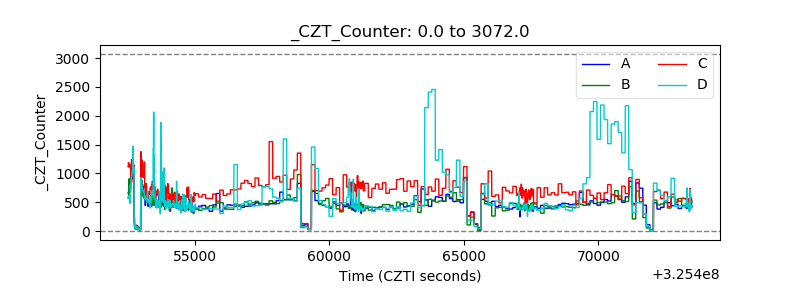 |
| +2.5 Volts monitor |  |
| +5 Volts monitor | 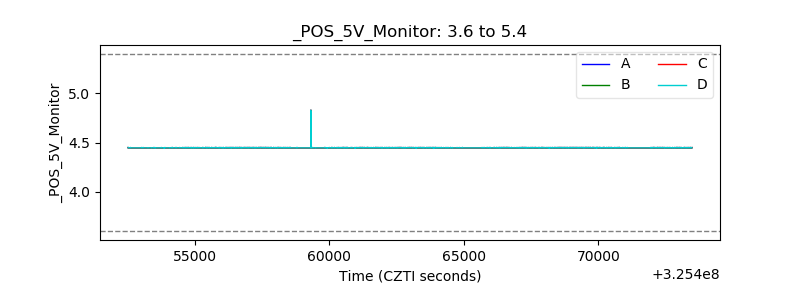 |
| _ROLL_ROT | 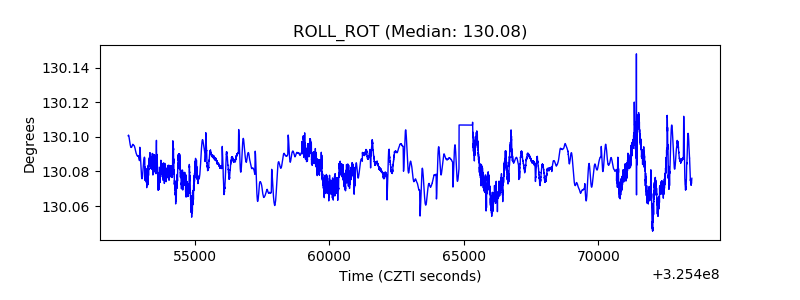 |
| _Roll_DEC | 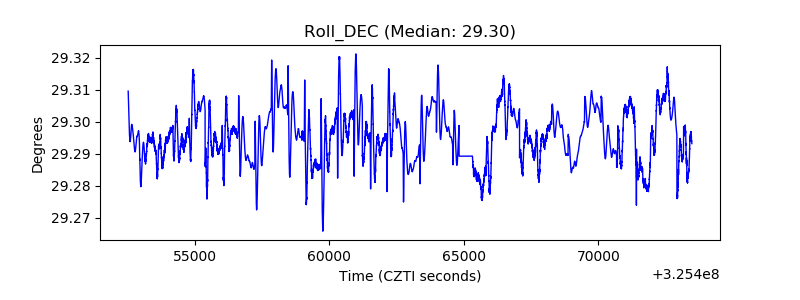 |
| _Roll_RA | 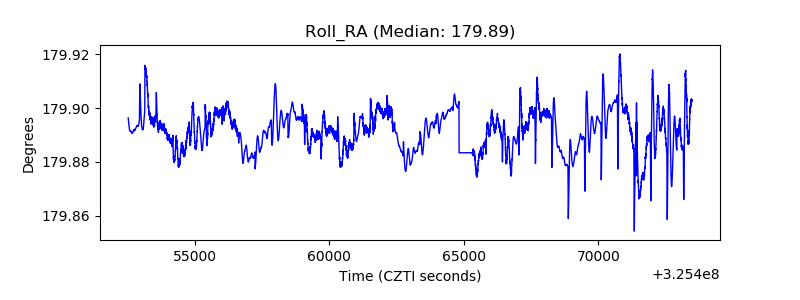 |
| Veto Counter | 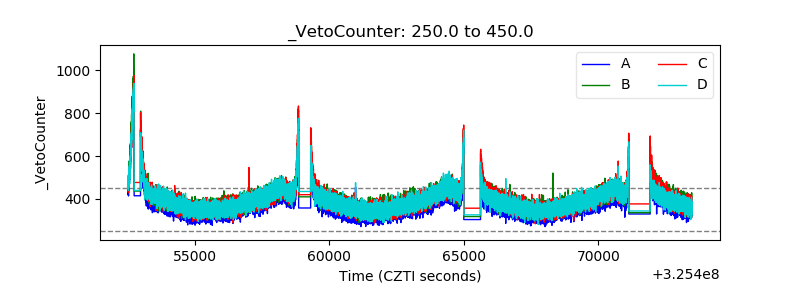 |