| Param | Original file | Final file |
|---|---|---|
| Filename | modeM0/AS1T03_194T01_9000003620_24735cztM0_level2.evt | modeM0/AS1T03_194T01_9000003620_24735cztM0_level2_quad_clean.evt |
| Size (bytes) | 573,240,960 | 67,714,560 |
| Size | 546.7 MB | 64.6 MB |
| Events in quadrant A | 3,342,252 | 415,184 |
| Events in quadrant B | 3,476,653 | 419,552 |
| Events in quadrant C | 6,468,470 | 378,888 |
| Events in quadrant D | 3,639,353 | 388,733 |
| Mode M9 | |||
|---|---|---|---|
| Quadrant | BADHDUFLAG | Total packets | Discarded packets |
| A | 0 | 20 | 0 |
| B | 0 | 21 | 0 |
| C | 0 | 21 | 0 |
| D | 0 | 21 | 0 |
| Mode M0 | |||
|---|---|---|---|
| Quadrant | BADHDUFLAG | Total packets | Discarded packets |
| A | 0 | 13707 | 2 |
| B | 0 | 14164 | 2 |
| C | 0 | 23976 | 2 |
| D | 0 | 14823 | 2 |
| Mode SS | |||
|---|---|---|---|
| Quadrant | BADHDUFLAG | Total packets | Discarded packets |
| A | 0 | 130 | 0 |
| B | 0 | 130 | 0 |
| C | 0 | 130 | 0 |
| D | 0 | 130 | 0 |
| Quadrant | Total seconds | Saturated seconds | Saturation percentage |
|---|---|---|---|
| A | 6419 | 38 | 0.591993% |
| B | 6419 | 70 | 1.090513% |
| C | 6419 | 263 | 4.097211% |
| D | 6418 | 31 | 0.483017% |
Noise dominated data is calculated using 1-second bins in cleaned event files. If a bin has >2000 counts, and if more than 50% of those come from <1% of pixels, then it is considered to be noise-dominated and hence unusable.
| Quadrant | # 1 sec bins | Bins with >0 counts | Bins with >2000 counts | High rate bins dominated by noise | Noise dominated (total time) | Noise dominated (detector-on time) | Marked lightcurve |
|---|---|---|---|---|---|---|---|
| A | 7609 | 6419 | 0 | 0 | 0.00% | 0.00% | 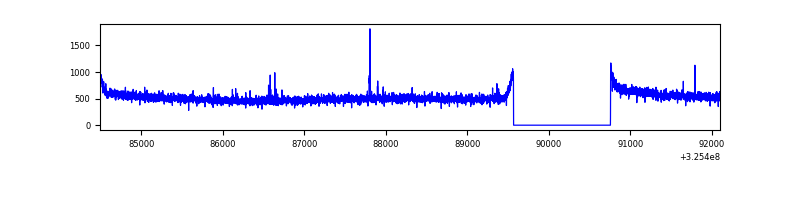 |
| B | 7609 | 6419 | 11 | 11 | 0.14% | 0.17% | 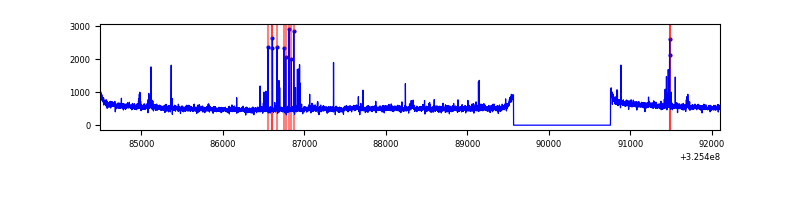 |
| C | 7609 | 6419 | 20 | 20 | 0.26% | 0.31% | 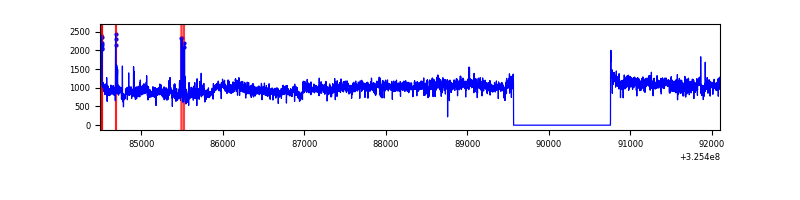 |
| D | 7608 | 6418 | 5 | 5 | 0.07% | 0.08% | 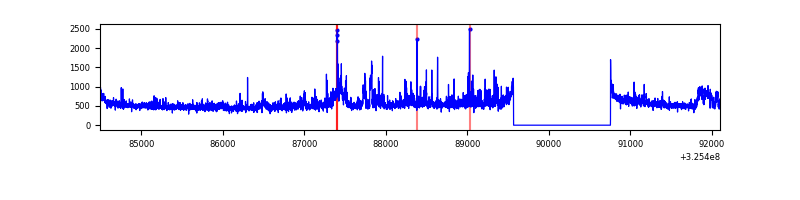 |
Top three noisy pixels from each quadrant. If the there are fewer than three noisy pixels in the level2.evt file, extra rows are filled as -1
| Pixel properties | Quadrant properties | ||||||
|---|---|---|---|---|---|---|---|
| Quadrant | DetID | PixID | Counts | Sigma | Mean | Median | Sigma |
| A | 12 | 96 | 10363 | 55.08 | 864 | 850 | 172.7 |
| A | 13 | 254 | 8112 | 42.05 | 864 | 850 | 172.7 |
| A | 3 | 137 | 7515 | 38.59 | 864 | 850 | 172.7 |
| B | 4 | 80 | 46804 | 285.59 | 855 | 834 | 161.0 |
| B | 6 | 36 | 26327 | 158.38 | 855 | 834 | 161.0 |
| B | 3 | 64 | 19917 | 118.56 | 855 | 834 | 161.0 |
| C | 7 | 247 | 3114394 | 16841.73 | 801 | 807 | 184.9 |
| C | 14 | 238 | 131149 | 705.03 | 801 | 807 | 184.9 |
| C | 3 | 233 | 63714 | 340.27 | 801 | 807 | 184.9 |
| D | 1 | 52 | 265363 | 1319.78 | 825 | 802 | 200.5 |
| D | 8 | 195 | 213059 | 1058.86 | 825 | 802 | 200.5 |
| D | 12 | 233 | 29227 | 141.8 | 825 | 802 | 200.5 |
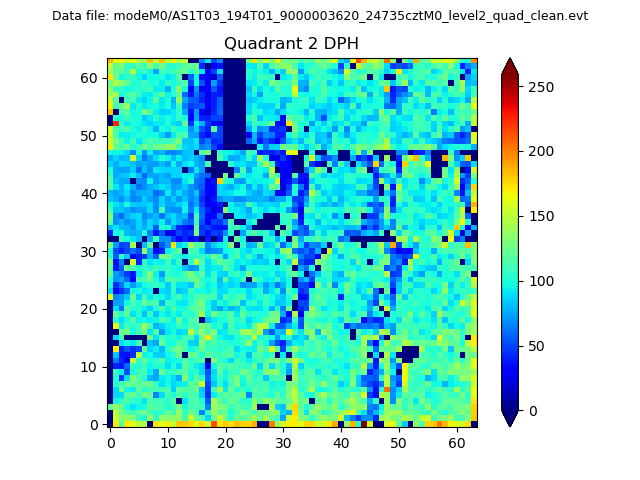
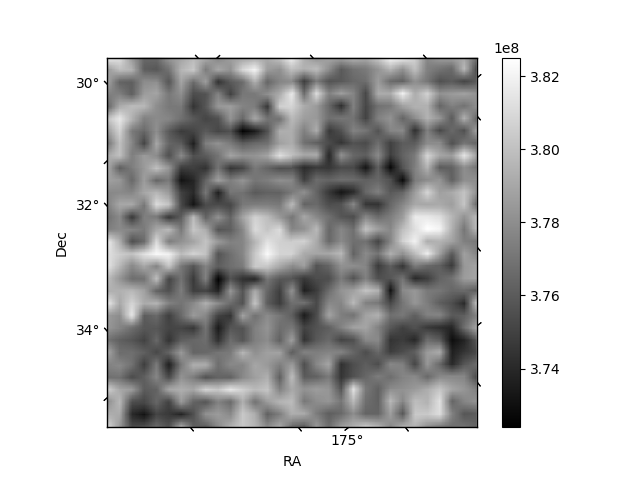
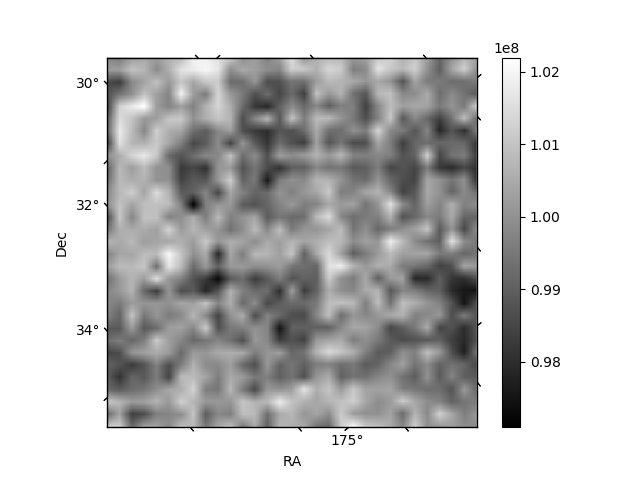
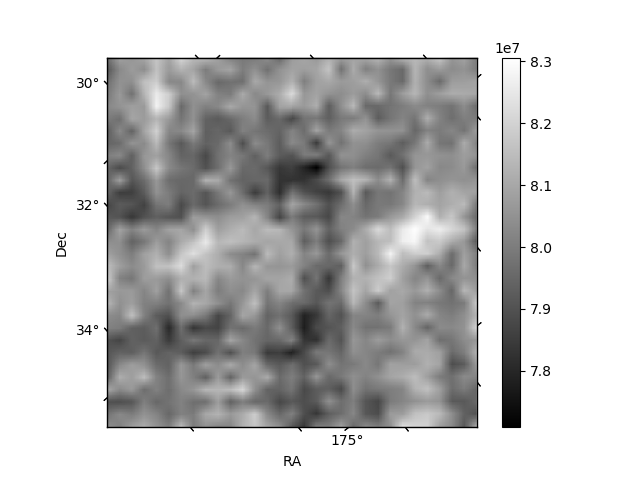
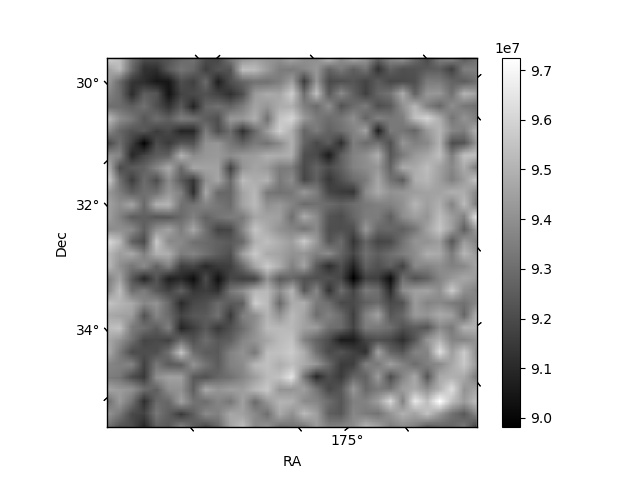
Histogram calculated using DETX and DETY for each event in the final _common_clean file
| Quadrant A | 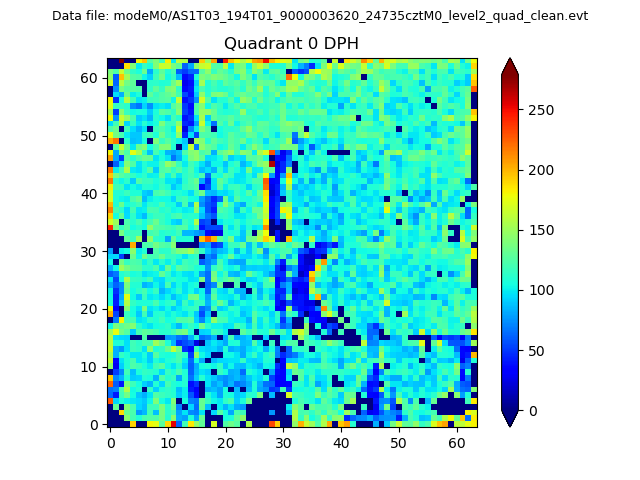 |
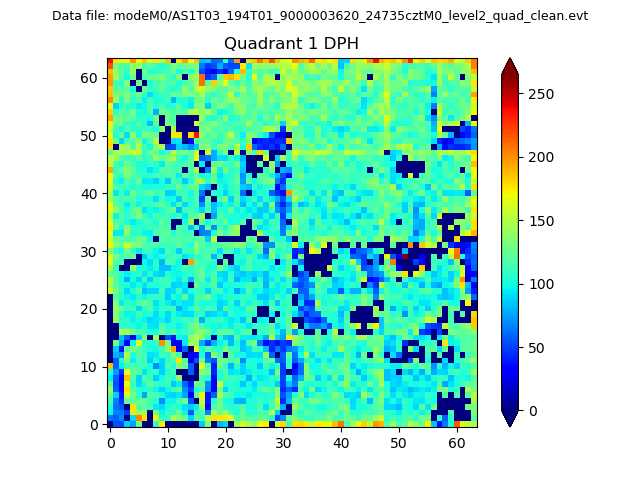 |
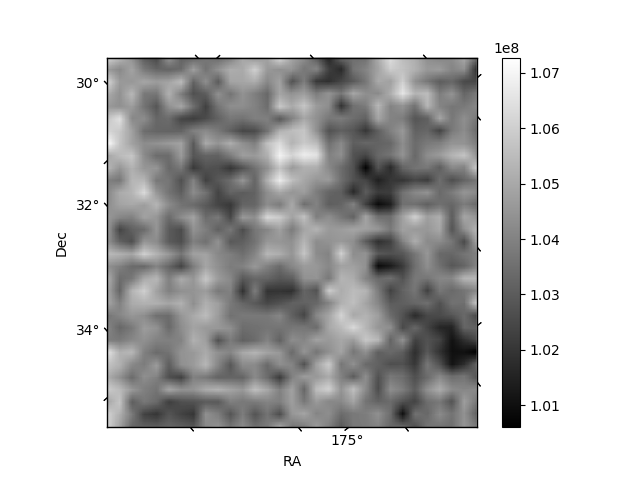
Quadrant B |
|---|---|---|---|
| Quadrant D | 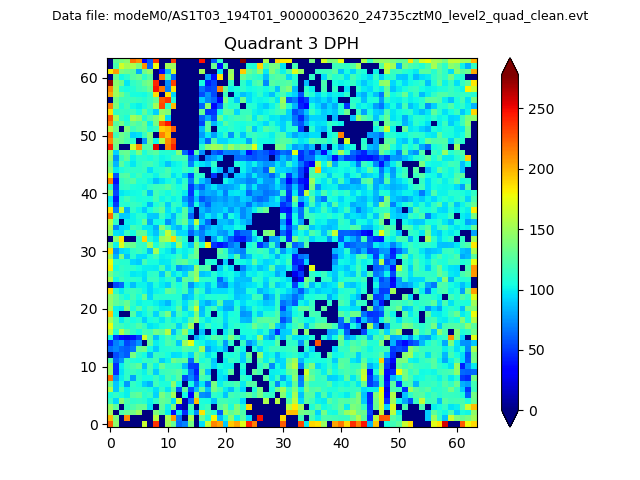 |
 |
Quadrant C |
| Plot type | Count rate plots | Images |
|---|---|---|
| Comparison with Poisson distribution Blue bars denote a histogram of data divided into 1 sec bins. Red curve is a Poisson curve with rate = median count rate of data. |
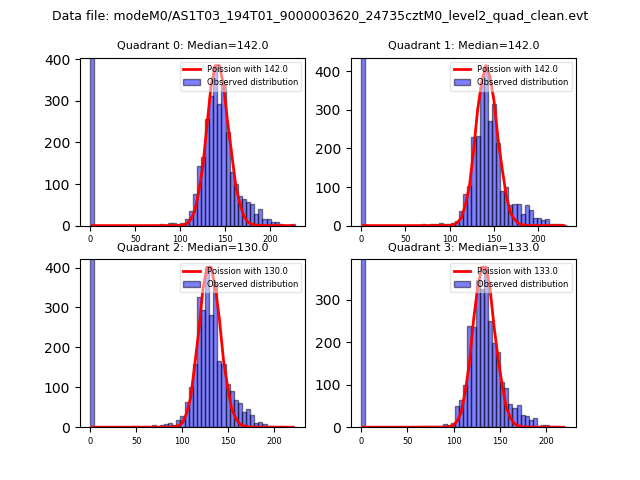 |
 |
| Quadrant-wise count rates Data is divided into 100 sec bins |
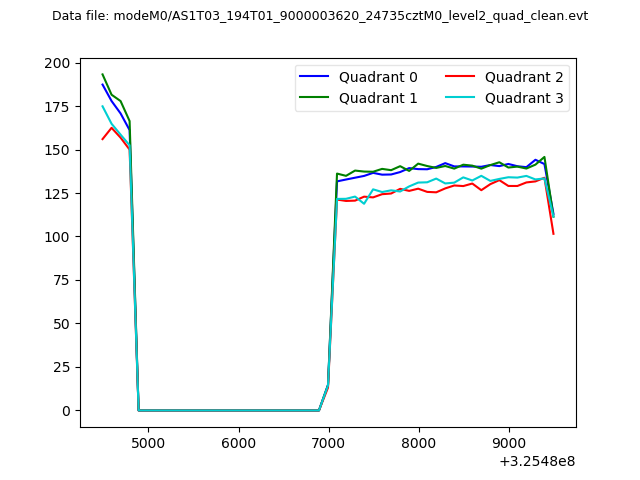 |
|
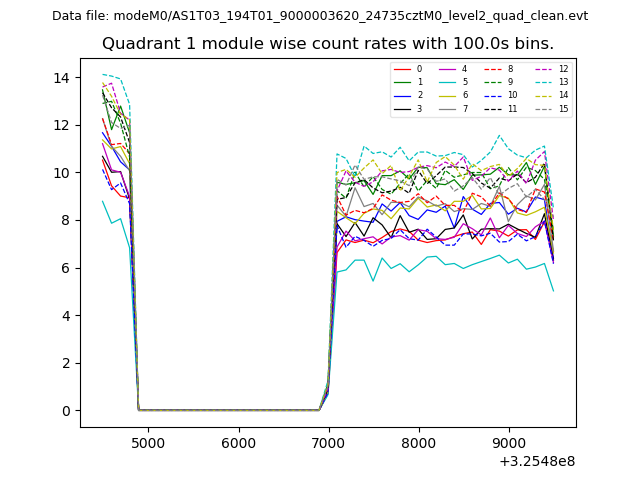
| Module-wise count rates for Quadrant A Data is divided into 100 sec bins |
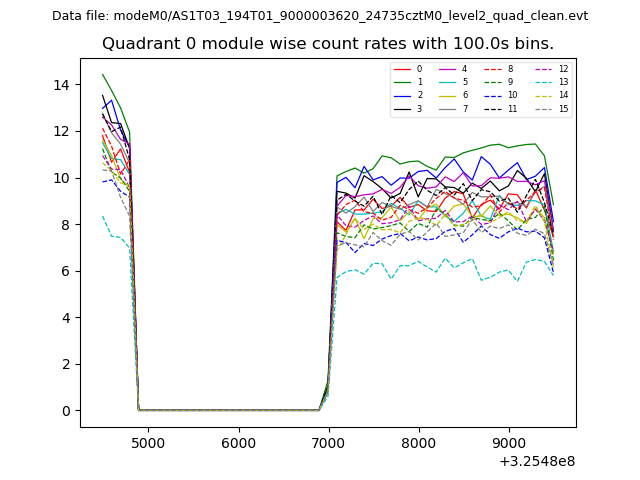 |
 |
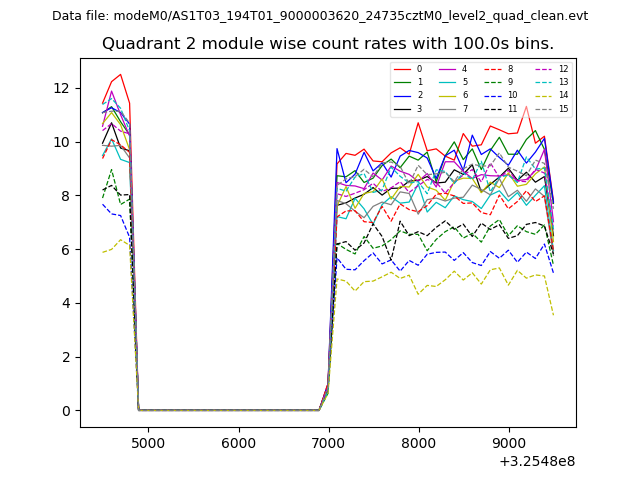
| Module-wise count rates for Quadrant B Data is divided into 100 sec bins |
 |
 |
| Module-wise count rates for Quadrant C Data is divided into 100 sec bins |
 |
 |
| Module-wise count rates for Quadrant D Data is divided into 100 sec bins |
 |
 |
| Parameter | Plot |
|---|---|
| CZT HV Monitor | 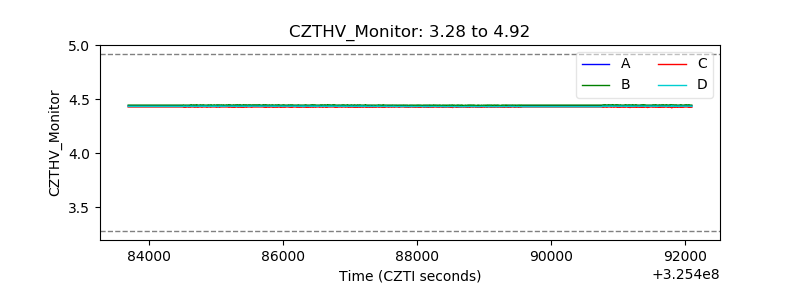 |
| D_VDD | 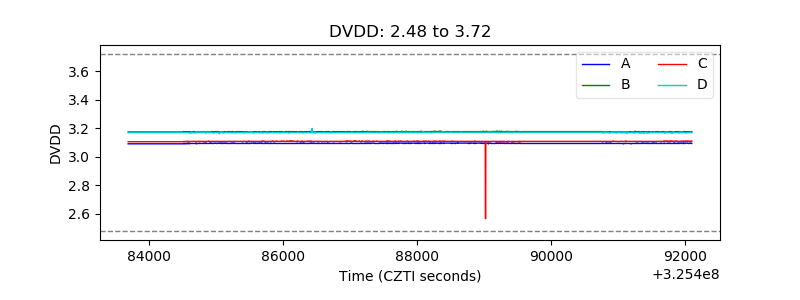 |
| Temperature 1 | 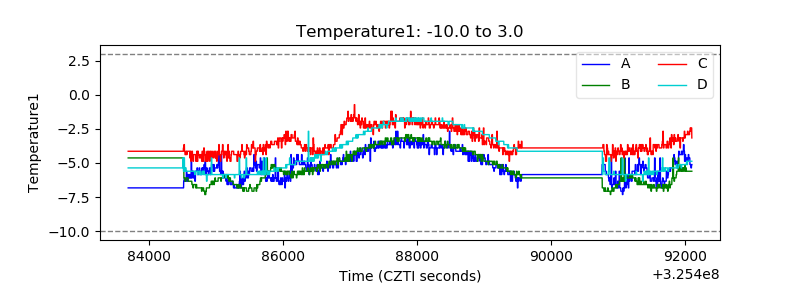 |
| Veto HV Monitor | 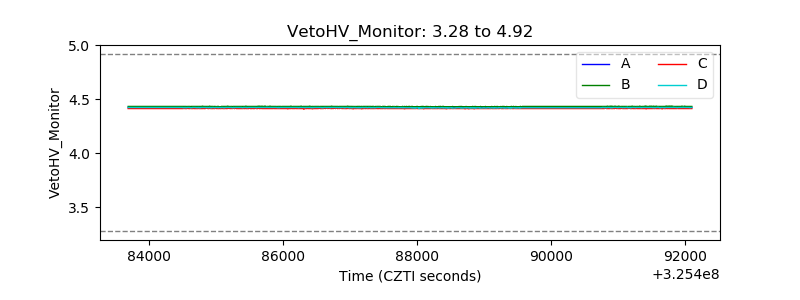 |
| Veto LLD | 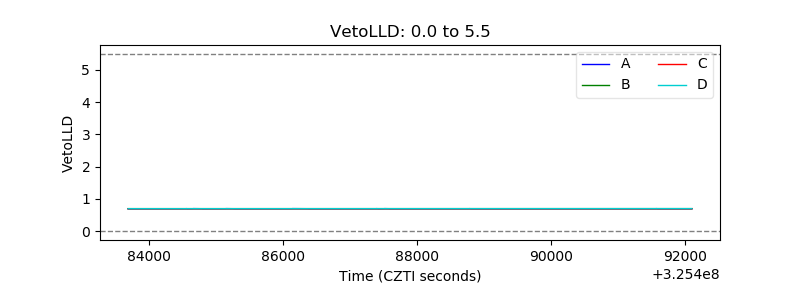 |
| Alpha Counter | 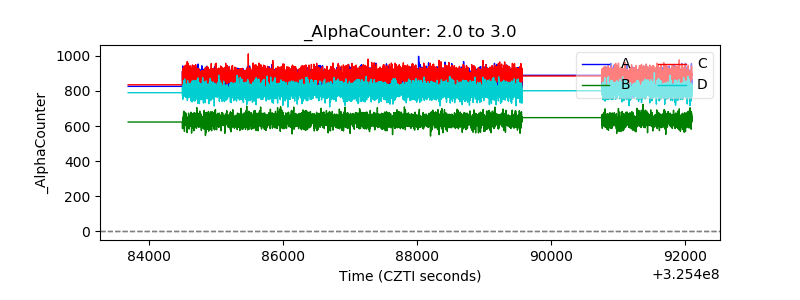 |
| _CPM_Rate | 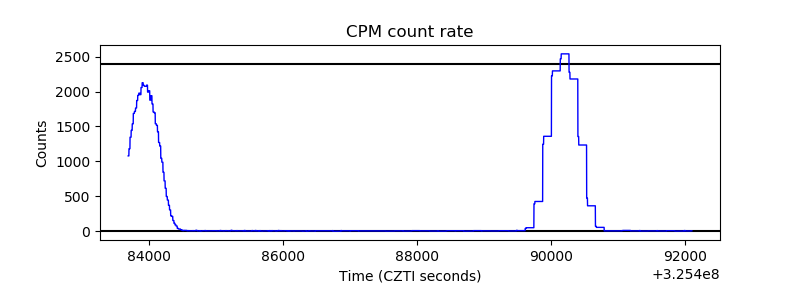 |
| CZT Counter | 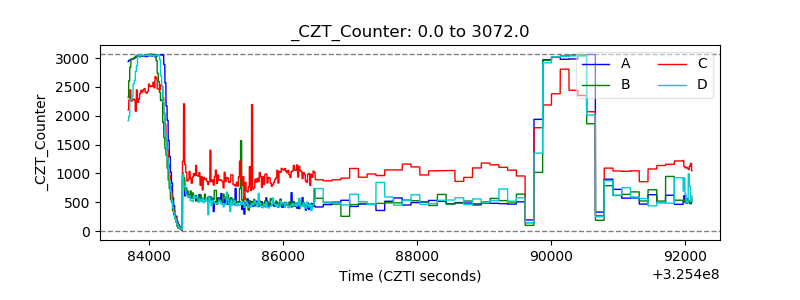 |
| +2.5 Volts monitor |  |
| +5 Volts monitor |  |
| _ROLL_ROT | 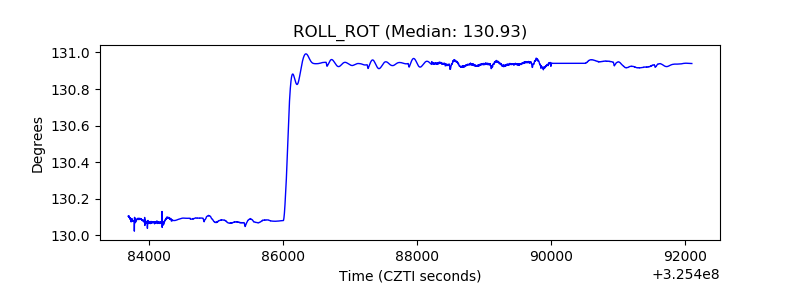 |
| _Roll_DEC |  |
| _Roll_RA | 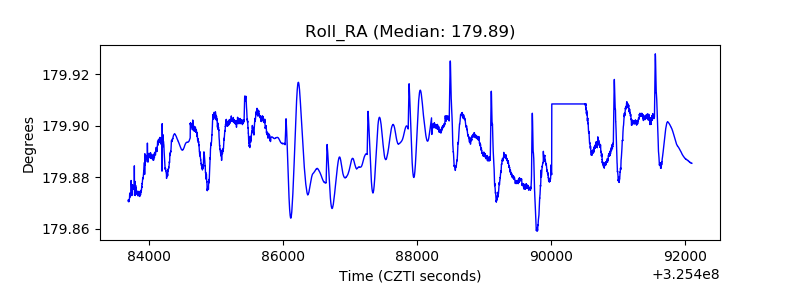 |
| Veto Counter | 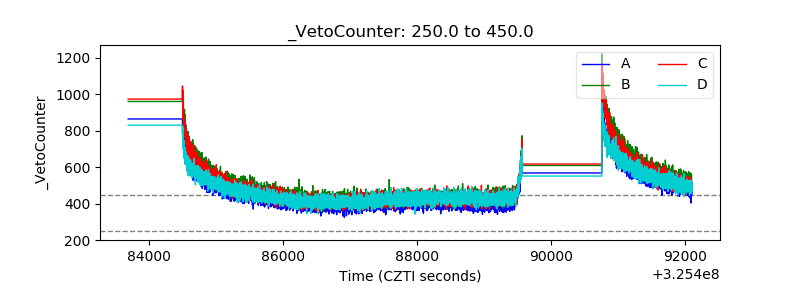 |