| Param | Original file | Final file |
|---|---|---|
| Filename | modeM0/AS1T03_194T01_9000003620_24737cztM0_level2.evt | modeM0/AS1T03_194T01_9000003620_24737cztM0_level2_quad_clean.evt |
| Size (bytes) | 617,964,480 | 74,681,280 |
| Size | 589.3 MB | 71.2 MB |
| Events in quadrant A | 3,509,888 | 477,150 |
| Events in quadrant B | 3,654,266 | 481,503 |
| Events in quadrant C | 6,785,744 | 425,695 |
| Events in quadrant D | 4,344,788 | 442,288 |
| Mode M9 | |||
|---|---|---|---|
| Quadrant | BADHDUFLAG | Total packets | Discarded packets |
| A | 0 | 18 | 0 |
| B | 0 | 19 | 0 |
| C | 0 | 19 | 0 |
| D | 0 | 19 | 0 |
| Mode M0 | |||
|---|---|---|---|
| Quadrant | BADHDUFLAG | Total packets | Discarded packets |
| A | 0 | 14289 | 2 |
| B | 0 | 14803 | 2 |
| C | 0 | 24506 | 2 |
| D | 0 | 16681 | 2 |
| Mode SS | |||
|---|---|---|---|
| Quadrant | BADHDUFLAG | Total packets | Discarded packets |
| A | 0 | 128 | 0 |
| B | 0 | 128 | 0 |
| C | 0 | 128 | 0 |
| D | 0 | 128 | 0 |
| Quadrant | Total seconds | Saturated seconds | Saturation percentage |
|---|---|---|---|
| A | 6221 | 57 | 0.916251% |
| B | 6221 | 100 | 1.607459% |
| C | 6221 | 389 | 6.253014% |
| D | 6221 | 162 | 2.604083% |
Noise dominated data is calculated using 1-second bins in cleaned event files. If a bin has >2000 counts, and if more than 50% of those come from <1% of pixels, then it is considered to be noise-dominated and hence unusable.
| Quadrant | # 1 sec bins | Bins with >0 counts | Bins with >2000 counts | High rate bins dominated by noise | Noise dominated (total time) | Noise dominated (detector-on time) | Marked lightcurve |
|---|---|---|---|---|---|---|---|
| A | 7580 | 6220 | 0 | 0 | 0.00% | 0.00% | 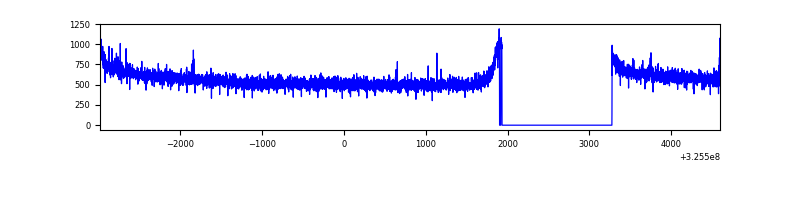 |
| B | 7581 | 6221 | 13 | 13 | 0.17% | 0.21% | 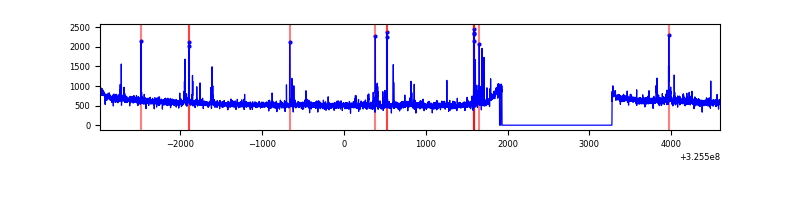 |
| C | 7581 | 6221 | 71 | 71 | 0.94% | 1.14% | 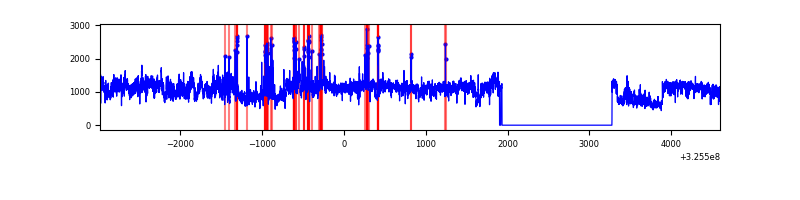 |
| D | 7581 | 6222 | 130 | 130 | 1.71% | 2.09% | 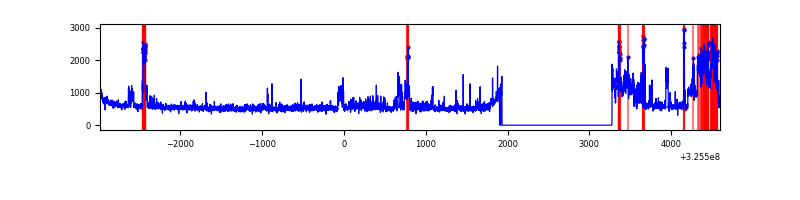 |
Top three noisy pixels from each quadrant. If the there are fewer than three noisy pixels in the level2.evt file, extra rows are filled as -1
| Pixel properties | Quadrant properties | ||||||
|---|---|---|---|---|---|---|---|
| Quadrant | DetID | PixID | Counts | Sigma | Mean | Median | Sigma |
| A | 13 | 254 | 8724 | 44.37 | 907 | 896 | 176.4 |
| A | 0 | 226 | 7960 | 40.04 | 907 | 896 | 176.4 |
| A | 3 | 137 | 7508 | 37.48 | 907 | 896 | 176.4 |
| B | 3 | 64 | 96639 | 582.54 | 889 | 873 | 164.4 |
| B | 6 | 36 | 58019 | 347.61 | 889 | 873 | 164.4 |
| B | 12 | 111 | 19510 | 113.37 | 889 | 873 | 164.4 |
| C | 7 | 247 | 3110816 | 16458.06 | 829 | 838 | 189.0 |
| C | 2 | 16 | 290438 | 1532.57 | 829 | 838 | 189.0 |
| C | 14 | 238 | 135044 | 710.22 | 829 | 838 | 189.0 |
| D | 1 | 52 | 896863 | 4383.36 | 856 | 834 | 204.4 |
| D | 8 | 195 | 164353 | 799.93 | 856 | 834 | 204.4 |
| D | 7 | 238 | 39050 | 186.95 | 856 | 834 | 204.4 |
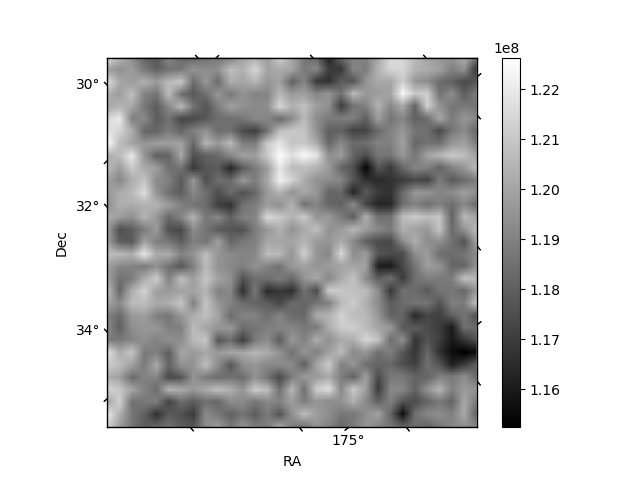
Histogram calculated using DETX and DETY for each event in the final _common_clean file
| Quadrant A | 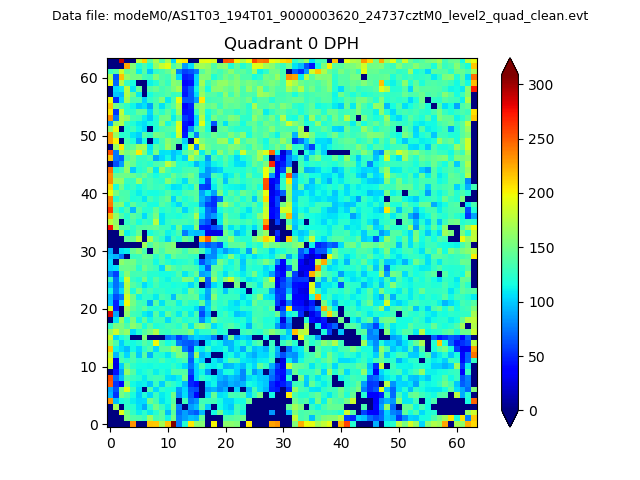 |
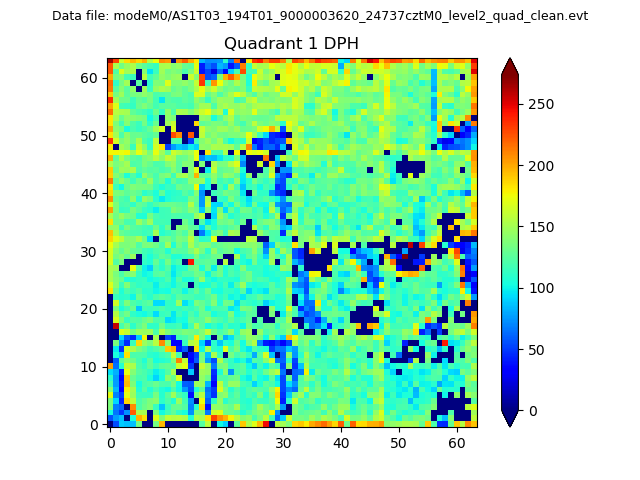 |
Quadrant B |
|---|---|---|---|
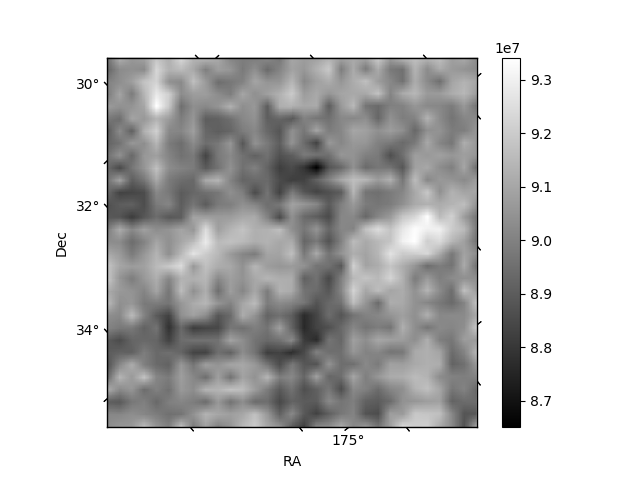
| Quadrant D | 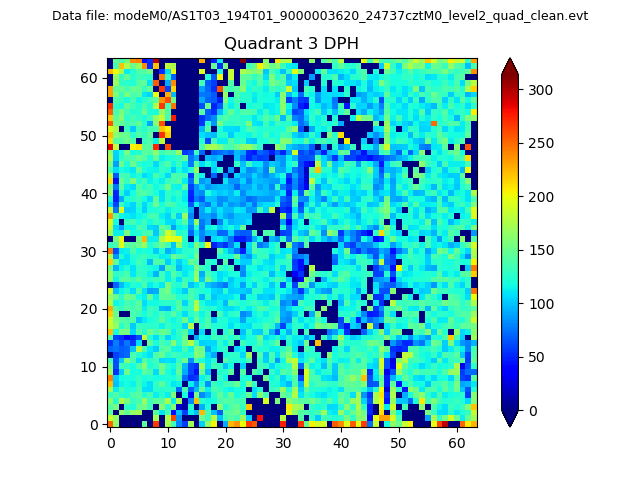 |
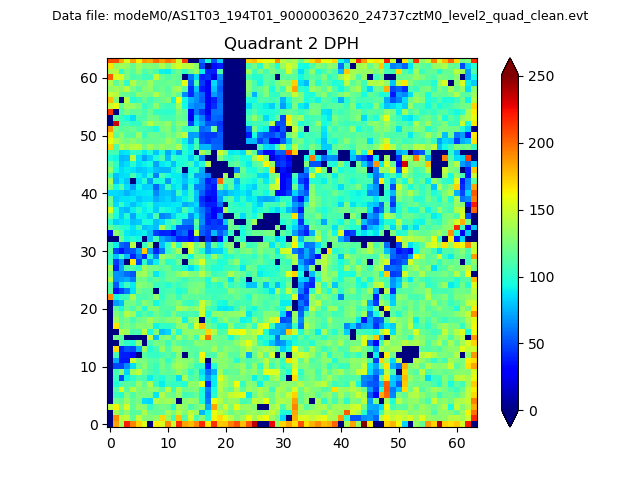 |
Quadrant C |
| Plot type | Count rate plots | Images |
|---|---|---|
| Comparison with Poisson distribution Blue bars denote a histogram of data divided into 1 sec bins. Red curve is a Poisson curve with rate = median count rate of data. |
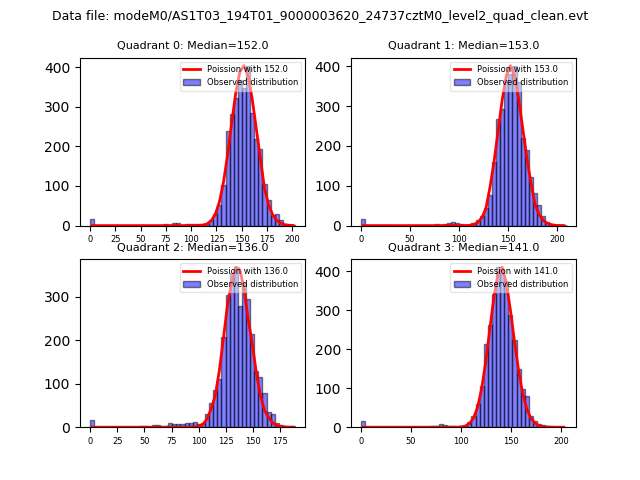 |
 |
| Quadrant-wise count rates Data is divided into 100 sec bins |
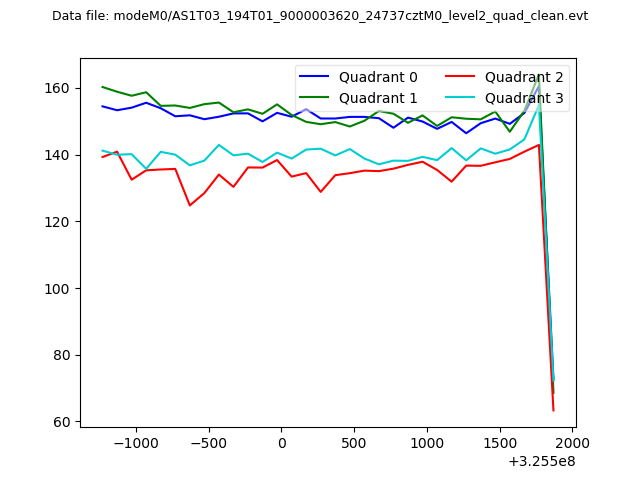 |
|
| Module-wise count rates for Quadrant A Data is divided into 100 sec bins |
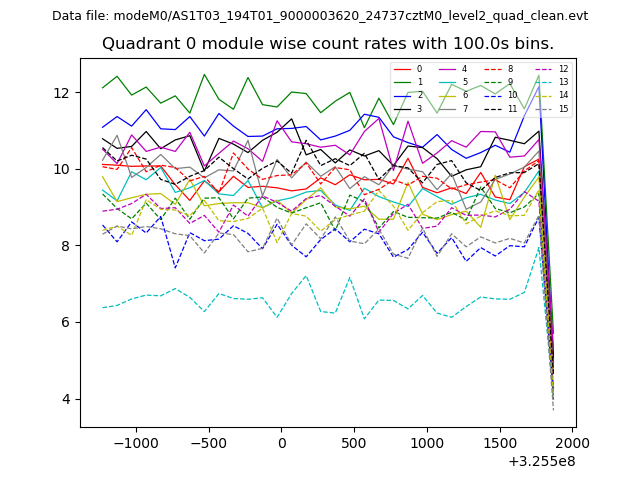 |
 |
| Module-wise count rates for Quadrant B Data is divided into 100 sec bins |
 |
 |
| Module-wise count rates for Quadrant C Data is divided into 100 sec bins |
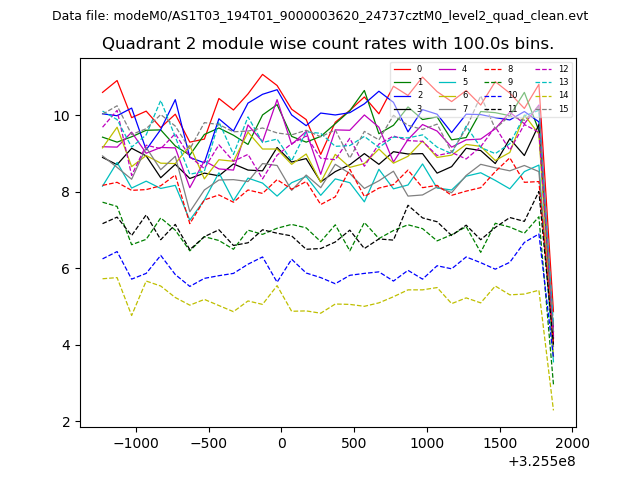 |
 |
| Module-wise count rates for Quadrant D Data is divided into 100 sec bins |
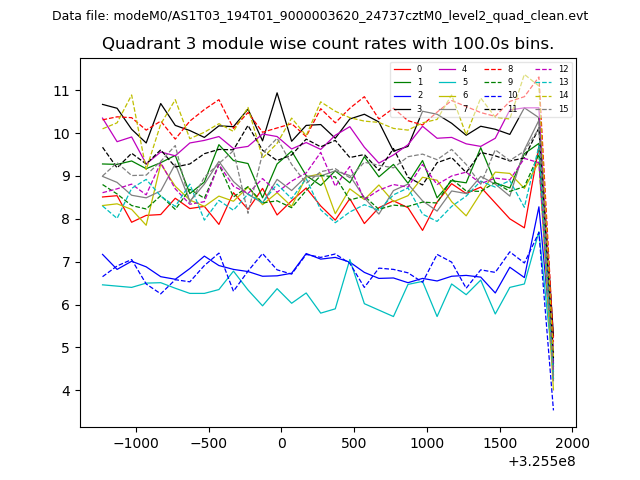 |
 |
| Parameter | Plot |
|---|---|
| CZT HV Monitor | 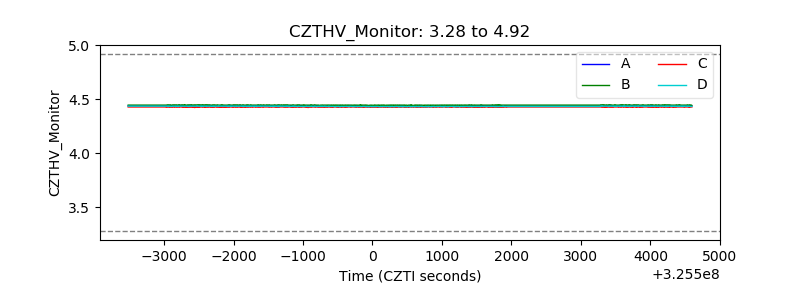 |
| D_VDD | 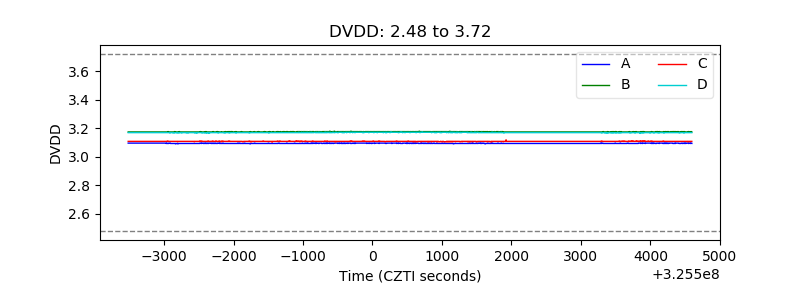 |
| Temperature 1 | 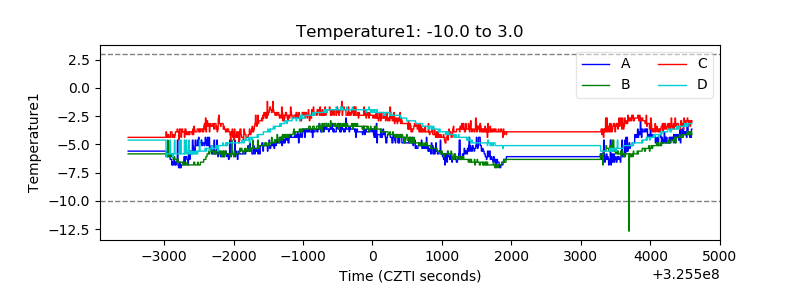 |
| Veto HV Monitor | 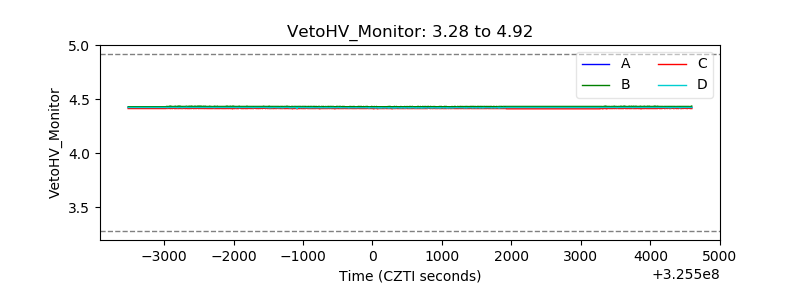 |
| Veto LLD | 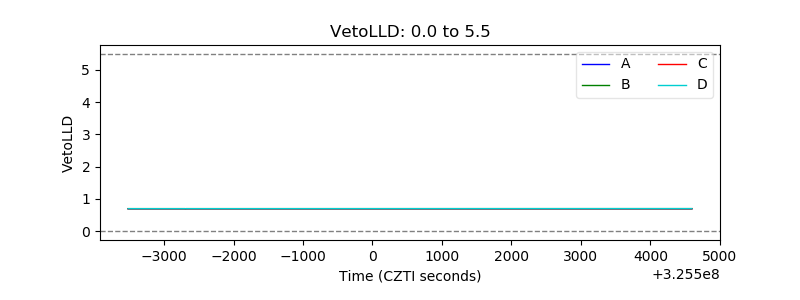 |
| Alpha Counter | 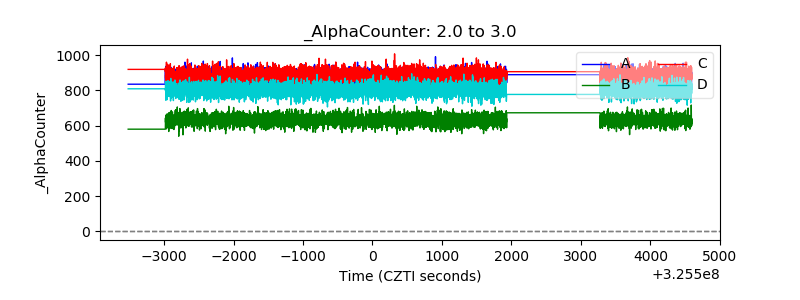 |
| _CPM_Rate | 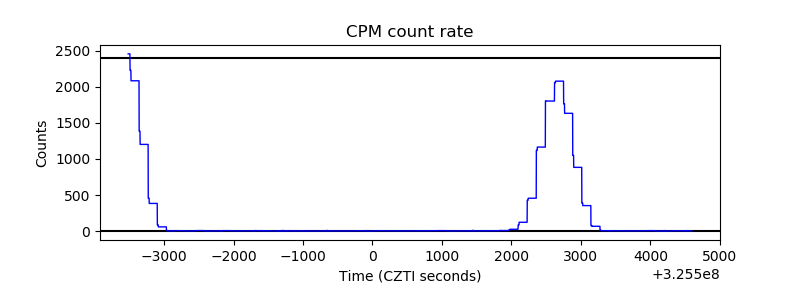 |
| CZT Counter | 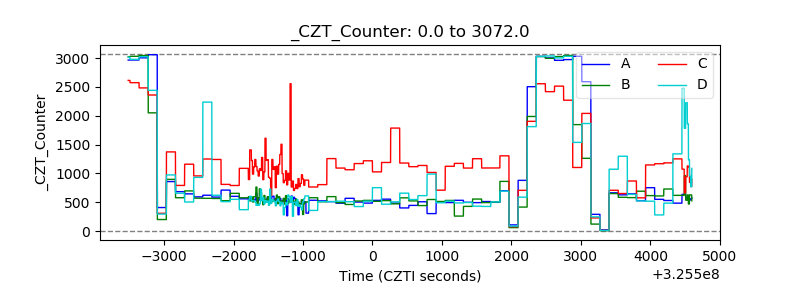 |
| +2.5 Volts monitor |  |
| +5 Volts monitor |  |
| _ROLL_ROT |  |
| _Roll_DEC |  |
| _Roll_RA | 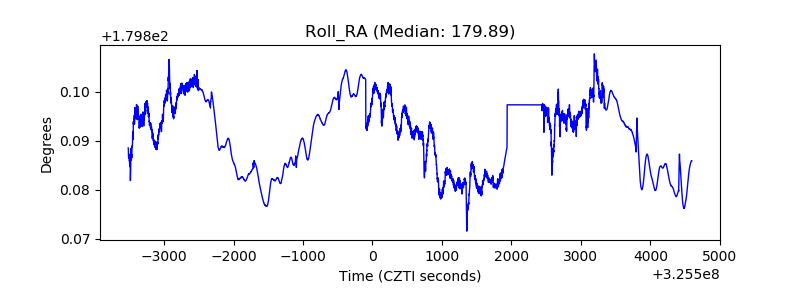 |
| Veto Counter | 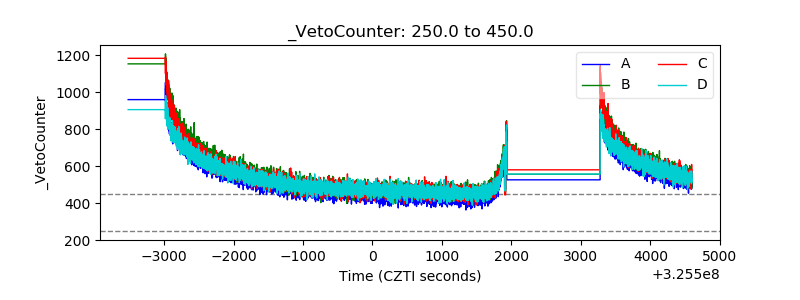 |