| Param | Original file | Final file |
|---|---|---|
| Filename | modeM0/AS1T03_194T01_9000003620_24739cztM0_level2.evt | modeM0/AS1T03_194T01_9000003620_24739cztM0_level2_quad_clean.evt |
| Size (bytes) | 489,156,480 | 99,034,560 |
| Size | 466.5 MB | 94.4 MB |
| Events in quadrant A | 2,947,666 | 677,128 |
| Events in quadrant B | 3,049,050 | 677,560 |
| Events in quadrant C | 4,545,528 | 623,648 |
| Events in quadrant D | 3,885,421 | 622,473 |
| Mode M9 | |||
|---|---|---|---|
| Quadrant | BADHDUFLAG | Total packets | Discarded packets |
| A | 0 | 12 | 0 |
| B | 0 | 12 | 0 |
| C | 0 | 12 | 0 |
| D | 0 | 12 | 0 |
| Mode M0 | |||
|---|---|---|---|
| Quadrant | BADHDUFLAG | Total packets | Discarded packets |
| A | 0 | 11999 | 1 |
| B | 0 | 12341 | 1 |
| C | 0 | 17643 | 1 |
| D | 0 | 15193 | 1 |
| Mode SS | |||
|---|---|---|---|
| Quadrant | BADHDUFLAG | Total packets | Discarded packets |
| A | 0 | 114 | 0 |
| B | 0 | 114 | 0 |
| C | 0 | 114 | 0 |
| D | 0 | 114 | 0 |
| Quadrant | Total seconds | Saturated seconds | Saturation percentage |
|---|---|---|---|
| A | 5707 | 58 | 1.016296% |
| B | 5706 | 85 | 1.489660% |
| C | 5707 | 179 | 3.136499% |
| D | 5707 | 187 | 3.276678% |
Noise dominated data is calculated using 1-second bins in cleaned event files. If a bin has >2000 counts, and if more than 50% of those come from <1% of pixels, then it is considered to be noise-dominated and hence unusable.
| Quadrant | # 1 sec bins | Bins with >0 counts | Bins with >2000 counts | High rate bins dominated by noise | Noise dominated (total time) | Noise dominated (detector-on time) | Marked lightcurve |
|---|---|---|---|---|---|---|---|
| A | 6887 | 5707 | 0 | 0 | 0.00% | 0.00% | 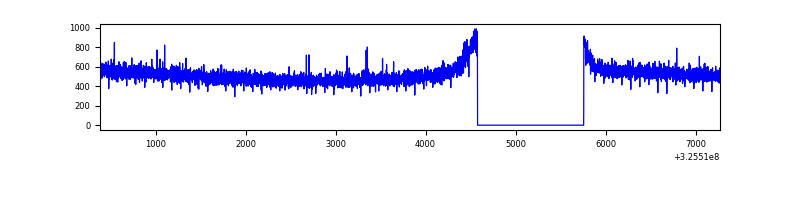 |
| B | 6886 | 5706 | 16 | 16 | 0.23% | 0.28% | 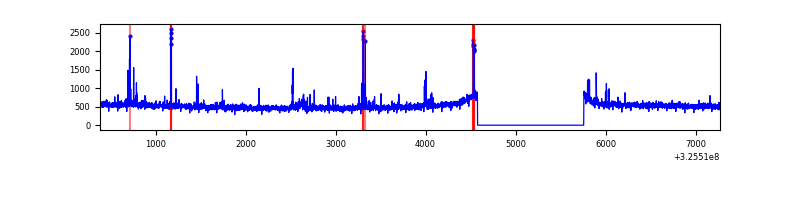 |
| C | 6887 | 5707 | 0 | 0 | 0.00% | 0.00% | 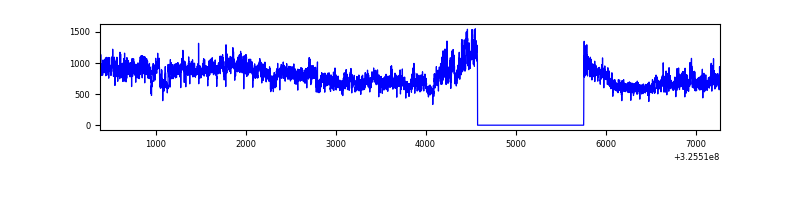 |
| D | 6887 | 5707 | 181 | 181 | 2.63% | 3.17% | 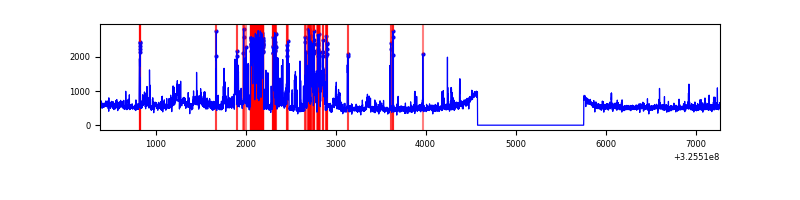 |
Top three noisy pixels from each quadrant. If the there are fewer than three noisy pixels in the level2.evt file, extra rows are filled as -1
| Pixel properties | Quadrant properties | ||||||
|---|---|---|---|---|---|---|---|
| Quadrant | DetID | PixID | Counts | Sigma | Mean | Median | Sigma |
| A | 13 | 254 | 8627 | 51.47 | 763 | 749 | 153.1 |
| A | 3 | 137 | 6770 | 39.34 | 763 | 749 | 153.1 |
| A | 0 | 226 | 6569 | 38.03 | 763 | 749 | 153.1 |
| B | 3 | 64 | 43875 | 302.82 | 742 | 725 | 142.5 |
| B | 6 | 36 | 34384 | 236.22 | 742 | 725 | 142.5 |
| B | 4 | 80 | 30214 | 206.95 | 742 | 725 | 142.5 |
| C | 7 | 247 | 1641197 | 9920.38 | 713 | 719 | 165.4 |
| C | 14 | 238 | 114390 | 687.39 | 713 | 719 | 165.4 |
| C | 7 | 226 | 5071 | 26.31 | 713 | 719 | 165.4 |
| D | 1 | 52 | 945887 | 5322.87 | 733 | 713 | 177.6 |
| D | 8 | 195 | 92923 | 519.29 | 733 | 713 | 177.6 |
| D | 13 | 104 | 33562 | 184.99 | 733 | 713 | 177.6 |
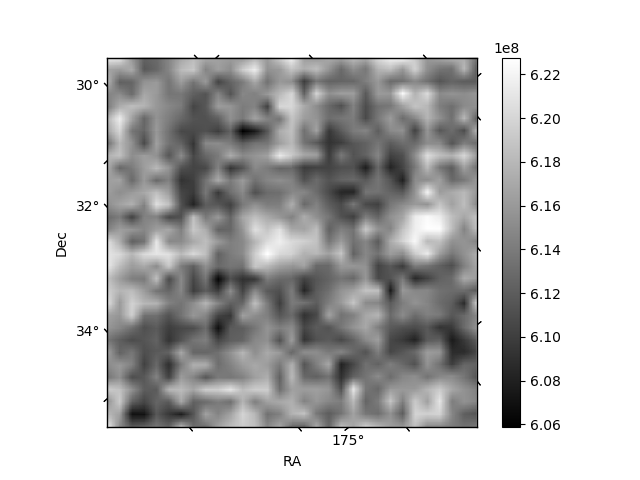
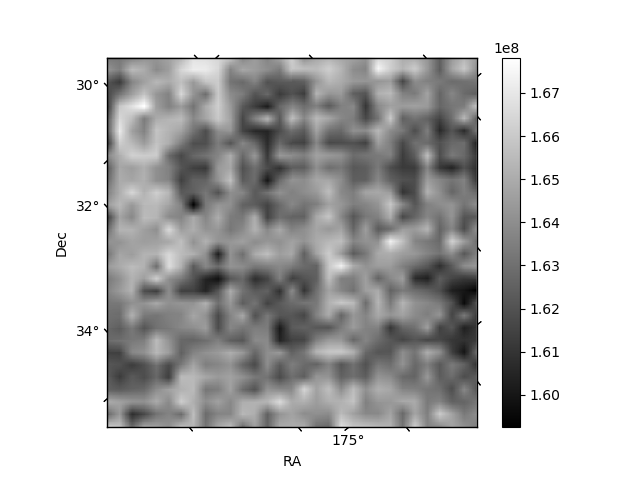
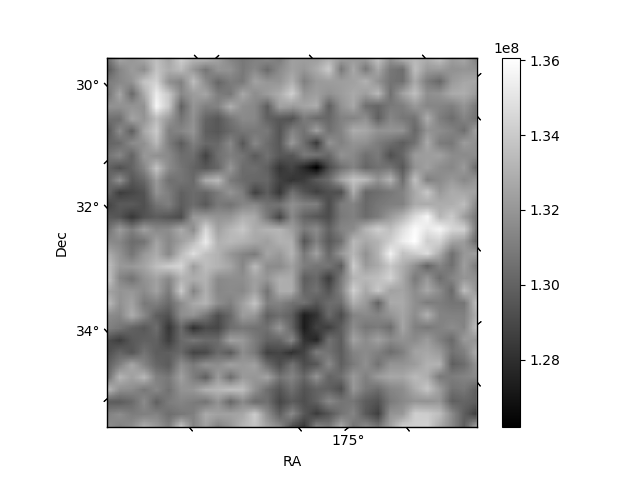
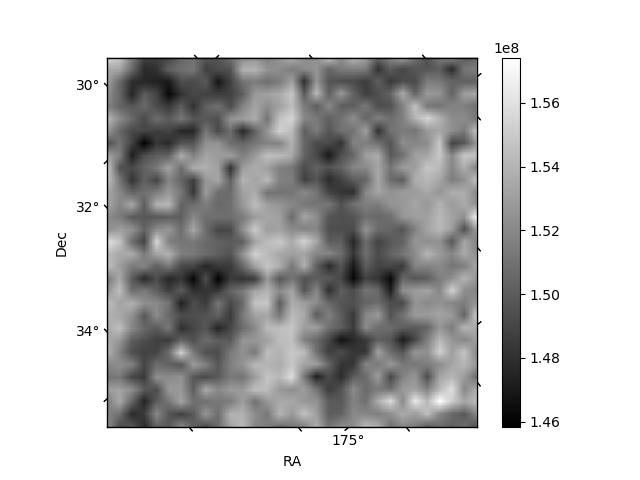
Histogram calculated using DETX and DETY for each event in the final _common_clean file
| Quadrant A | 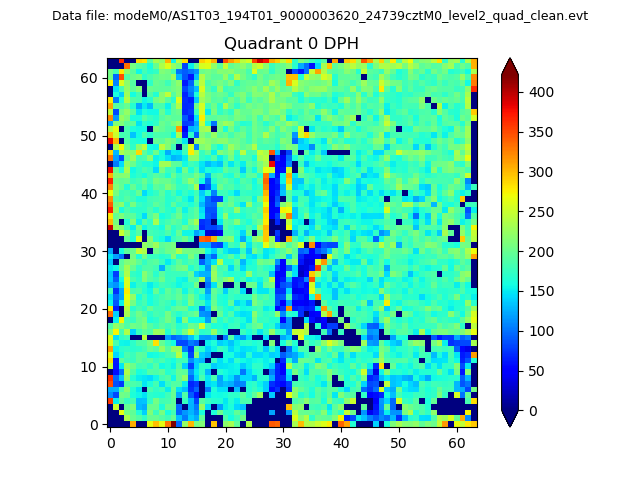 |
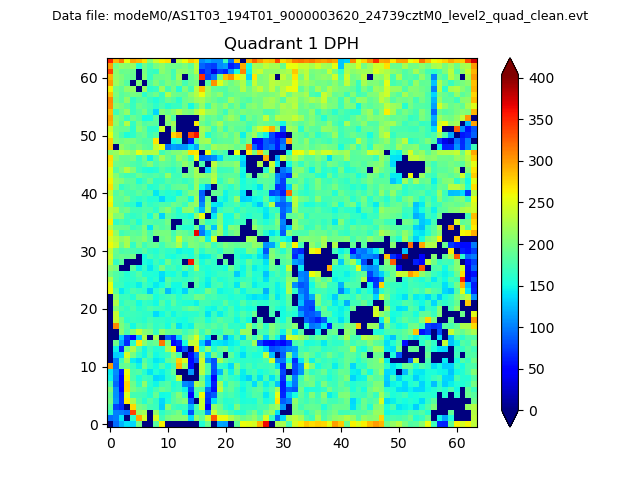 |
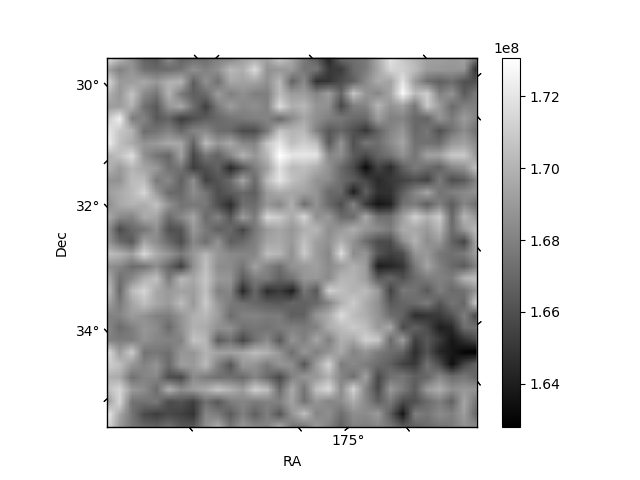
Quadrant B |
|---|---|---|---|
| Quadrant D | 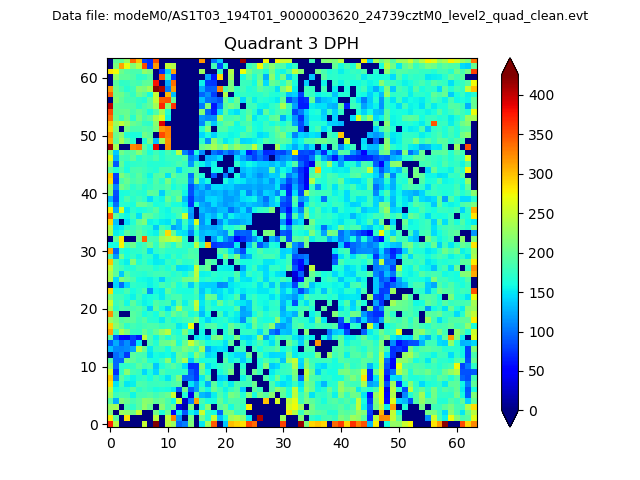 |
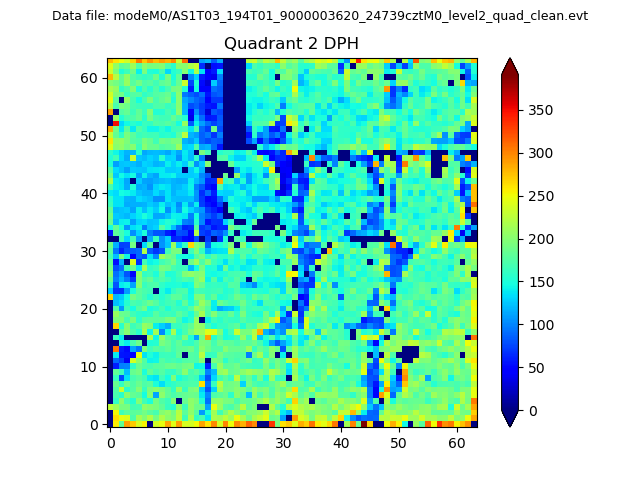 |
Quadrant C |
| Plot type | Count rate plots | Images |
|---|---|---|
| Comparison with Poisson distribution Blue bars denote a histogram of data divided into 1 sec bins. Red curve is a Poisson curve with rate = median count rate of data. |
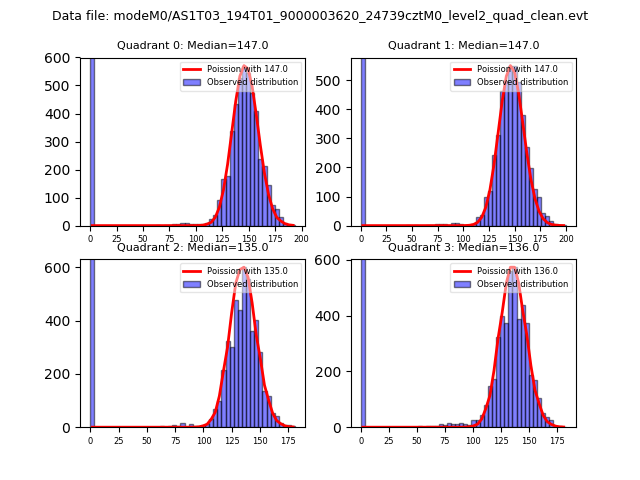 |
 |
| Quadrant-wise count rates Data is divided into 100 sec bins |
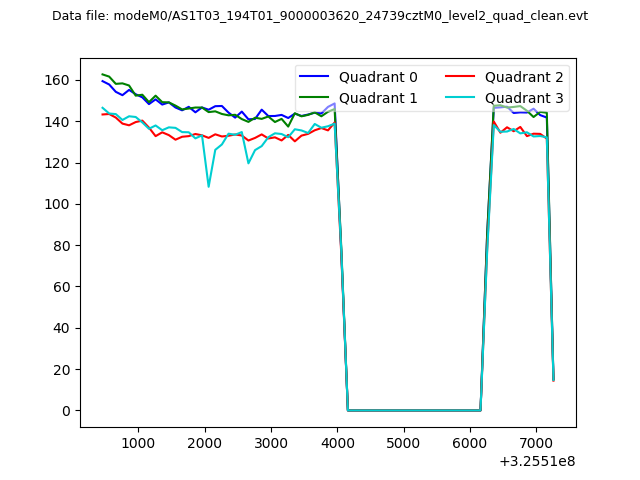 |
|
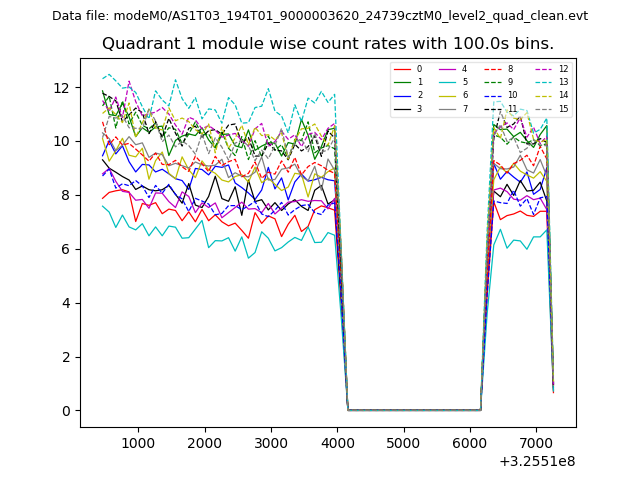
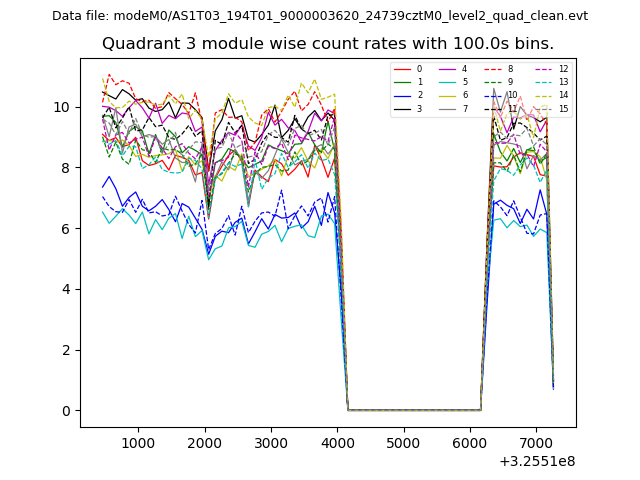
| Module-wise count rates for Quadrant A Data is divided into 100 sec bins |
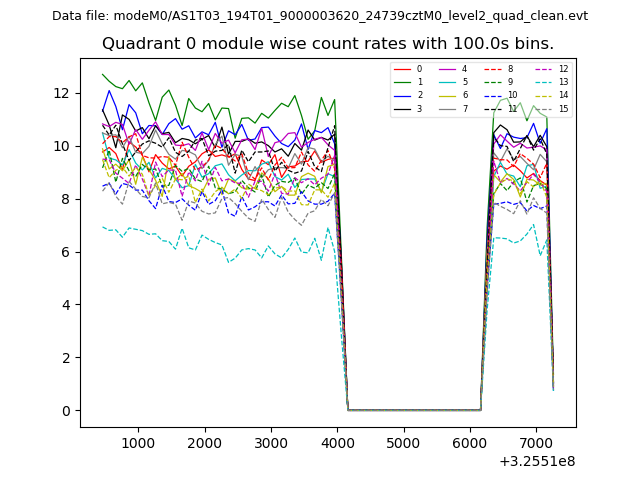 |
 |
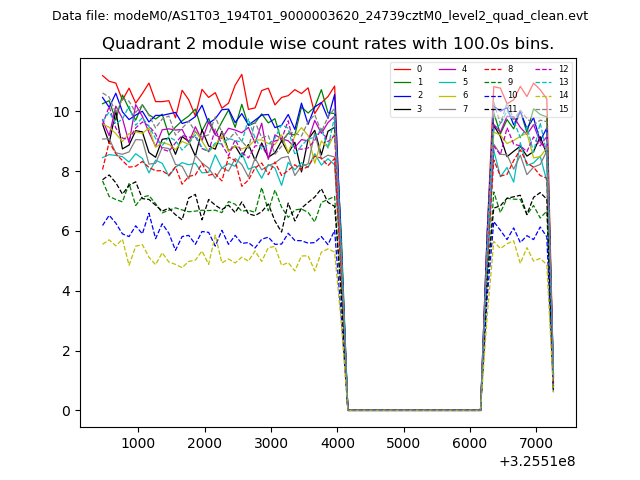
| Module-wise count rates for Quadrant B Data is divided into 100 sec bins |
 |
 |
| Module-wise count rates for Quadrant C Data is divided into 100 sec bins |
 |
 |
| Module-wise count rates for Quadrant D Data is divided into 100 sec bins |
 |
 |
| Parameter | Plot |
|---|---|
| CZT HV Monitor | 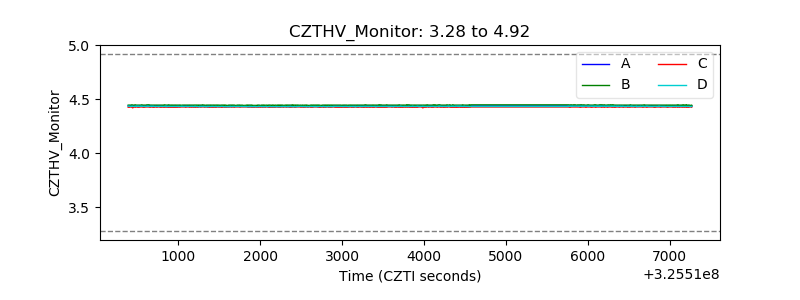 |
| D_VDD | 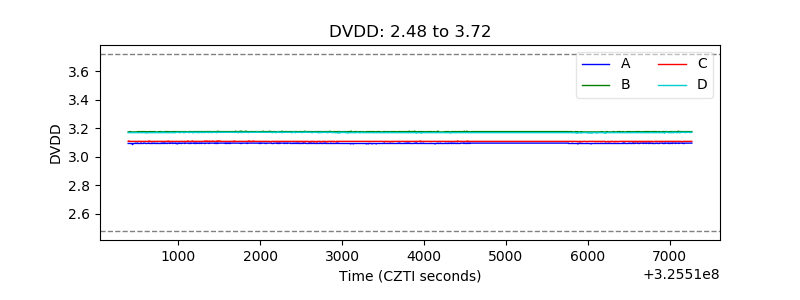 |
| Temperature 1 | 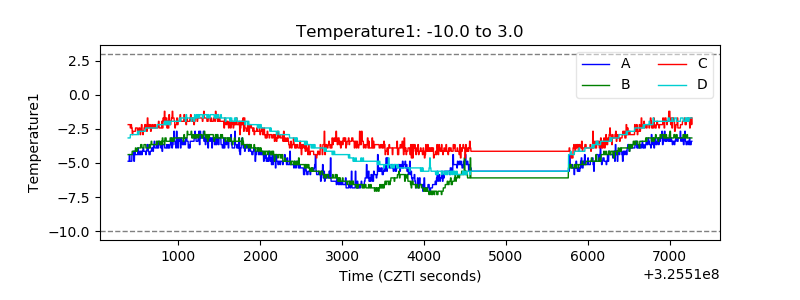 |
| Veto HV Monitor | 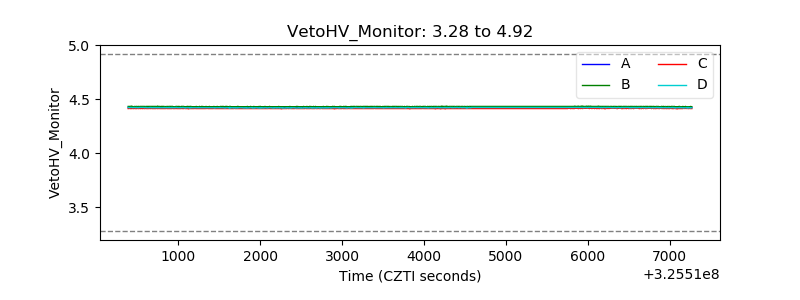 |
| Veto LLD | 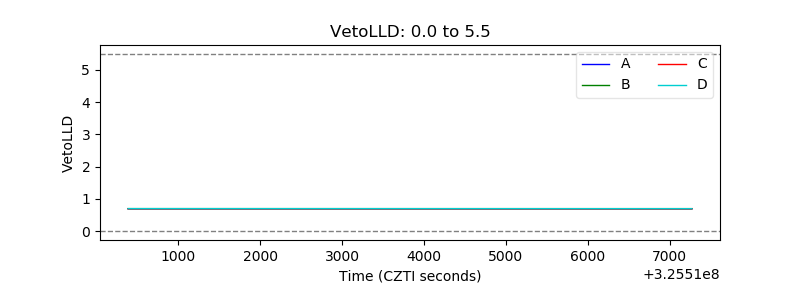 |
| Alpha Counter | 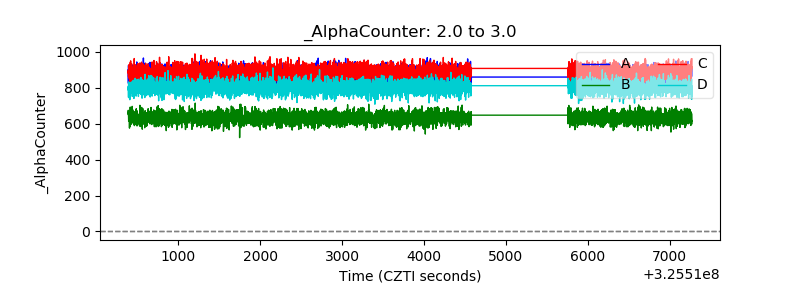 |
| _CPM_Rate | 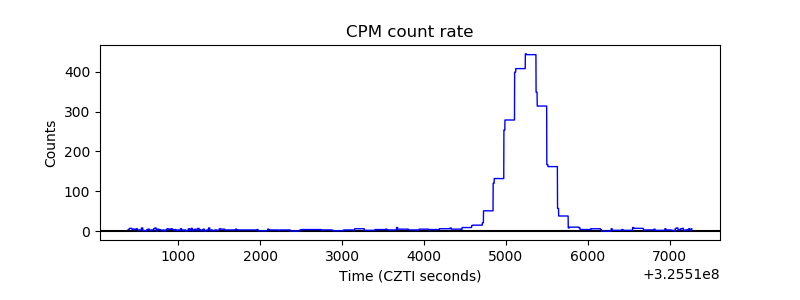 |
| CZT Counter | 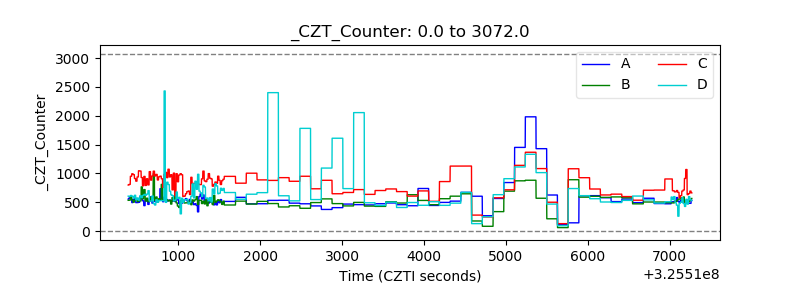 |
| +2.5 Volts monitor |  |
| +5 Volts monitor |  |
| _ROLL_ROT | 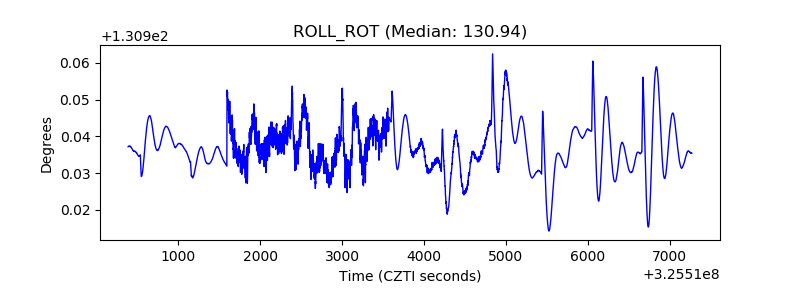 |
| _Roll_DEC |  |
| _Roll_RA | 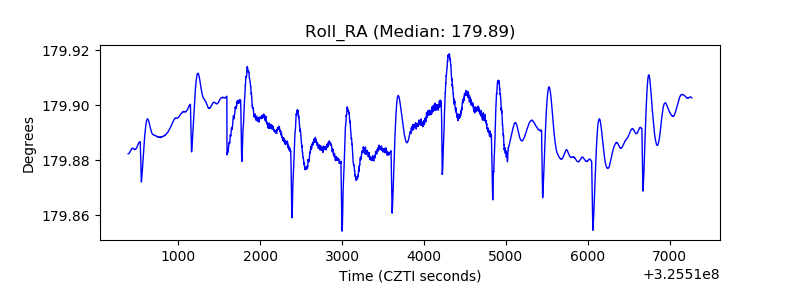 |
| Veto Counter | 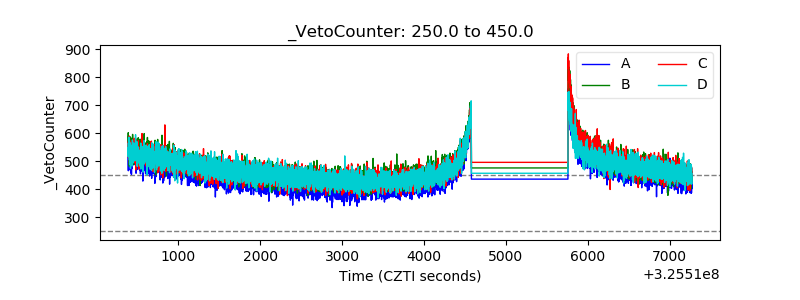 |