| Param | Original file | Final file |
|---|---|---|
| Filename | modeM0/AS1A07_018T08_9000003622cztM0_level2.fits | modeM0/AS1A07_018T08_9000003622cztM0_level2_quad_clean.evt |
| Size (bytes) | 949,320,000 | 793,520,640 |
| Size | 905.3 MB | 756.8 MB |
| Events in quadrant A | 5,932,062 | 4,614,606 |
| Events in quadrant B | 5,609,574 | 4,563,811 |
| Events in quadrant C | 5,572,320 | 4,190,981 |
| Events in quadrant D | 4,982,934 | 4,010,563 |
| Mode SS | |||
|---|---|---|---|
| Quadrant | BADHDUFLAG | Total packets | Discarded packets |
| A | 0 | 1978 | 0 |
| B | 0 | 1978 | 0 |
| C | 0 | 1978 | 0 |
| D | 0 | 1978 | 0 |
| Mode M0 | |||
|---|---|---|---|
| Quadrant | BADHDUFLAG | Total packets | Discarded packets |
| A | 0 | 200587 | 0 |
| B | 0 | 211395 | 0 |
| C | 0 | 240635 | 0 |
| D | 0 | 252059 | 0 |
| Mode M9 | |||
|---|---|---|---|
| Quadrant | BADHDUFLAG | Total packets | Discarded packets |
| A | 0 | 136 | 0 |
| B | 0 | 136 | 0 |
| C | 0 | 136 | 0 |
| D | 0 | 136 | 0 |
| Quadrant | Total seconds | Saturated seconds | Saturation percentage |
|---|---|---|---|
| A | 97024 | 1127 | 1.161568% |
| B | 97024 | 2058 | 2.121125% |
| C | 97024 | 5501 | 5.669731% |
| D | 97024 | 3126 | 3.221883% |
Noise dominated data is calculated using 1-second bins in cleaned event files. If a bin has >2000 counts, and if more than 50% of those come from <1% of pixels, then it is considered to be noise-dominated and hence unusable.
| Quadrant | # 1 sec bins | Bins with >0 counts | Bins with >2000 counts | High rate bins dominated by noise | Noise dominated (total time) | Noise dominated (detector-on time) | Marked lightcurve |
|---|---|---|---|---|---|---|---|
| A | 110728 | 97014 | 0 | 0 | 0.00% | 0.00% |  |
| B | 110728 | 97005 | 0 | 0 | 0.00% | 0.00% |  |
| C | 110728 | 97006 | 0 | 0 | 0.00% | 0.00% |  |
| D | 110728 | 96998 | 0 | 0 | 0.00% | 0.00% |  |
Top three noisy pixels from each quadrant. If the there are fewer than three noisy pixels in the level2.evt file, extra rows are filled as -1
| Pixel properties | Quadrant properties | ||||||
|---|---|---|---|---|---|---|---|
| Quadrant | DetID | PixID | Counts | Sigma | Mean | Median | Sigma |
| A | 0 | 29 | 5662 | 11.33 | 1543 | 1452 | 371.6 |
| A | 7 | 110 | 4798 | 9.01 | 1543 | 1452 | 371.6 |
| A | 0 | 30 | 4518 | 8.25 | 1543 | 1452 | 371.6 |
| B | 2 | 9 | 4672 | 11.18 | 1482 | 1414 | 291.4 |
| B | 2 | 8 | 3883 | 8.47 | 1482 | 1414 | 291.4 |
| B | 5 | 128 | 3709 | 7.88 | 1482 | 1414 | 291.4 |
| C | 12 | 241 | 3884 | 6.69 | 1474 | 1375 | 375.2 |
| C | 3 | 126 | 3792 | 6.44 | 1474 | 1375 | 375.2 |
| C | 12 | 250 | 3737 | 6.3 | 1474 | 1375 | 375.2 |
| D | 6 | 231 | 3531 | 5.96 | 1422 | 1296 | 375.1 |
| D | 10 | 189 | 3508 | 5.9 | 1422 | 1296 | 375.1 |
| D | 6 | 67 | 3466 | 5.78 | 1422 | 1296 | 375.1 |
Histogram calculated using DETX and DETY for each event in the final _common_clean file
| Quadrant A | 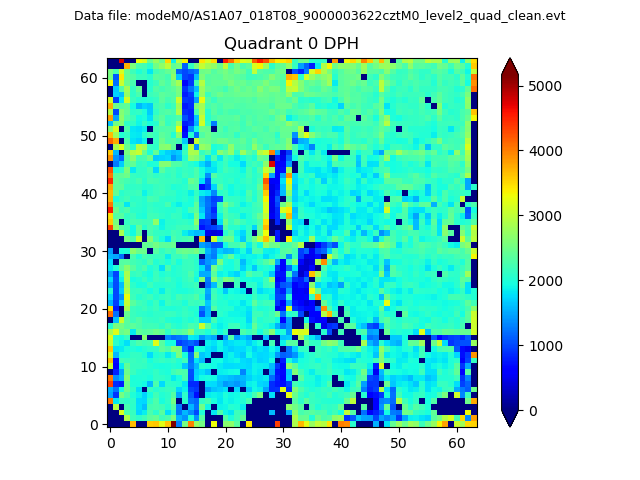 |
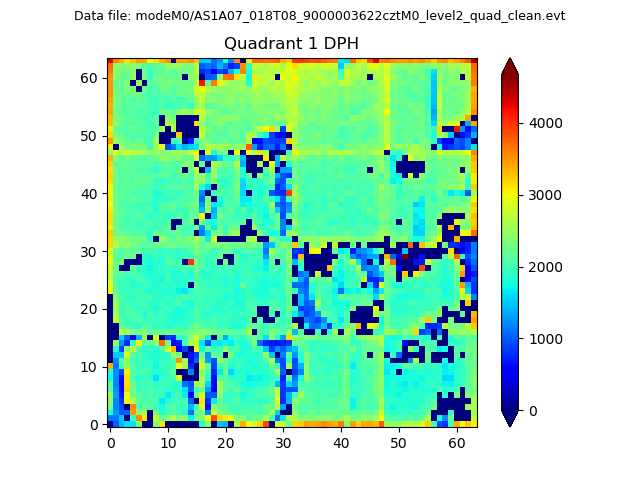 |
Quadrant B |
|---|---|---|---|
| Quadrant D |  |
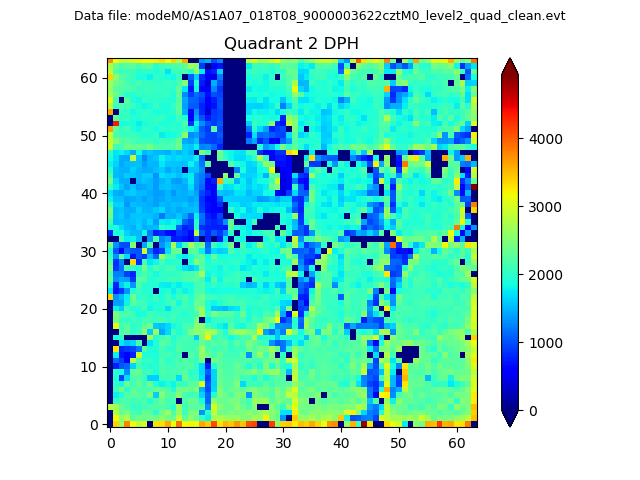 |
Quadrant C |
| Plot type | Count rate plots | Images |
|---|---|---|
| Comparison with Poisson distribution Blue bars denote a histogram of data divided into 1 sec bins. Red curve is a Poisson curve with rate = median count rate of data. |
 |
 |
| Quadrant-wise count rates Data is divided into 100 sec bins |
 |
|
| Module-wise count rates for Quadrant A Data is divided into 100 sec bins |
 |
 |
| Module-wise count rates for Quadrant B Data is divided into 100 sec bins |
 |
 |
| Module-wise count rates for Quadrant C Data is divided into 100 sec bins |
 |
 |
| Module-wise count rates for Quadrant D Data is divided into 100 sec bins |
 |
 |
| Parameter | Plot |
|---|---|
| CZT HV Monitor |  |
| D_VDD | 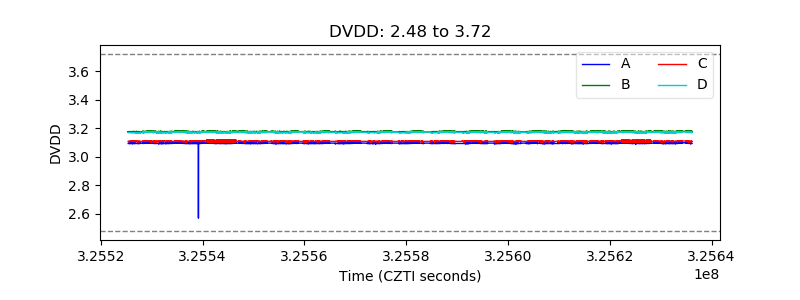 |
| Temperature 1 | 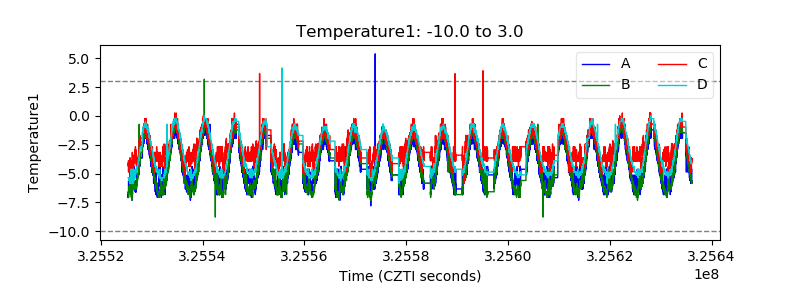 |
| Veto HV Monitor |  |
| Veto LLD |  |
| Alpha Counter |  |
| _CPM_Rate |  |
| CZT Counter |  |
| +2.5 Volts monitor |  |
| +5 Volts monitor |  |
| _ROLL_ROT | 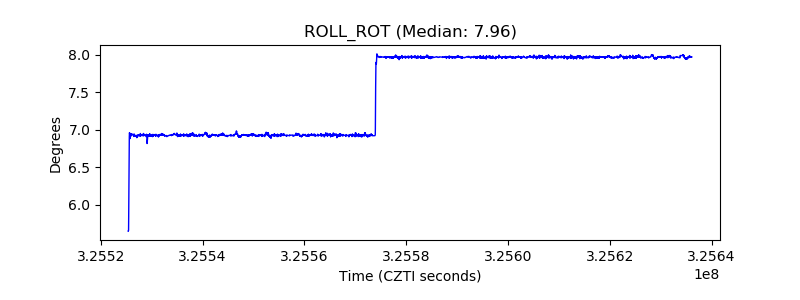 |
| _Roll_DEC |  |
| _Roll_RA |  |
| Veto Counter |  |