| Param | Original file | Final file |
|---|---|---|
| Filename | modeM0/AS1A07_018T08_9000003622_24745cztM0_level2.evt | modeM0/AS1A07_018T08_9000003622_24745cztM0_level2_quad_clean.evt |
| Size (bytes) | 778,348,800 | 129,620,160 |
| Size | 742.3 MB | 123.6 MB |
| Events in quadrant A | 4,396,981 | 838,541 |
| Events in quadrant B | 4,805,763 | 843,174 |
| Events in quadrant C | 5,731,457 | 808,562 |
| Events in quadrant D | 7,992,574 | 773,573 |
| Mode SS | |||
|---|---|---|---|
| Quadrant | BADHDUFLAG | Total packets | Discarded packets |
| A | 0 | 192 | 0 |
| B | 0 | 192 | 0 |
| C | 0 | 192 | 0 |
| D | 0 | 192 | 0 |
| Mode M0 | |||
|---|---|---|---|
| Quadrant | BADHDUFLAG | Total packets | Discarded packets |
| A | 0 | 19554 | 3 |
| B | 0 | 20742 | 3 |
| C | 0 | 23207 | 3 |
| D | 0 | 30582 | 3 |
| Mode M9 | |||
|---|---|---|---|
| Quadrant | BADHDUFLAG | Total packets | Discarded packets |
| A | 0 | 7 | 0 |
| B | 0 | 8 | 0 |
| C | 0 | 8 | 0 |
| D | 0 | 8 | 0 |
| Quadrant | Total seconds | Saturated seconds | Saturation percentage |
|---|---|---|---|
| A | 9547 | 64 | 0.670368% |
| B | 9547 | 181 | 1.895884% |
| C | 9547 | 340 | 3.561328% |
| D | 9546 | 635 | 6.652001% |
Noise dominated data is calculated using 1-second bins in cleaned event files. If a bin has >2000 counts, and if more than 50% of those come from <1% of pixels, then it is considered to be noise-dominated and hence unusable.
| Quadrant | # 1 sec bins | Bins with >0 counts | Bins with >2000 counts | High rate bins dominated by noise | Noise dominated (total time) | Noise dominated (detector-on time) | Marked lightcurve |
|---|---|---|---|---|---|---|---|
| A | 10086 | 9547 | 2 | 2 | 0.02% | 0.02% | 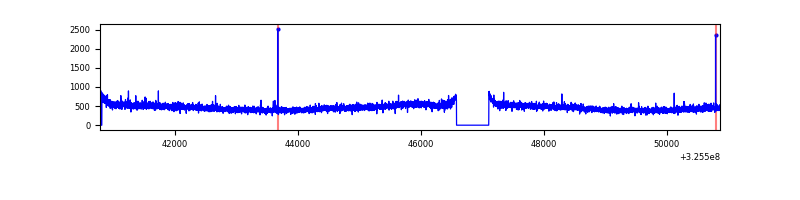 |
| B | 10086 | 9546 | 10 | 10 | 0.10% | 0.10% | 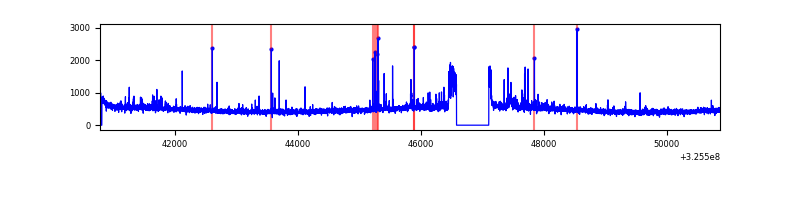 |
| C | 10086 | 9546 | 7 | 7 | 0.07% | 0.07% | 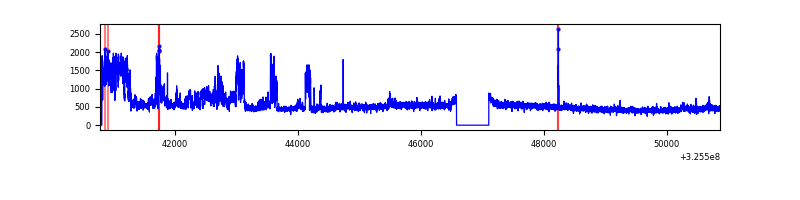 |
| D | 10085 | 9545 | 488 | 488 | 4.84% | 5.11% | 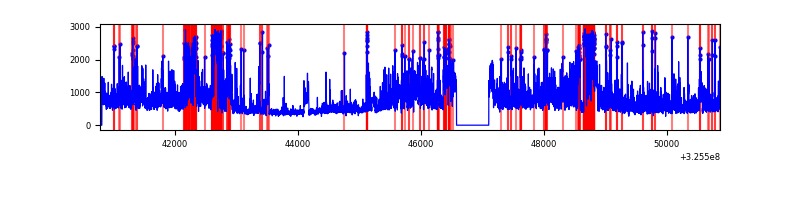 |
Top three noisy pixels from each quadrant. If the there are fewer than three noisy pixels in the level2.evt file, extra rows are filled as -1
| Pixel properties | Quadrant properties | ||||||
|---|---|---|---|---|---|---|---|
| Quadrant | DetID | PixID | Counts | Sigma | Mean | Median | Sigma |
| A | 13 | 254 | 17264 | 70.68 | 1134 | 1110 | 228.6 |
| A | 3 | 137 | 10426 | 40.76 | 1134 | 1110 | 228.6 |
| A | 0 | 226 | 9688 | 37.53 | 1134 | 1110 | 228.6 |
| B | 15 | 33 | 166877 | 774.34 | 1121 | 1091 | 214.1 |
| B | 4 | 80 | 63843 | 293.1 | 1121 | 1091 | 214.1 |
| B | 0 | 190 | 63277 | 290.45 | 1121 | 1091 | 214.1 |
| C | 7 | 247 | 1153691 | 4580.84 | 1079 | 1087 | 251.6 |
| C | 14 | 238 | 168804 | 666.56 | 1079 | 1087 | 251.6 |
| C | 10 | 91 | 140690 | 554.83 | 1079 | 1087 | 251.6 |
| D | 1 | 52 | 2728111 | 10414.51 | 1075 | 1043 | 261.9 |
| D | 8 | 195 | 915388 | 3491.83 | 1075 | 1043 | 261.9 |
| D | 12 | 233 | 159368 | 604.63 | 1075 | 1043 | 261.9 |
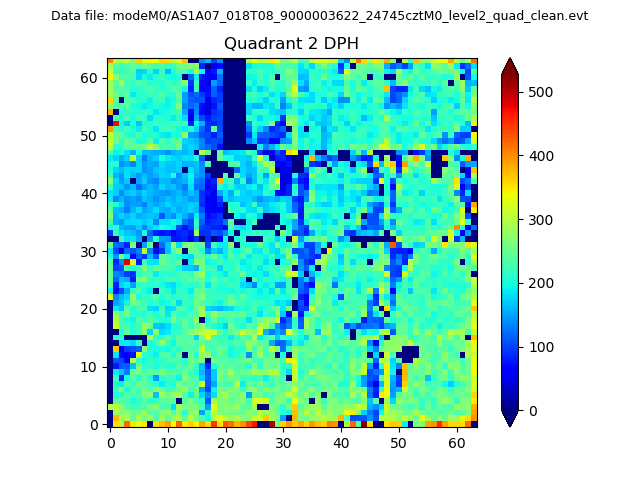
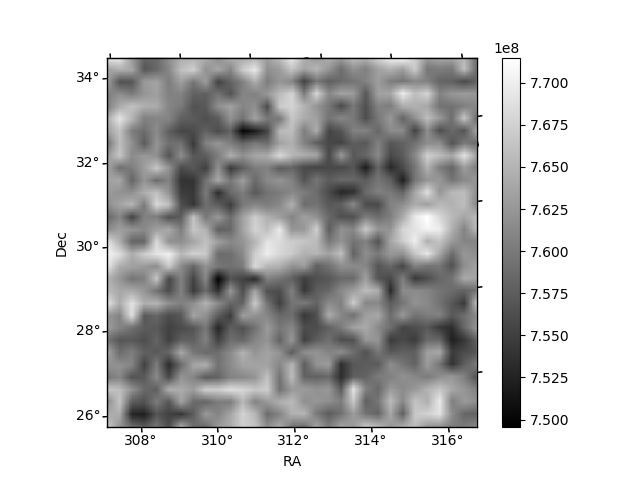
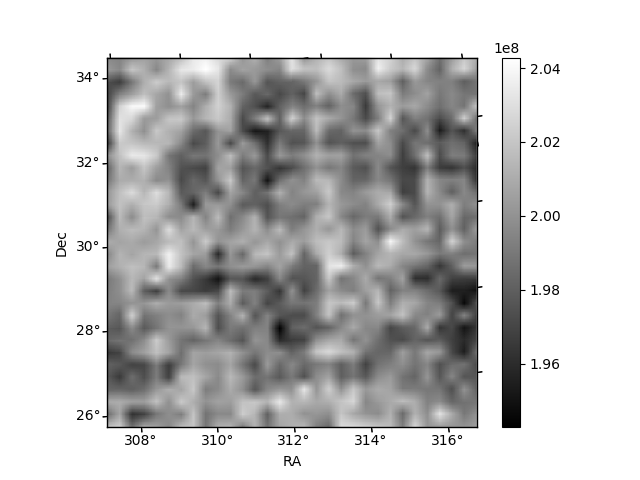
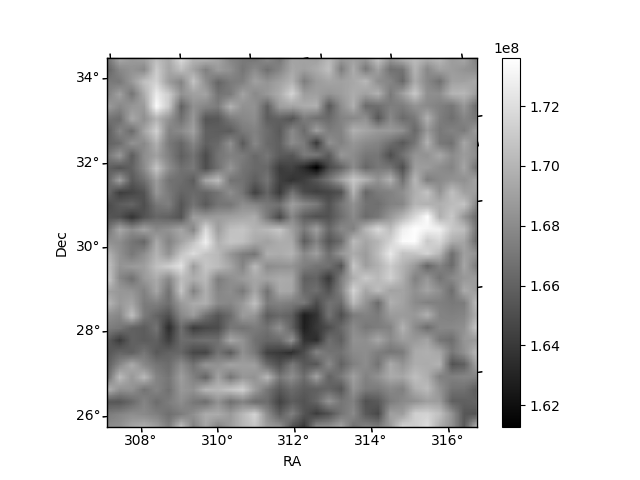
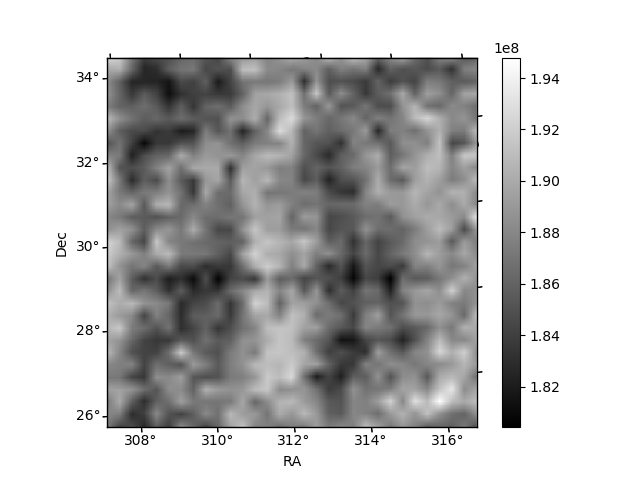
Histogram calculated using DETX and DETY for each event in the final _common_clean file
| Quadrant A | 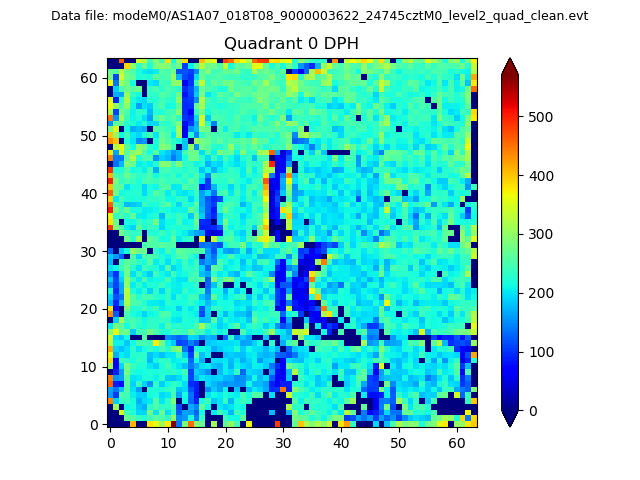 |
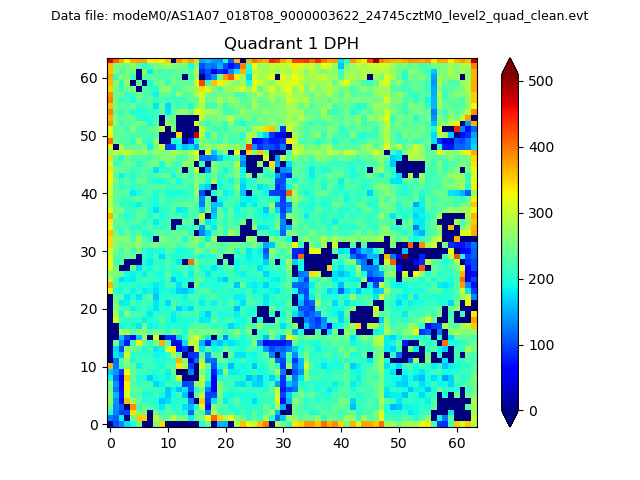 |
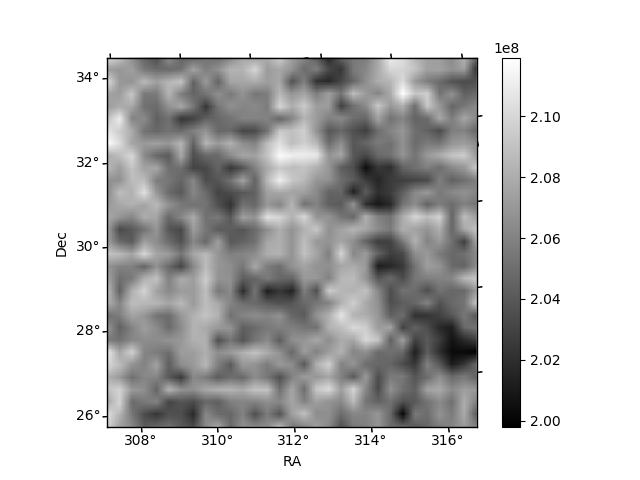
Quadrant B |
|---|---|---|---|
| Quadrant D | 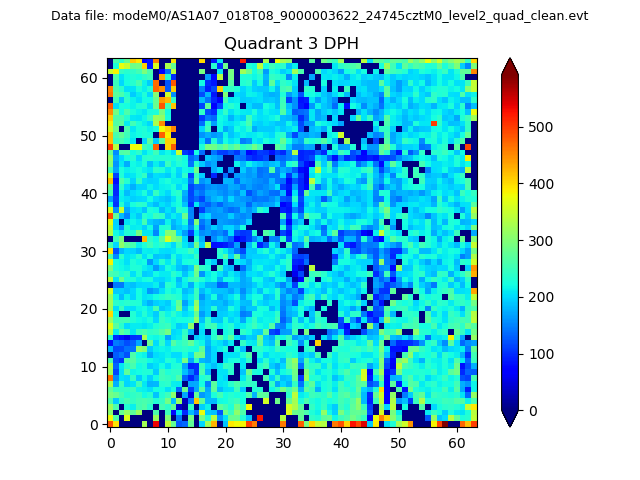 |
 |
Quadrant C |
| Plot type | Count rate plots | Images |
|---|---|---|
| Comparison with Poisson distribution Blue bars denote a histogram of data divided into 1 sec bins. Red curve is a Poisson curve with rate = median count rate of data. |
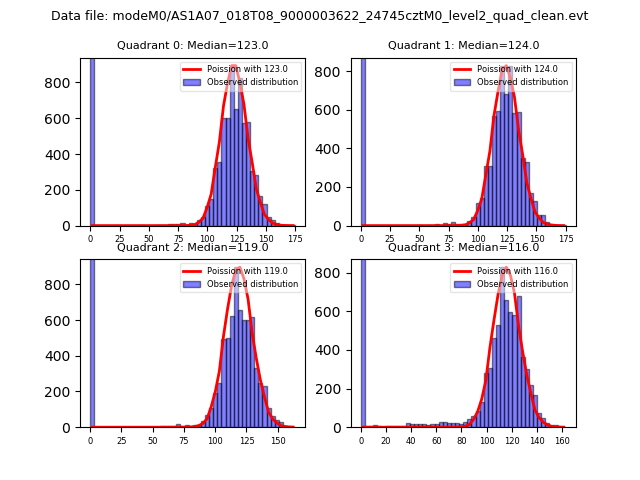 |
 |
| Quadrant-wise count rates Data is divided into 100 sec bins |
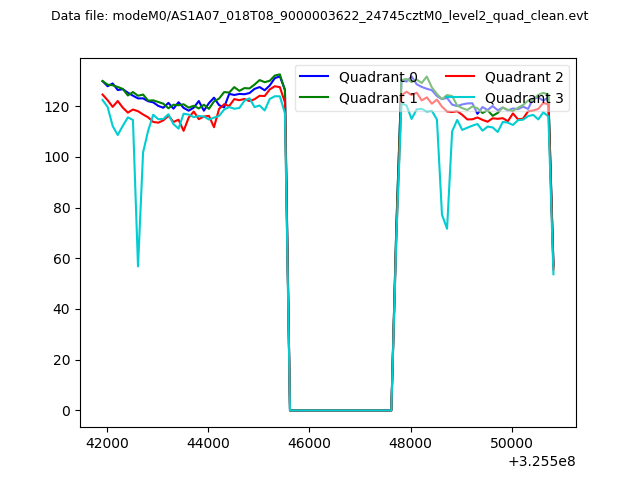 |
|
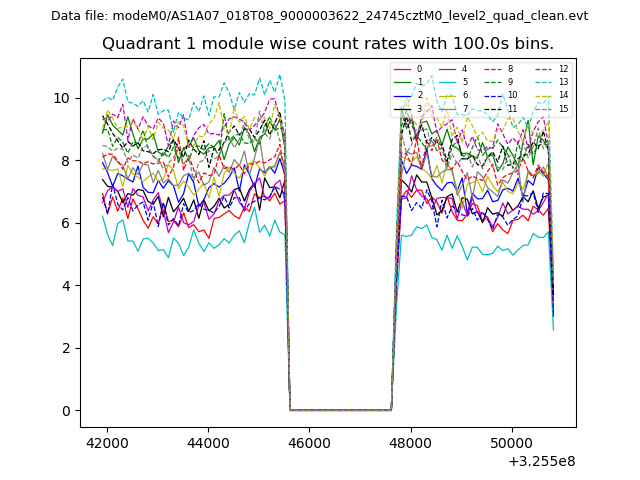
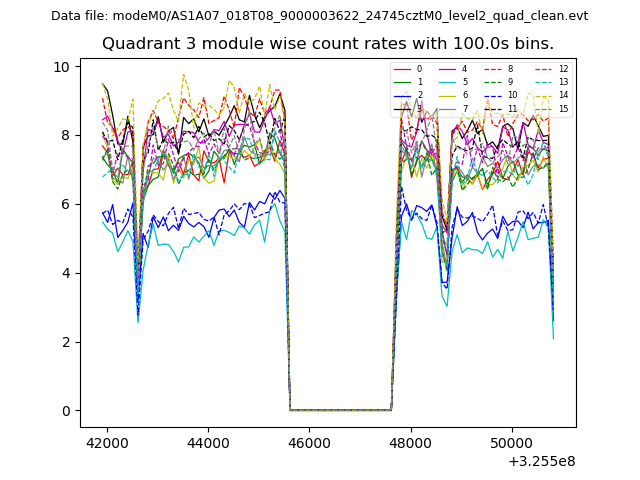
| Module-wise count rates for Quadrant A Data is divided into 100 sec bins |
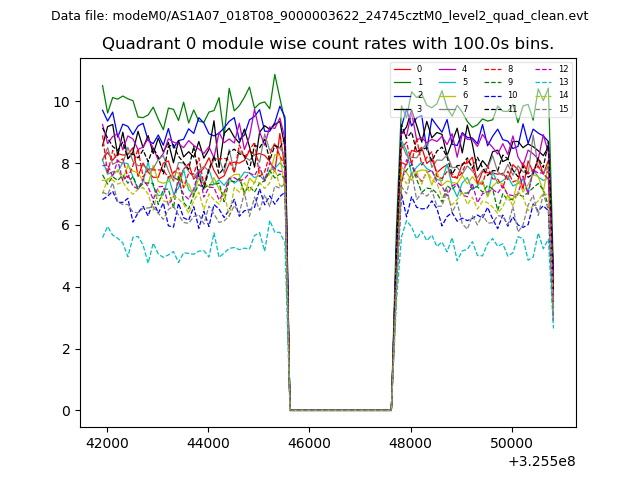 |
 |
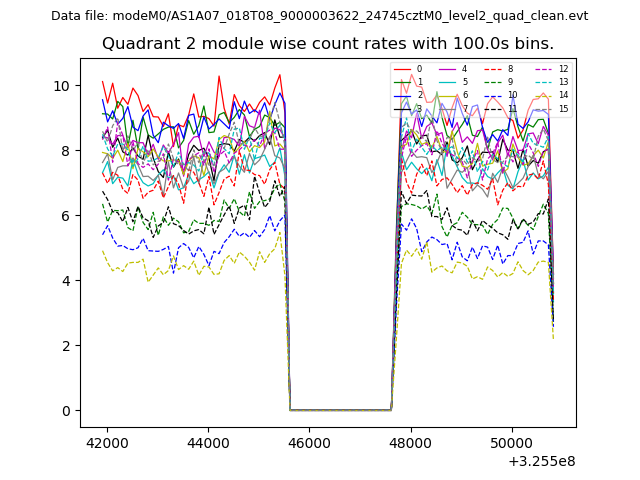
| Module-wise count rates for Quadrant B Data is divided into 100 sec bins |
 |
 |
| Module-wise count rates for Quadrant C Data is divided into 100 sec bins |
 |
 |
| Module-wise count rates for Quadrant D Data is divided into 100 sec bins |
 |
 |
| Parameter | Plot |
|---|---|
| CZT HV Monitor | 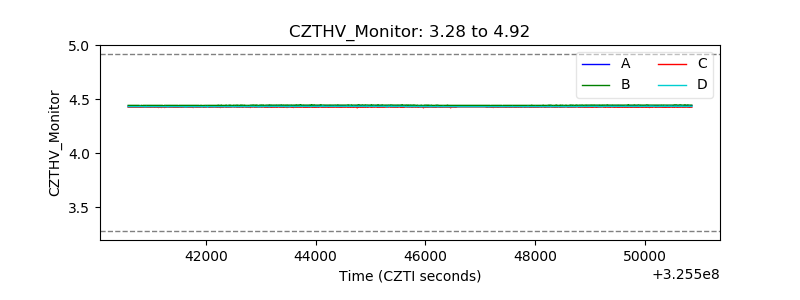 |
| D_VDD | 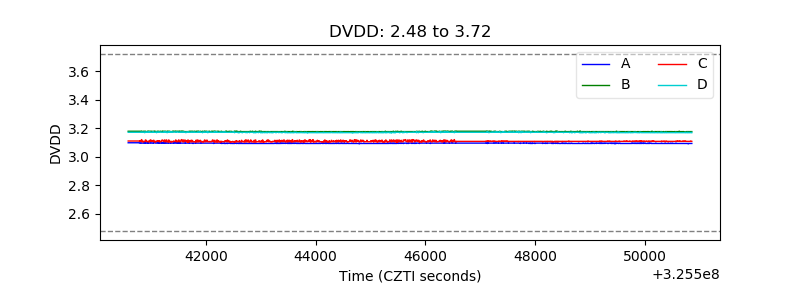 |
| Temperature 1 | 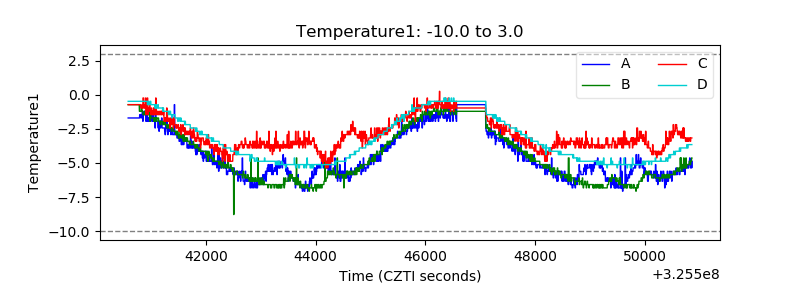 |
| Veto HV Monitor |  |
| Veto LLD | 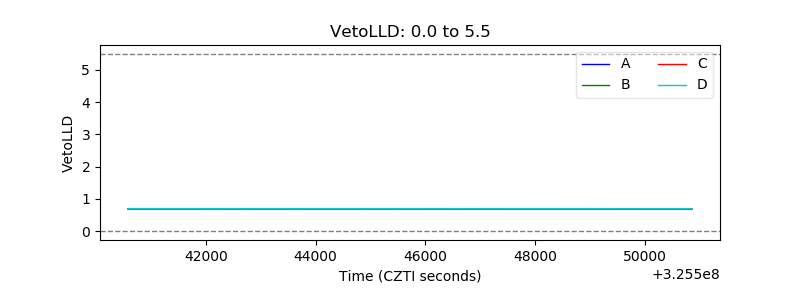 |
| Alpha Counter | 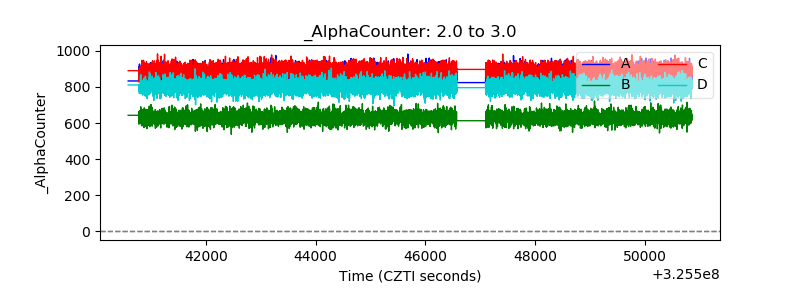 |
| _CPM_Rate | 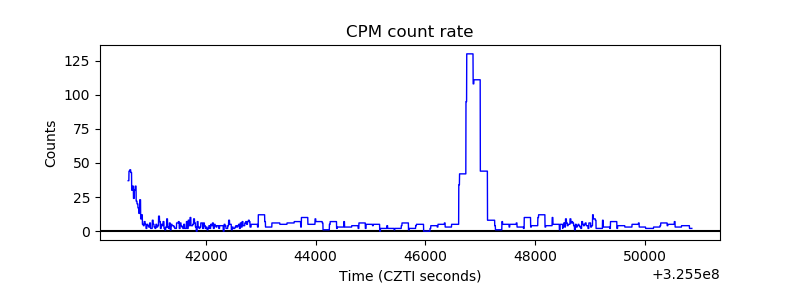 |
| CZT Counter | 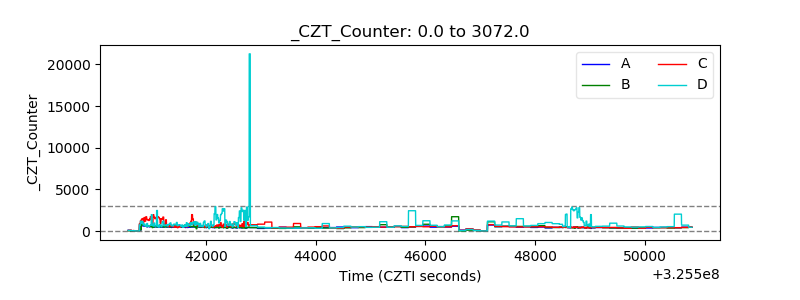 |
| +2.5 Volts monitor |  |
| +5 Volts monitor |  |
| _ROLL_ROT | 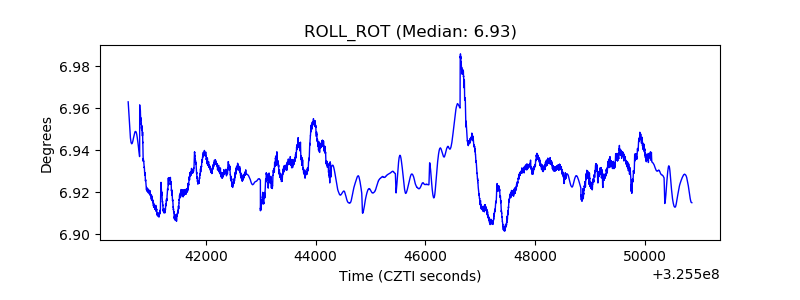 |
| _Roll_DEC | 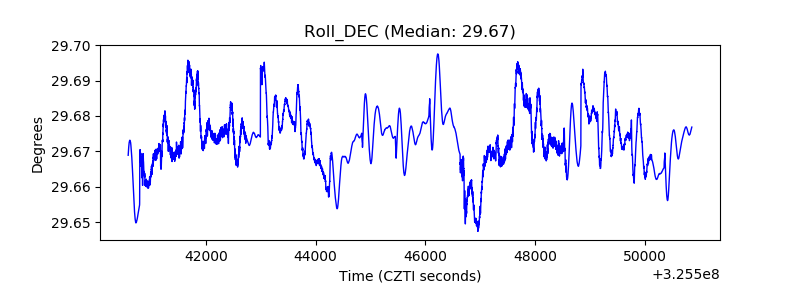 |
| _Roll_RA | 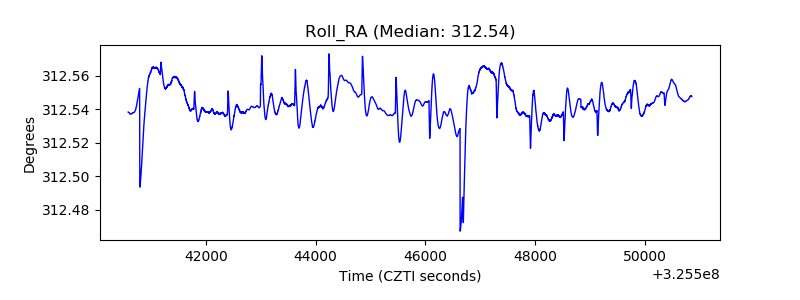 |
| Veto Counter | 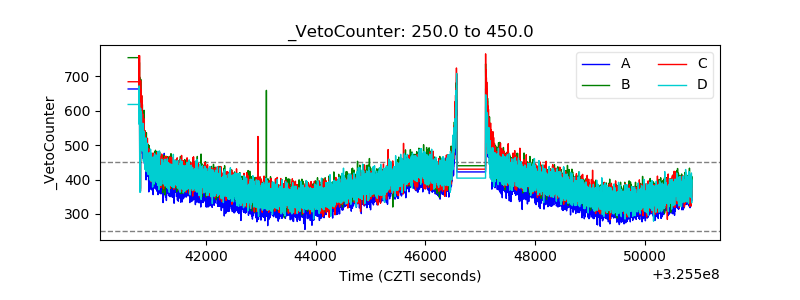 |