| Param | Original file | Final file |
|---|---|---|
| Filename | modeM0/AS1A07_018T08_9000003622_24746cztM0_level2.evt | modeM0/AS1A07_018T08_9000003622_24746cztM0_level2_quad_clean.evt |
| Size (bytes) | 704,047,680 | 119,952,000 |
| Size | 671.4 MB | 114.4 MB |
| Events in quadrant A | 4,310,554 | 767,285 |
| Events in quadrant B | 4,623,508 | 776,721 |
| Events in quadrant C | 4,629,323 | 746,966 |
| Events in quadrant D | 7,147,483 | 715,427 |
| Mode SS | |||
|---|---|---|---|
| Quadrant | BADHDUFLAG | Total packets | Discarded packets |
| A | 0 | 184 | 0 |
| B | 0 | 184 | 0 |
| C | 0 | 184 | 0 |
| D | 0 | 184 | 0 |
| Mode M0 | |||
|---|---|---|---|
| Quadrant | BADHDUFLAG | Total packets | Discarded packets |
| A | 0 | 18595 | 2 |
| B | 0 | 19560 | 2 |
| C | 0 | 19546 | 2 |
| D | 0 | 27453 | 2 |
| Mode M9 | |||
|---|---|---|---|
| Quadrant | BADHDUFLAG | Total packets | Discarded packets |
| A | 0 | 16 | 0 |
| B | 0 | 16 | 0 |
| C | 0 | 16 | 0 |
| D | 0 | 16 | 0 |
| Quadrant | Total seconds | Saturated seconds | Saturation percentage |
|---|---|---|---|
| A | 9029 | 63 | 0.697752% |
| B | 9030 | 134 | 1.483942% |
| C | 9030 | 168 | 1.860465% |
| D | 9030 | 568 | 6.290144% |
Noise dominated data is calculated using 1-second bins in cleaned event files. If a bin has >2000 counts, and if more than 50% of those come from <1% of pixels, then it is considered to be noise-dominated and hence unusable.
| Quadrant | # 1 sec bins | Bins with >0 counts | Bins with >2000 counts | High rate bins dominated by noise | Noise dominated (total time) | Noise dominated (detector-on time) | Marked lightcurve |
|---|---|---|---|---|---|---|---|
| A | 10604 | 9030 | 1 | 1 | 0.01% | 0.01% | 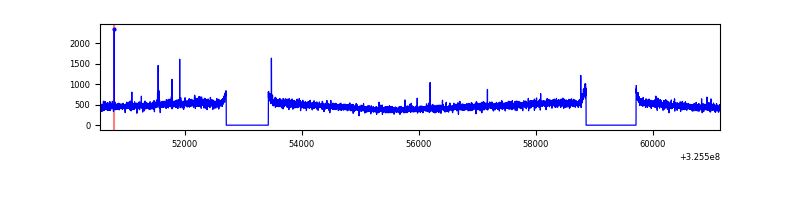 |
| B | 10604 | 9030 | 10 | 10 | 0.09% | 0.11% | 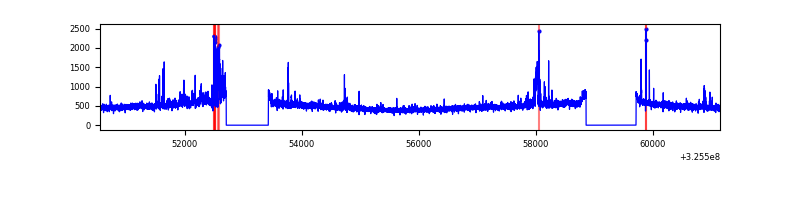 |
| C | 10604 | 9030 | 4 | 4 | 0.04% | 0.04% | 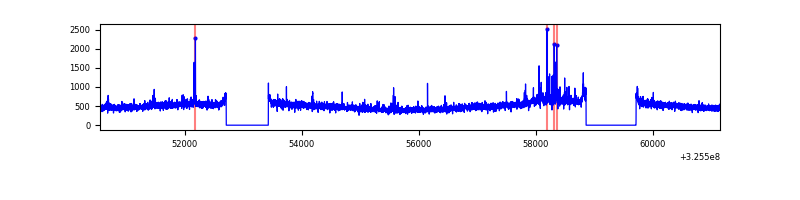 |
| D | 10605 | 9031 | 403 | 403 | 3.80% | 4.46% | 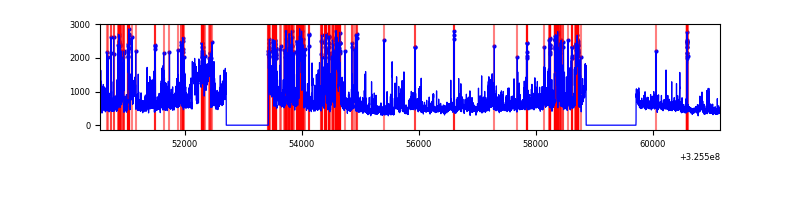 |
Top three noisy pixels from each quadrant. If the there are fewer than three noisy pixels in the level2.evt file, extra rows are filled as -1
| Pixel properties | Quadrant properties | ||||||
|---|---|---|---|---|---|---|---|
| Quadrant | DetID | PixID | Counts | Sigma | Mean | Median | Sigma |
| A | 13 | 254 | 14903 | 61.72 | 1112 | 1089 | 223.8 |
| A | 12 | 96 | 14403 | 59.49 | 1112 | 1089 | 223.8 |
| A | 3 | 137 | 10393 | 41.57 | 1112 | 1089 | 223.8 |
| B | 0 | 190 | 82439 | 386.4 | 1103 | 1076 | 210.6 |
| B | 15 | 33 | 68441 | 319.92 | 1103 | 1076 | 210.6 |
| B | 3 | 64 | 40790 | 188.6 | 1103 | 1076 | 210.6 |
| C | 14 | 238 | 170000 | 681.2 | 1060 | 1065 | 248.0 |
| C | 10 | 91 | 111829 | 446.64 | 1060 | 1065 | 248.0 |
| C | 7 | 247 | 93026 | 370.82 | 1060 | 1065 | 248.0 |
| D | 1 | 52 | 2346728 | 9096.16 | 1057 | 1024 | 257.9 |
| D | 8 | 195 | 647194 | 2505.71 | 1057 | 1024 | 257.9 |
| D | 7 | 238 | 111264 | 427.49 | 1057 | 1024 | 257.9 |
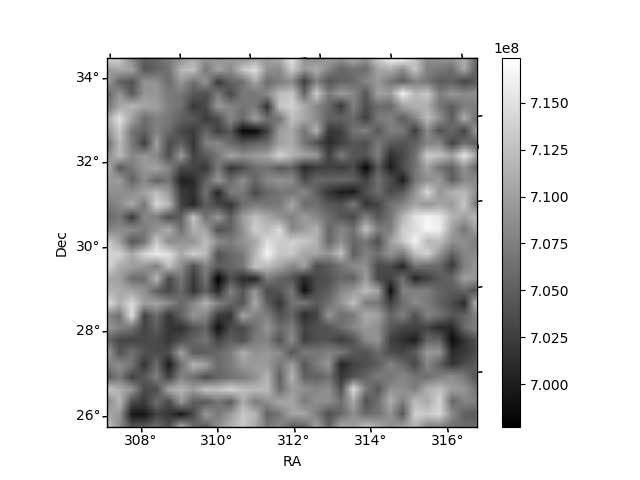
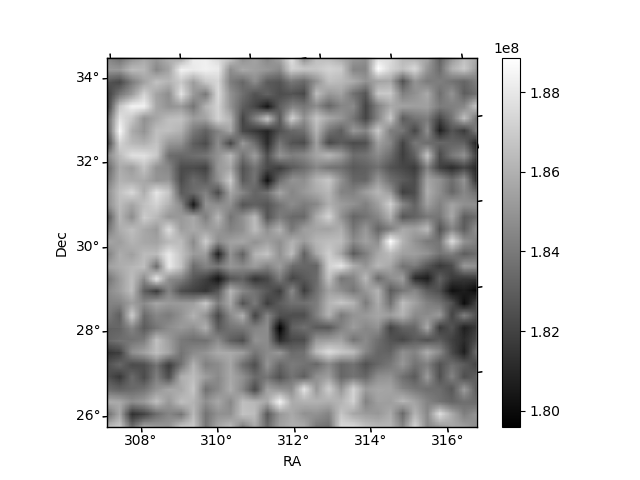
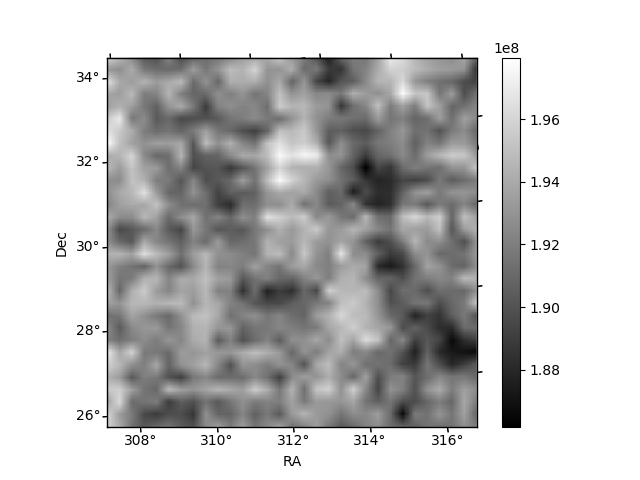
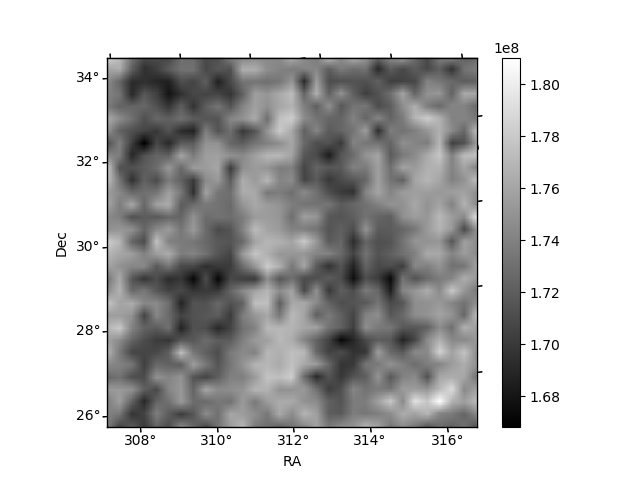
Histogram calculated using DETX and DETY for each event in the final _common_clean file
| Quadrant A | 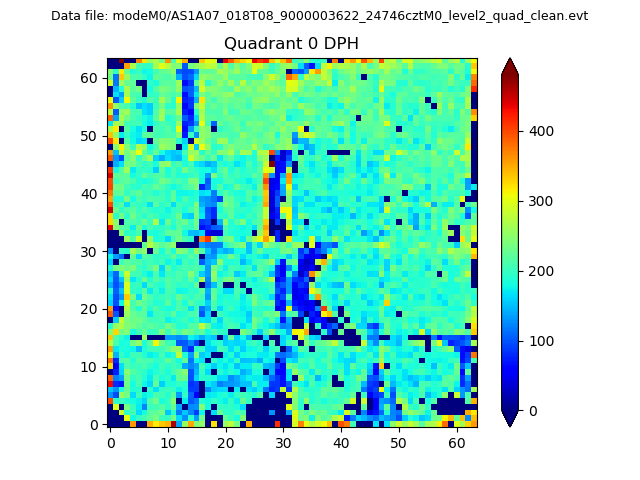 |
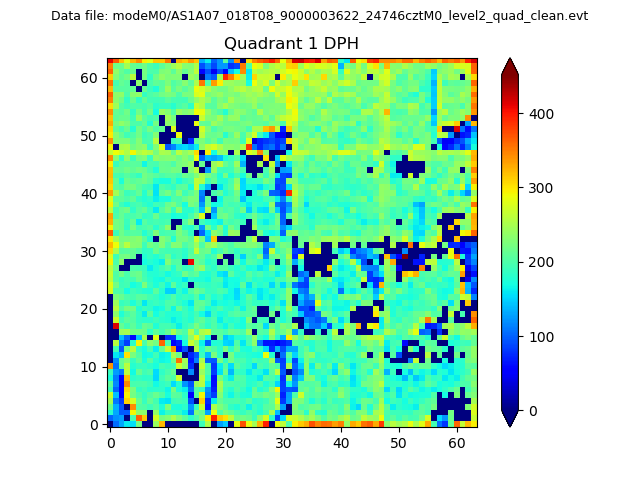 |
Quadrant B |
|---|---|---|---|
| Quadrant D | 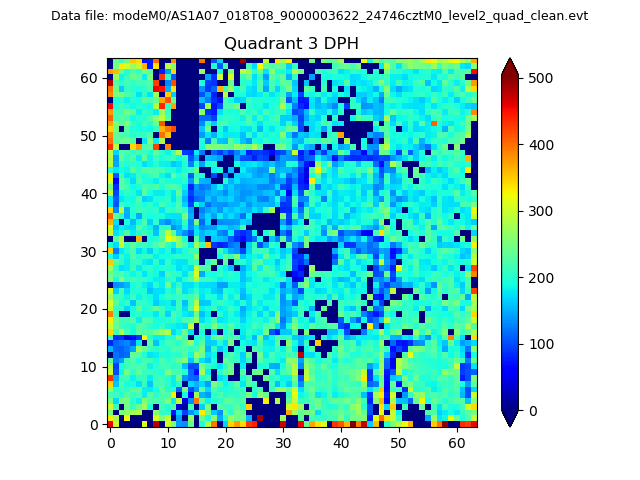 |
 |
Quadrant C |
| Plot type | Count rate plots | Images |
|---|---|---|
| Comparison with Poisson distribution Blue bars denote a histogram of data divided into 1 sec bins. Red curve is a Poisson curve with rate = median count rate of data. |
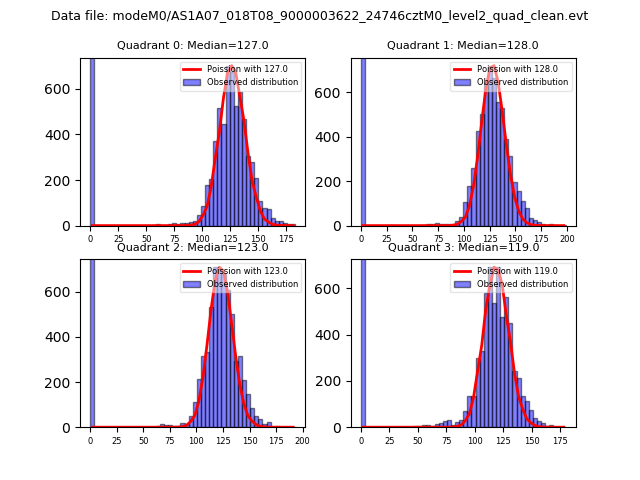 |
 |
| Quadrant-wise count rates Data is divided into 100 sec bins |
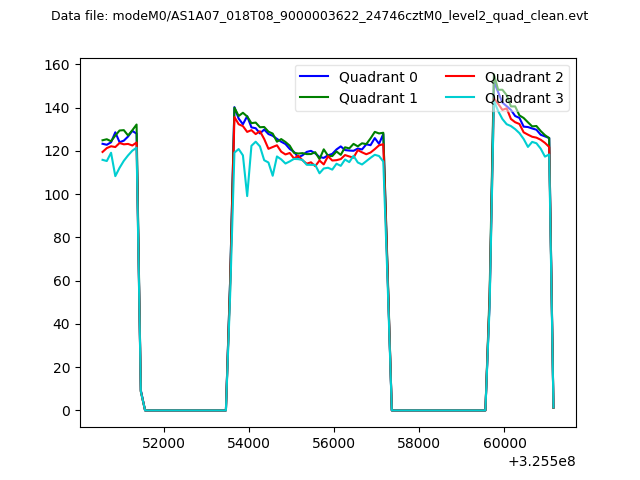 |
|
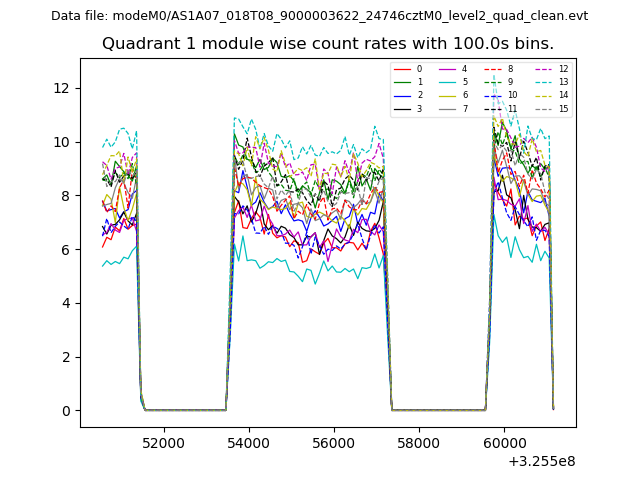
| Module-wise count rates for Quadrant A Data is divided into 100 sec bins |
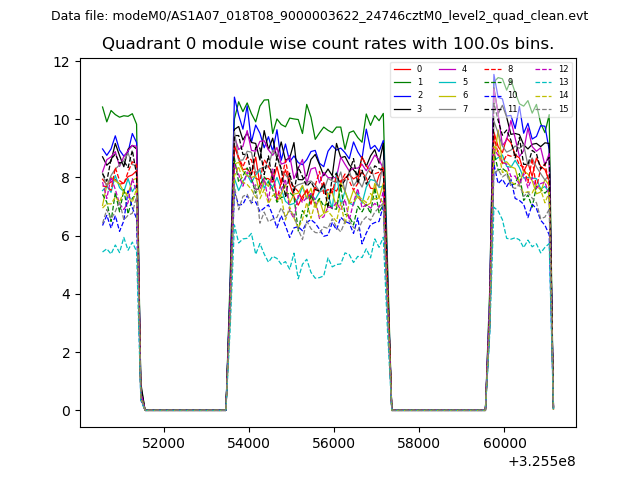 |
 |
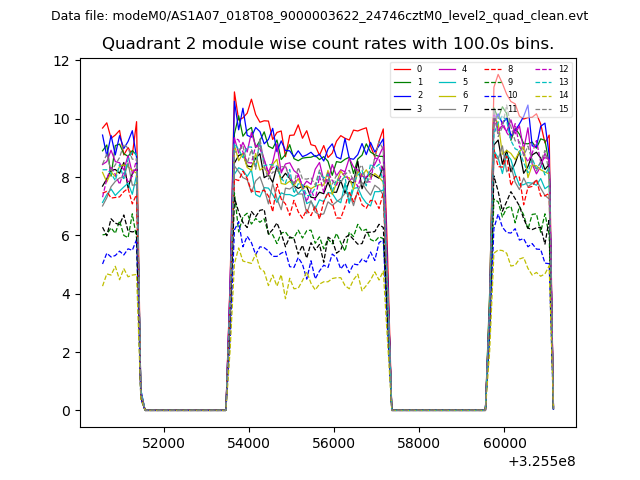
| Module-wise count rates for Quadrant B Data is divided into 100 sec bins |
 |
 |
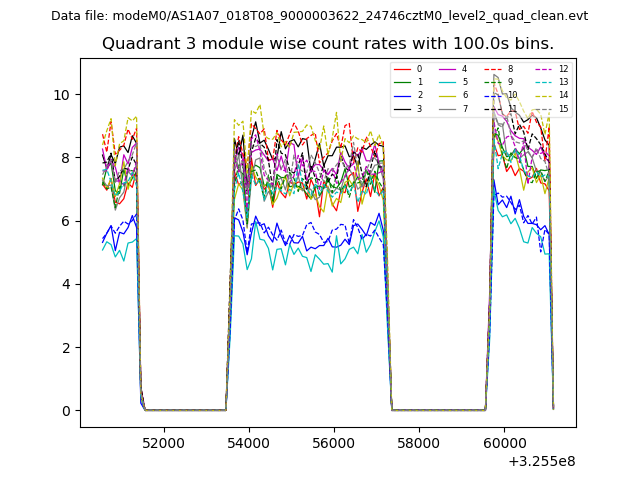
| Module-wise count rates for Quadrant C Data is divided into 100 sec bins |
 |
 |
| Module-wise count rates for Quadrant D Data is divided into 100 sec bins |
 |
 |
| Parameter | Plot |
|---|---|
| CZT HV Monitor | 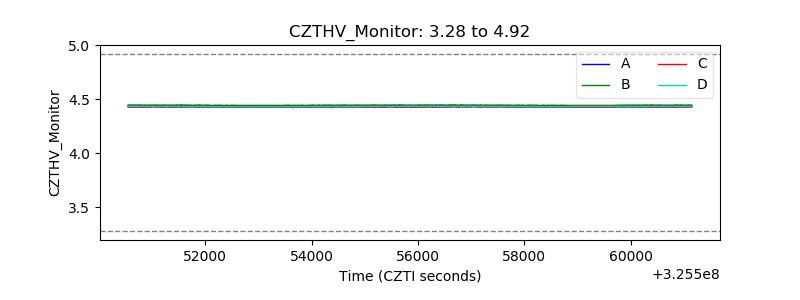 |
| D_VDD | 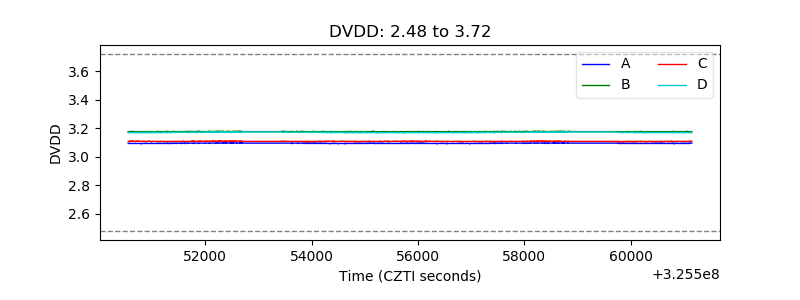 |
| Temperature 1 | 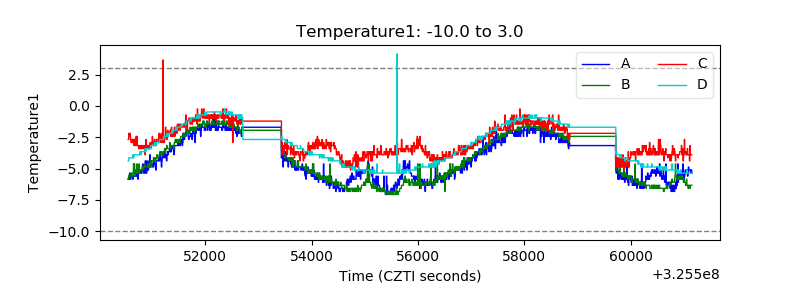 |
| Veto HV Monitor | 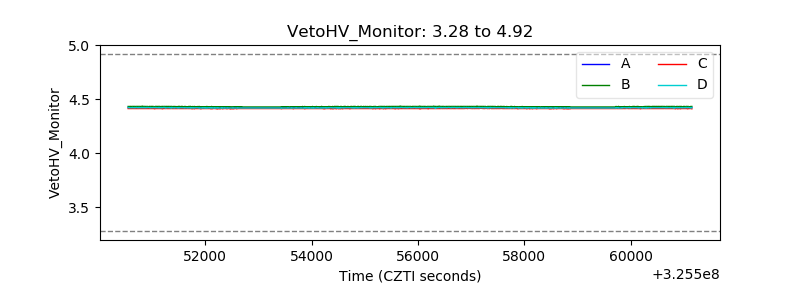 |
| Veto LLD | 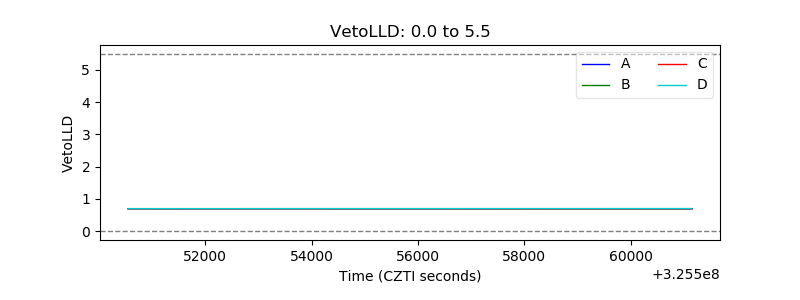 |
| Alpha Counter | 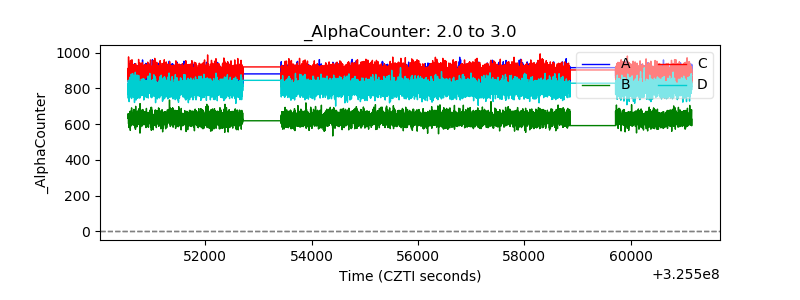 |
| _CPM_Rate | 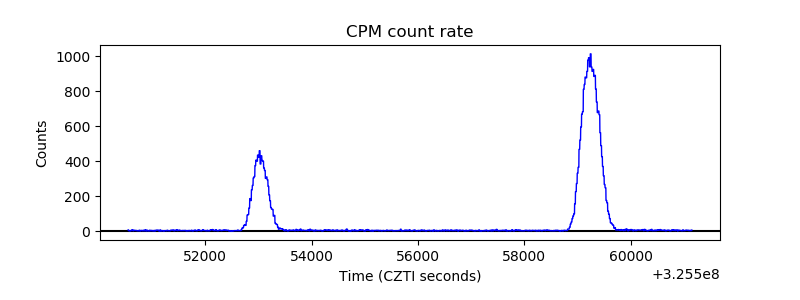 |
| CZT Counter |  |
| +2.5 Volts monitor |  |
| +5 Volts monitor |  |
| _ROLL_ROT | 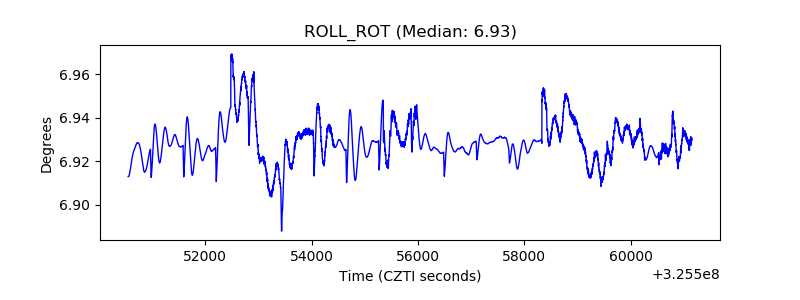 |
| _Roll_DEC | 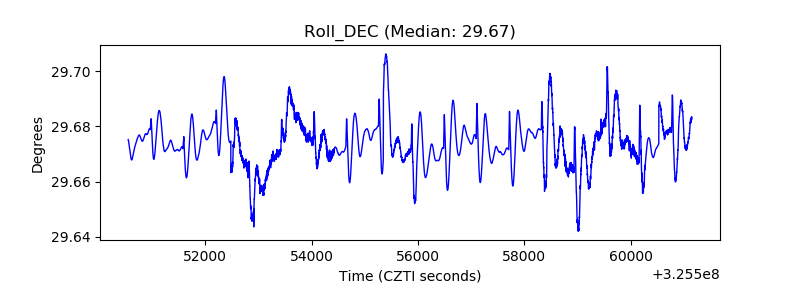 |
| _Roll_RA | 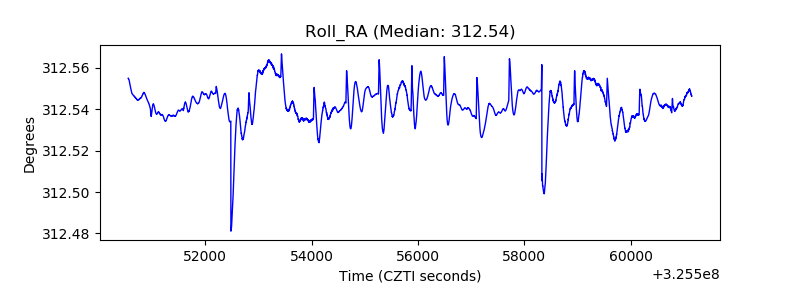 |
| Veto Counter | 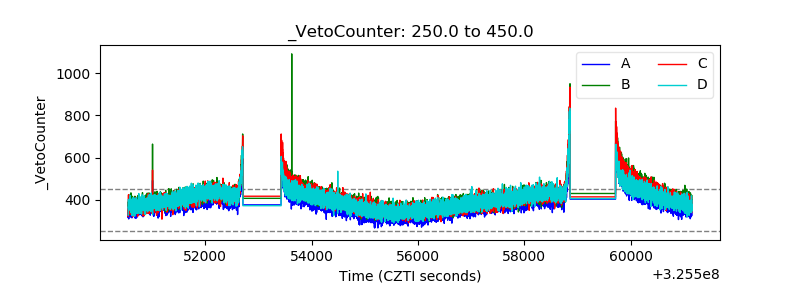 |