| Param | Original file | Final file |
|---|---|---|
| Filename | modeM0/AS1A07_018T08_9000003622_24747cztM0_level2.evt | modeM0/AS1A07_018T08_9000003622_24747cztM0_level2_quad_clean.evt |
| Size (bytes) | 451,019,520 | 95,610,240 |
| Size | 430.1 MB | 91.2 MB |
| Events in quadrant A | 3,056,259 | 619,487 |
| Events in quadrant B | 3,238,286 | 629,360 |
| Events in quadrant C | 3,306,086 | 603,272 |
| Events in quadrant D | 3,612,639 | 585,829 |
| Mode SS | |||
|---|---|---|---|
| Quadrant | BADHDUFLAG | Total packets | Discarded packets |
| A | 0 | 134 | 0 |
| B | 0 | 134 | 0 |
| C | 0 | 134 | 0 |
| D | 0 | 134 | 0 |
| Mode M0 | |||
|---|---|---|---|
| Quadrant | BADHDUFLAG | Total packets | Discarded packets |
| A | 0 | 13396 | 1 |
| B | 0 | 13806 | 1 |
| C | 0 | 14144 | 1 |
| D | 0 | 15249 | 1 |
| Mode M9 | |||
|---|---|---|---|
| Quadrant | BADHDUFLAG | Total packets | Discarded packets |
| A | 0 | 10 | 0 |
| B | 0 | 10 | 0 |
| C | 0 | 10 | 0 |
| D | 0 | 10 | 0 |
| Quadrant | Total seconds | Saturated seconds | Saturation percentage |
|---|---|---|---|
| A | 6558 | 22 | 0.335468% |
| B | 6558 | 45 | 0.686185% |
| C | 6558 | 73 | 1.113144% |
| D | 6558 | 56 | 0.853919% |
Noise dominated data is calculated using 1-second bins in cleaned event files. If a bin has >2000 counts, and if more than 50% of those come from <1% of pixels, then it is considered to be noise-dominated and hence unusable.
| Quadrant | # 1 sec bins | Bins with >0 counts | Bins with >2000 counts | High rate bins dominated by noise | Noise dominated (total time) | Noise dominated (detector-on time) | Marked lightcurve |
|---|---|---|---|---|---|---|---|
| A | 7578 | 6559 | 0 | 0 | 0.00% | 0.00% | 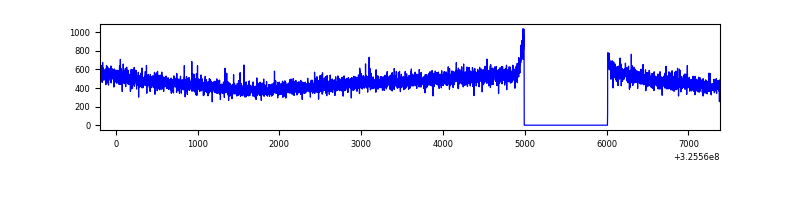 |
| B | 7578 | 6559 | 5 | 5 | 0.07% | 0.08% | 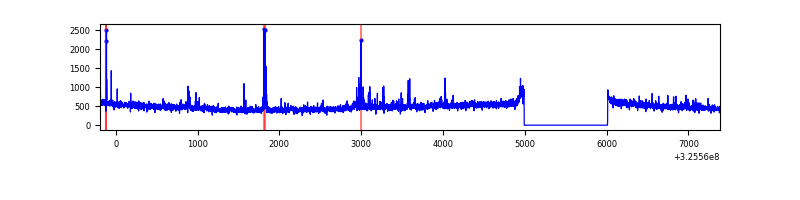 |
| C | 7578 | 6559 | 0 | 0 | 0.00% | 0.00% |  |
| D | 7578 | 6559 | 36 | 36 | 0.48% | 0.55% | 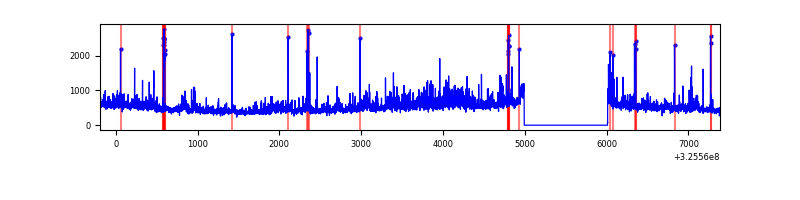 |
Top three noisy pixels from each quadrant. If the there are fewer than three noisy pixels in the level2.evt file, extra rows are filled as -1
| Pixel properties | Quadrant properties | ||||||
|---|---|---|---|---|---|---|---|
| Quadrant | DetID | PixID | Counts | Sigma | Mean | Median | Sigma |
| A | 13 | 254 | 11959 | 69.73 | 792 | 777 | 160.4 |
| A | 3 | 137 | 7171 | 39.87 | 792 | 777 | 160.4 |
| A | 0 | 226 | 6717 | 37.04 | 792 | 777 | 160.4 |
| B | 0 | 189 | 54594 | 357.45 | 793 | 772 | 150.6 |
| B | 4 | 173 | 23940 | 153.87 | 793 | 772 | 150.6 |
| B | 12 | 111 | 18929 | 120.59 | 793 | 772 | 150.6 |
| C | 10 | 91 | 182023 | 1016.08 | 762 | 764 | 178.4 |
| C | 14 | 238 | 120223 | 669.65 | 762 | 764 | 178.4 |
| C | 1 | 90 | 20581 | 111.09 | 762 | 764 | 178.4 |
| D | 1 | 52 | 358948 | 1934.21 | 764 | 744 | 185.2 |
| D | 8 | 195 | 331416 | 1785.54 | 764 | 744 | 185.2 |
| D | 2 | 234 | 27162 | 142.65 | 764 | 744 | 185.2 |
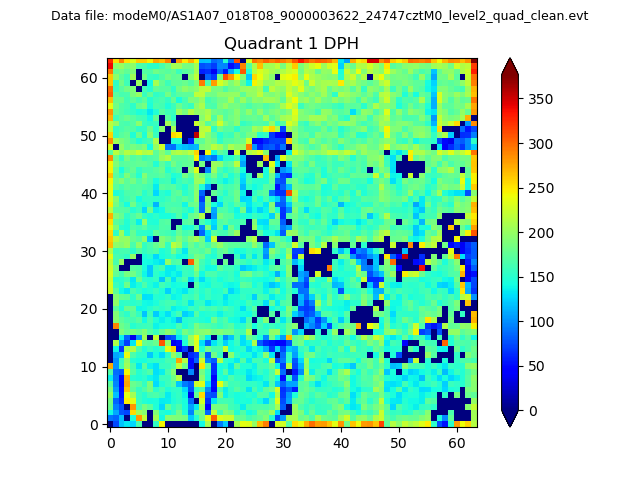
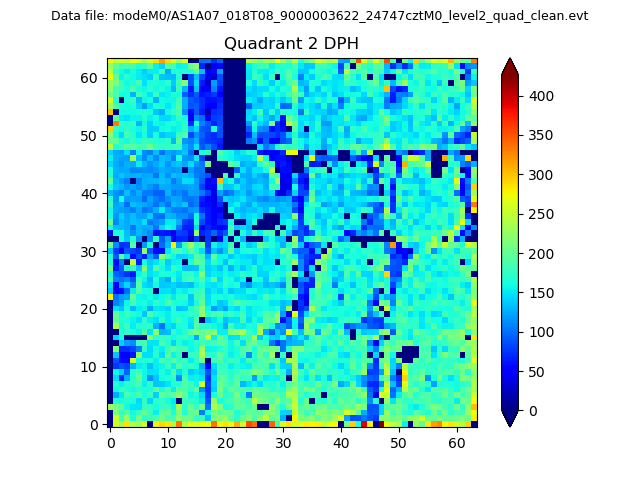
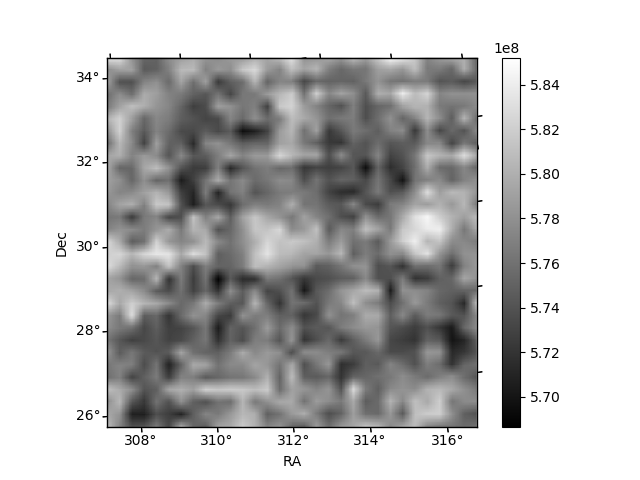
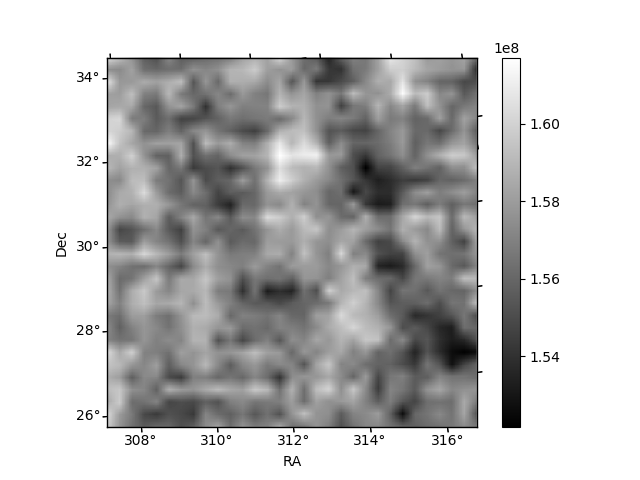
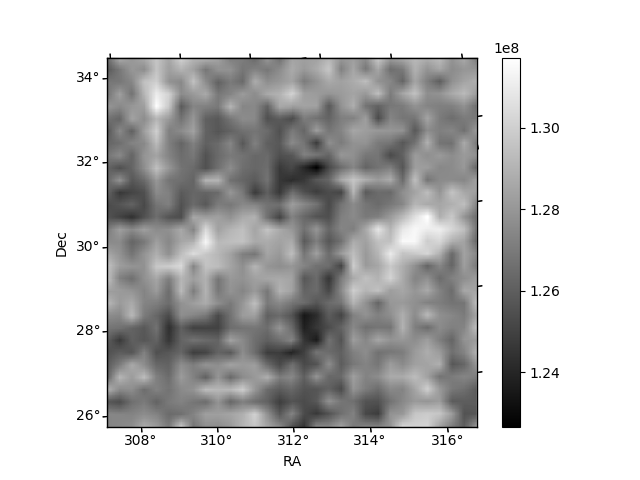
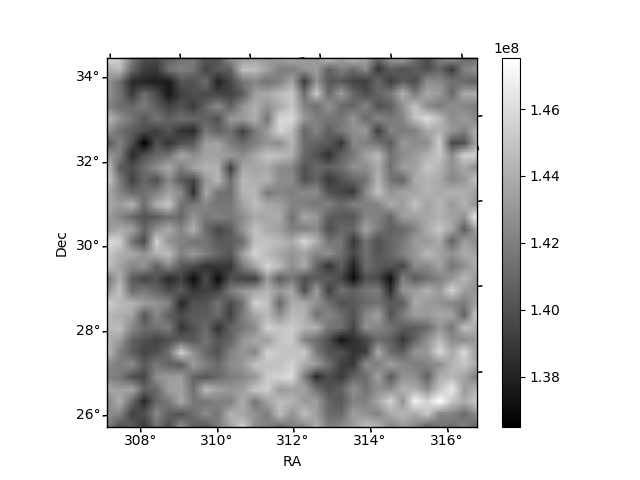
Histogram calculated using DETX and DETY for each event in the final _common_clean file
| Quadrant A | 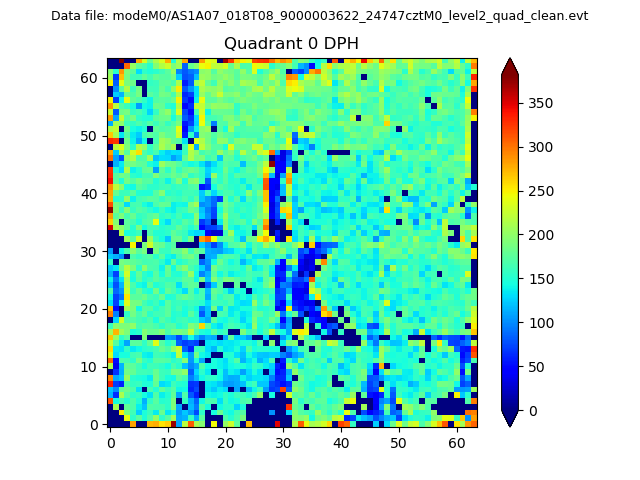 |
 |
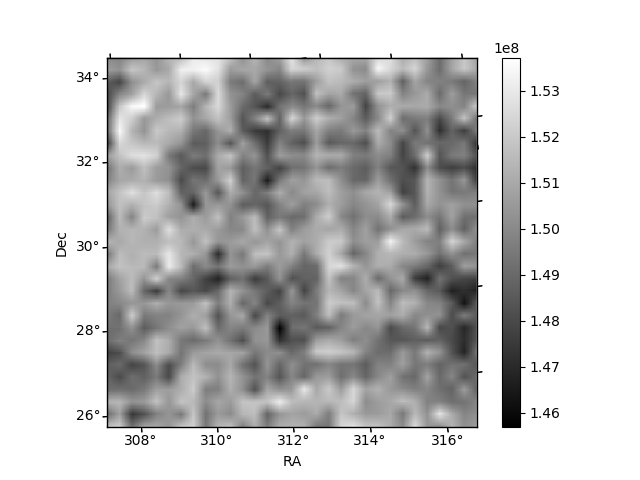
Quadrant B |
|---|---|---|---|
| Quadrant D | 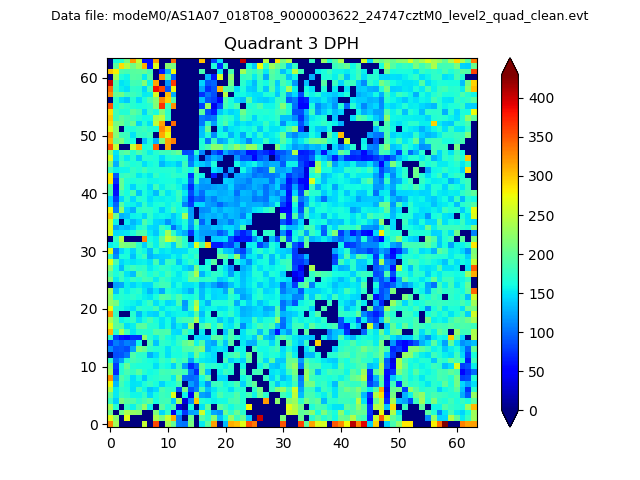 |
 |
Quadrant C |
| Plot type | Count rate plots | Images |
|---|---|---|
| Comparison with Poisson distribution Blue bars denote a histogram of data divided into 1 sec bins. Red curve is a Poisson curve with rate = median count rate of data. |
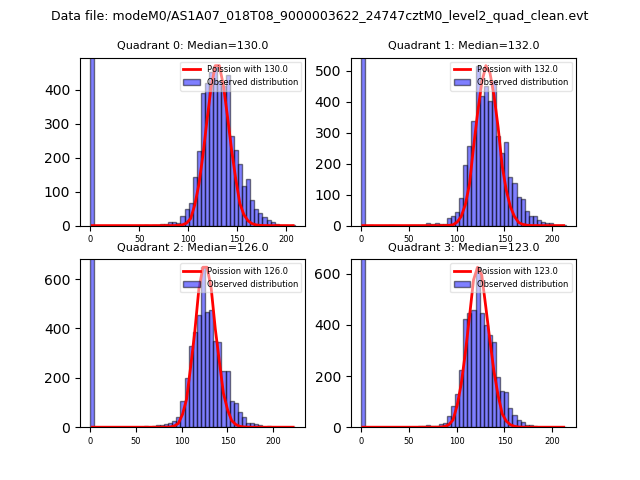 |
 |
| Quadrant-wise count rates Data is divided into 100 sec bins |
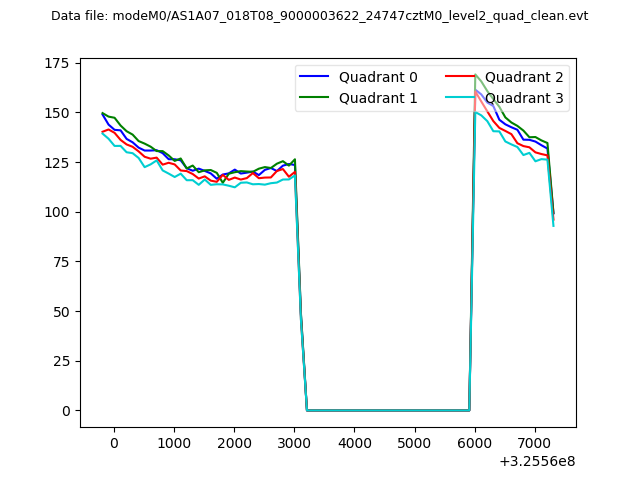 |
|
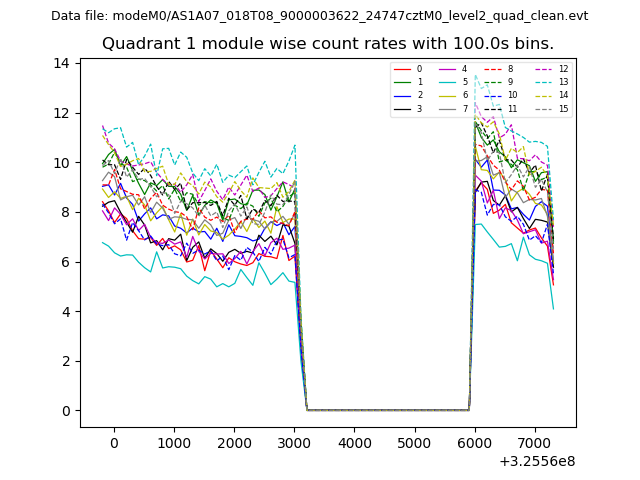
| Module-wise count rates for Quadrant A Data is divided into 100 sec bins |
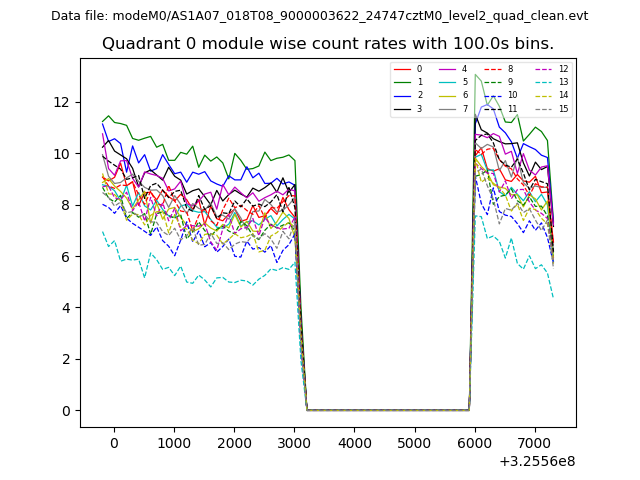 |
 |
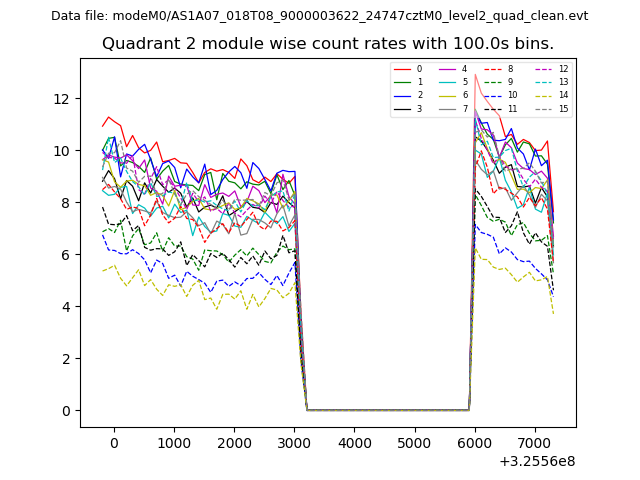
| Module-wise count rates for Quadrant B Data is divided into 100 sec bins |
 |
 |
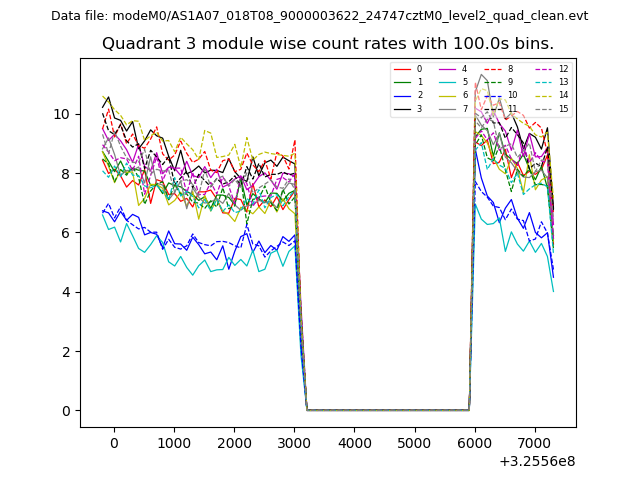
| Module-wise count rates for Quadrant C Data is divided into 100 sec bins |
 |
 |
| Module-wise count rates for Quadrant D Data is divided into 100 sec bins |
 |
 |
| Parameter | Plot |
|---|---|
| CZT HV Monitor | 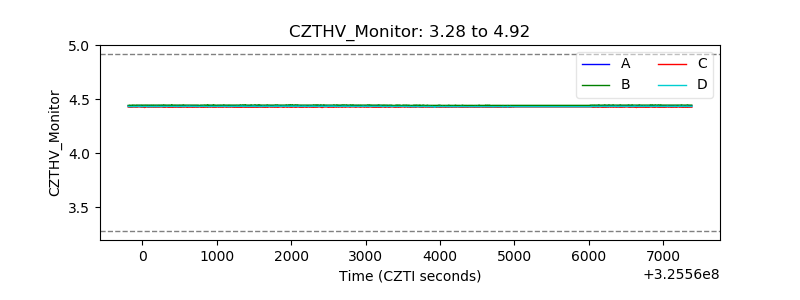 |
| D_VDD | 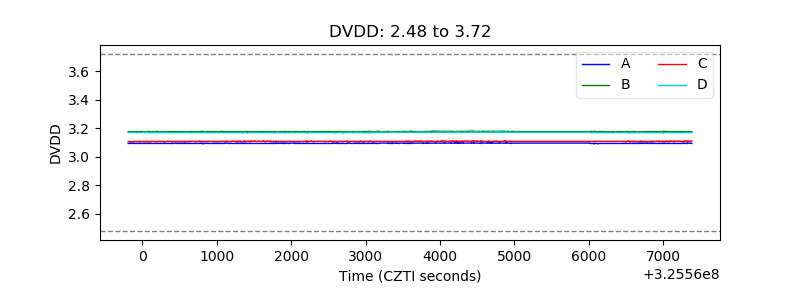 |
| Temperature 1 | 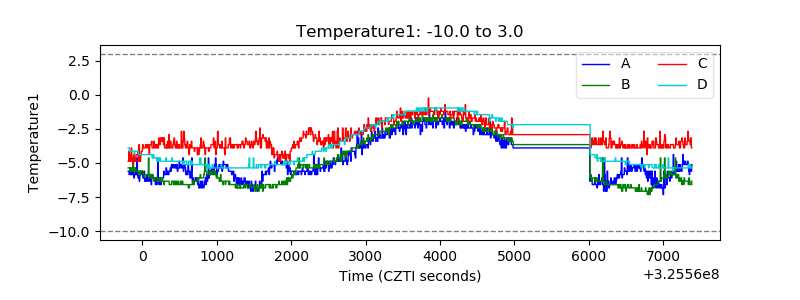 |
| Veto HV Monitor | 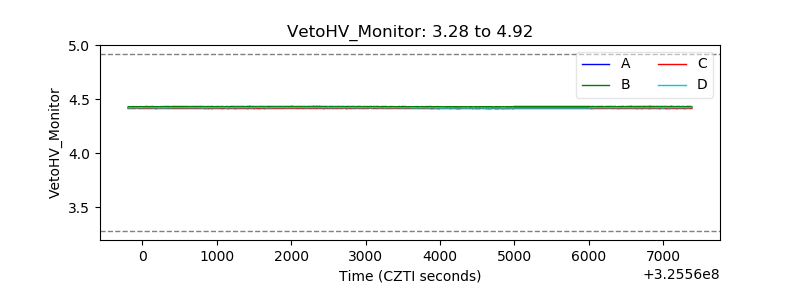 |
| Veto LLD |  |
| Alpha Counter | 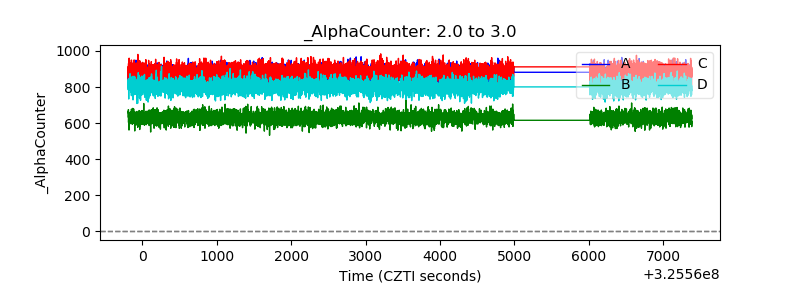 |
| _CPM_Rate | 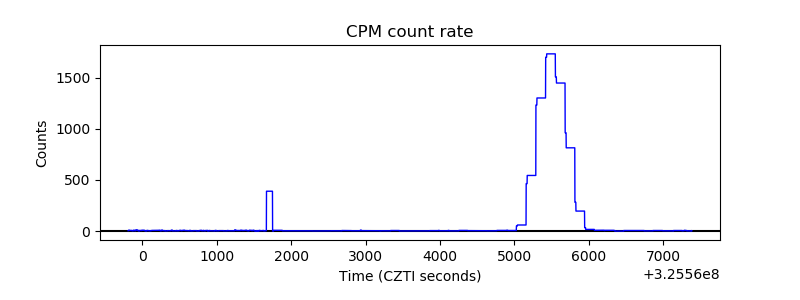 |
| CZT Counter | 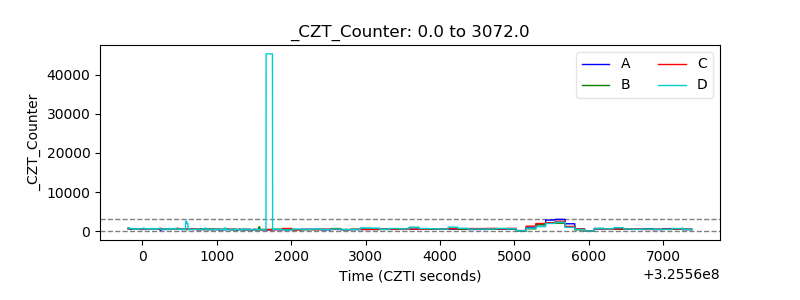 |
| +2.5 Volts monitor |  |
| +5 Volts monitor |  |
| _ROLL_ROT | 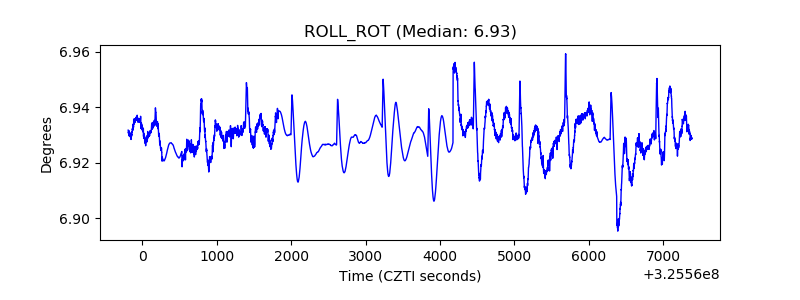 |
| _Roll_DEC | 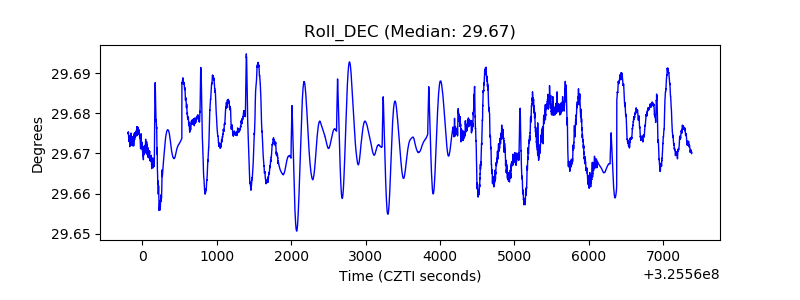 |
| _Roll_RA | 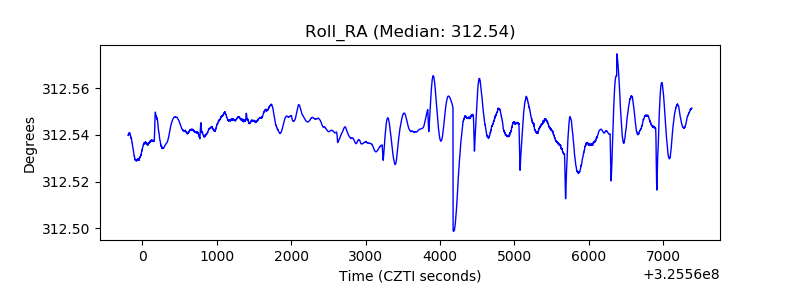 |
| Veto Counter | 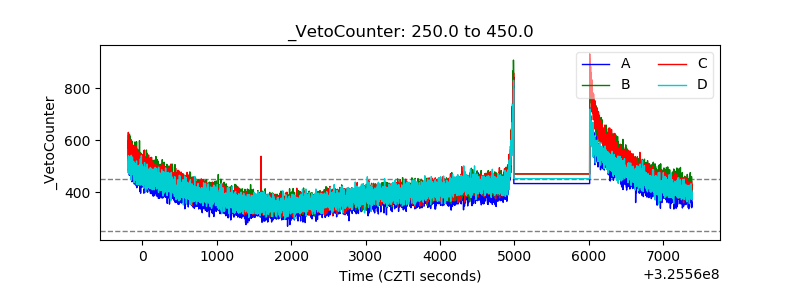 |