| Param | Original file | Final file |
|---|---|---|
| Filename | modeM0/AS1A07_018T08_9000003622_24750cztM0_level2.evt | modeM0/AS1A07_018T08_9000003622_24750cztM0_level2_quad_clean.evt |
| Size (bytes) | 1,137,640,320 | 207,973,440 |
| Size | 1.1 GB | 198.3 MB |
| Events in quadrant A | 7,537,782 | 1,333,180 |
| Events in quadrant B | 7,921,165 | 1,354,927 |
| Events in quadrant C | 8,241,584 | 1,282,794 |
| Events in quadrant D | 9,692,605 | 1,245,685 |
| Mode SS | |||
|---|---|---|---|
| Quadrant | BADHDUFLAG | Total packets | Discarded packets |
| A | 0 | 322 | 0 |
| B | 0 | 322 | 0 |
| C | 0 | 322 | 0 |
| D | 0 | 322 | 0 |
| Mode M0 | |||
|---|---|---|---|
| Quadrant | BADHDUFLAG | Total packets | Discarded packets |
| A | 0 | 32315 | 3 |
| B | 0 | 33355 | 3 |
| C | 0 | 34522 | 3 |
| D | 0 | 39451 | 3 |
| Mode M9 | |||
|---|---|---|---|
| Quadrant | BADHDUFLAG | Total packets | Discarded packets |
| A | 0 | 33 | 0 |
| B | 0 | 33 | 0 |
| C | 0 | 33 | 0 |
| D | 0 | 33 | 0 |
| Quadrant | Total seconds | Saturated seconds | Saturation percentage |
|---|---|---|---|
| A | 15684 | 47 | 0.299668% |
| B | 15685 | 114 | 0.726809% |
| C | 15684 | 179 | 1.141290% |
| D | 15684 | 223 | 1.421831% |
Noise dominated data is calculated using 1-second bins in cleaned event files. If a bin has >2000 counts, and if more than 50% of those come from <1% of pixels, then it is considered to be noise-dominated and hence unusable.
| Quadrant | # 1 sec bins | Bins with >0 counts | Bins with >2000 counts | High rate bins dominated by noise | Noise dominated (total time) | Noise dominated (detector-on time) | Marked lightcurve |
|---|---|---|---|---|---|---|---|
| A | 19089 | 15687 | 1 | 1 | 0.01% | 0.01% | 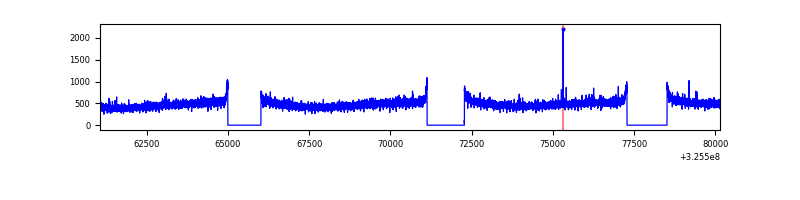 |
| B | 19090 | 15688 | 4 | 4 | 0.02% | 0.03% | 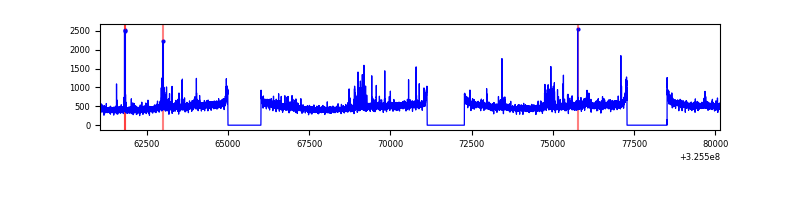 |
| C | 19089 | 15687 | 1 | 1 | 0.01% | 0.01% | 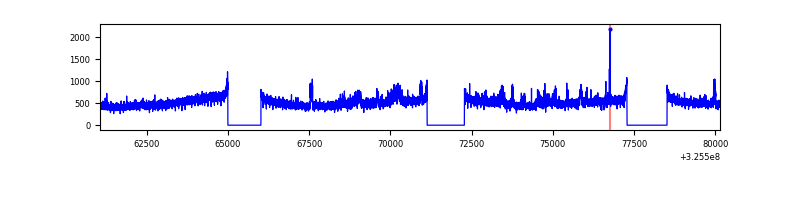 |
| D | 19089 | 15687 | 130 | 130 | 0.68% | 0.83% | 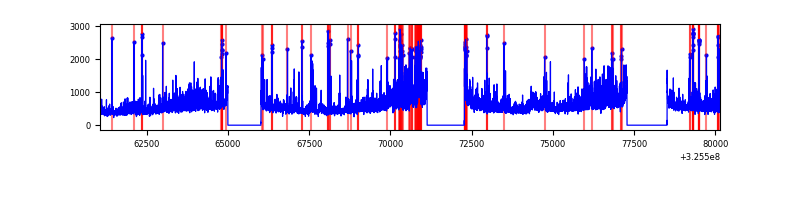 |
Top three noisy pixels from each quadrant. If the there are fewer than three noisy pixels in the level2.evt file, extra rows are filled as -1
| Pixel properties | Quadrant properties | ||||||
|---|---|---|---|---|---|---|---|
| Quadrant | DetID | PixID | Counts | Sigma | Mean | Median | Sigma |
| A | 13 | 254 | 26940 | 64.56 | 1951 | 1915 | 387.6 |
| A | 3 | 137 | 16926 | 38.73 | 1951 | 1915 | 387.6 |
| A | 0 | 226 | 16926 | 38.73 | 1951 | 1915 | 387.6 |
| B | 0 | 189 | 154502 | 422.05 | 1936 | 1893 | 361.6 |
| B | 0 | 190 | 59391 | 159.01 | 1936 | 1893 | 361.6 |
| B | 12 | 111 | 44283 | 117.23 | 1936 | 1893 | 361.6 |
| C | 7 | 247 | 442659 | 1034.16 | 1850 | 1862 | 426.2 |
| C | 14 | 238 | 298431 | 695.79 | 1850 | 1862 | 426.2 |
| C | 10 | 91 | 201588 | 468.58 | 1850 | 1862 | 426.2 |
| D | 1 | 52 | 1307823 | 2915.17 | 1867 | 1817 | 448.0 |
| D | 8 | 195 | 1185660 | 2642.48 | 1867 | 1817 | 448.0 |
| D | 7 | 238 | 98926 | 216.76 | 1867 | 1817 | 448.0 |
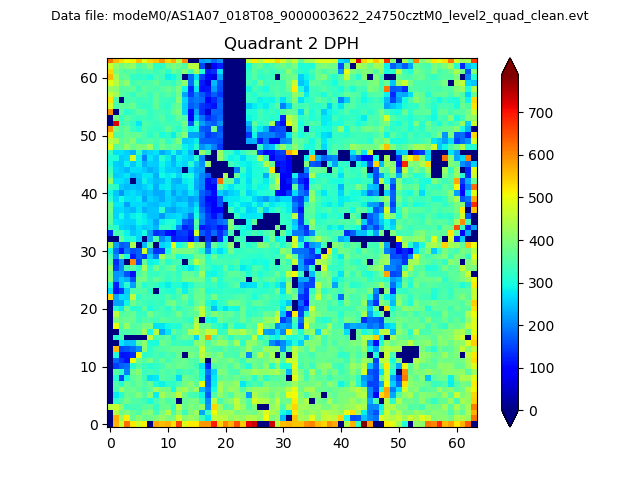
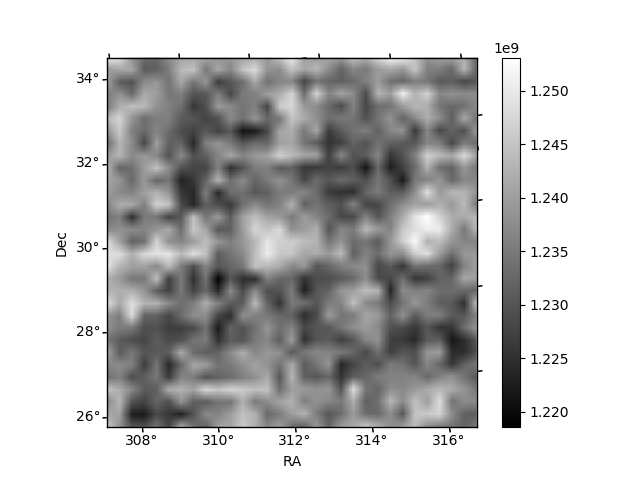
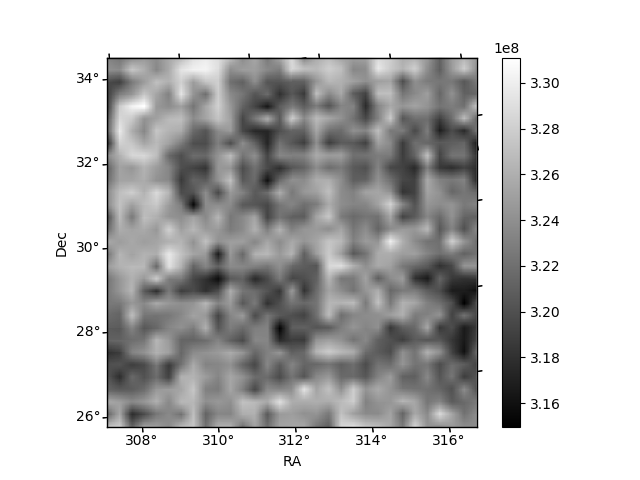
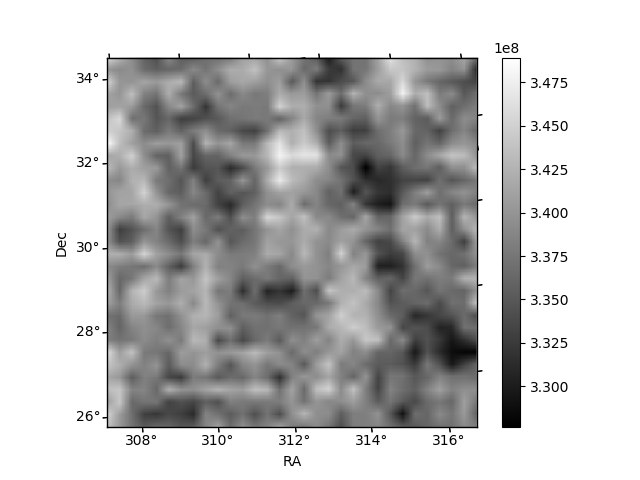
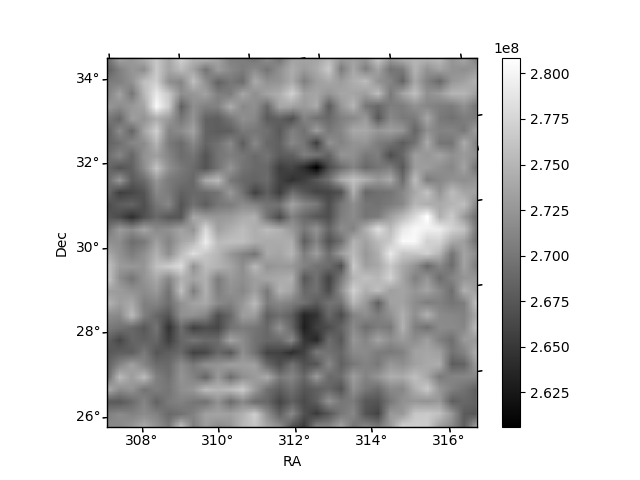
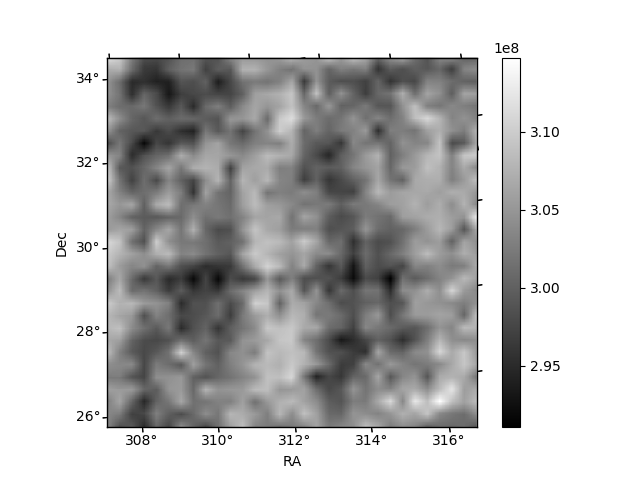
Histogram calculated using DETX and DETY for each event in the final _common_clean file
| Quadrant A | 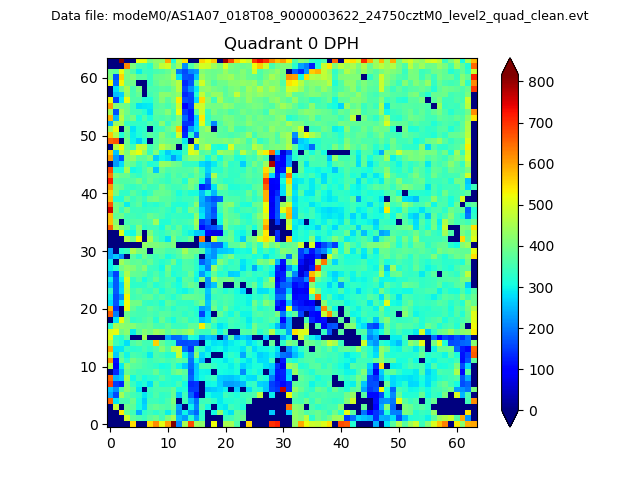 |
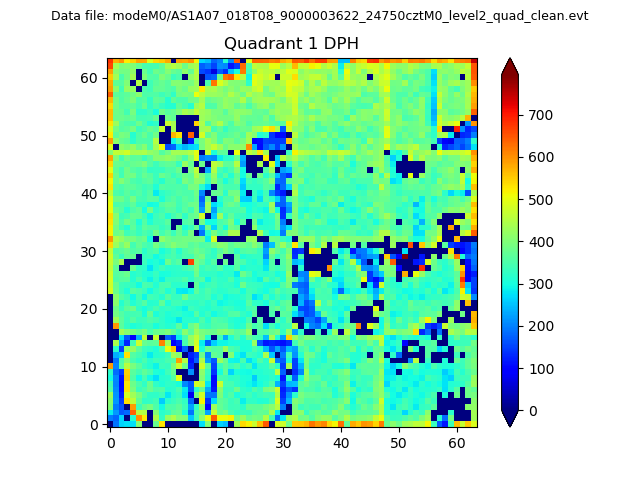 |
Quadrant B |
|---|---|---|---|
| Quadrant D | 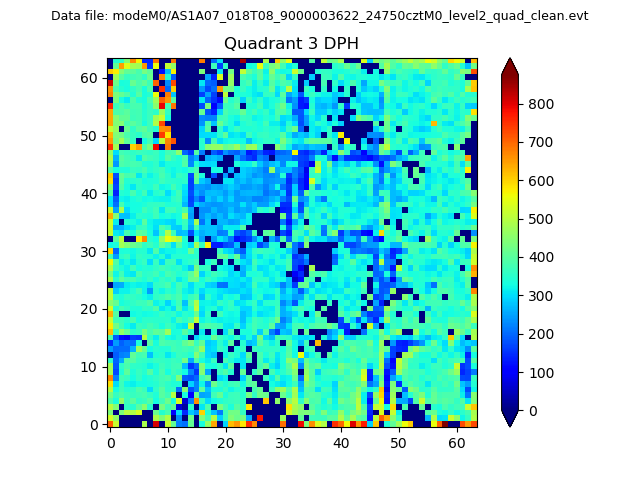 |
 |
Quadrant C |
| Plot type | Count rate plots | Images |
|---|---|---|
| Comparison with Poisson distribution Blue bars denote a histogram of data divided into 1 sec bins. Red curve is a Poisson curve with rate = median count rate of data. |
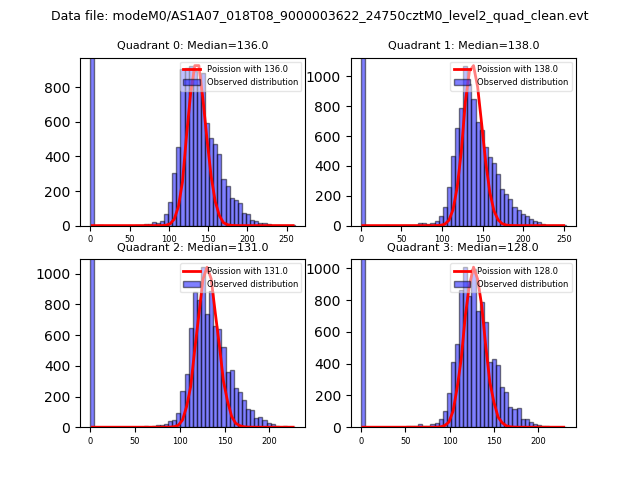 |
 |
| Quadrant-wise count rates Data is divided into 100 sec bins |
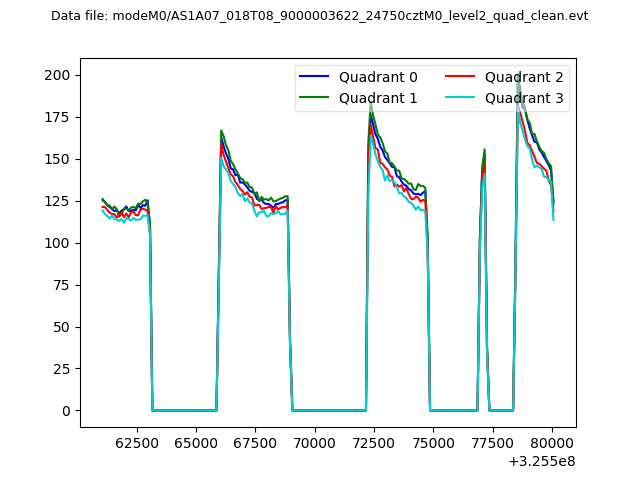 |
|
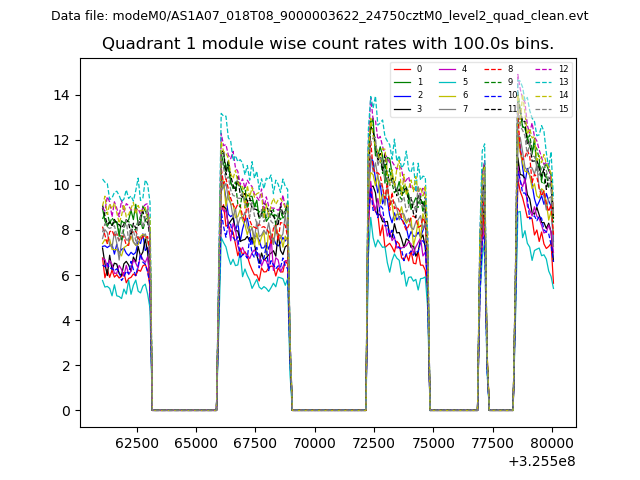
| Module-wise count rates for Quadrant A Data is divided into 100 sec bins |
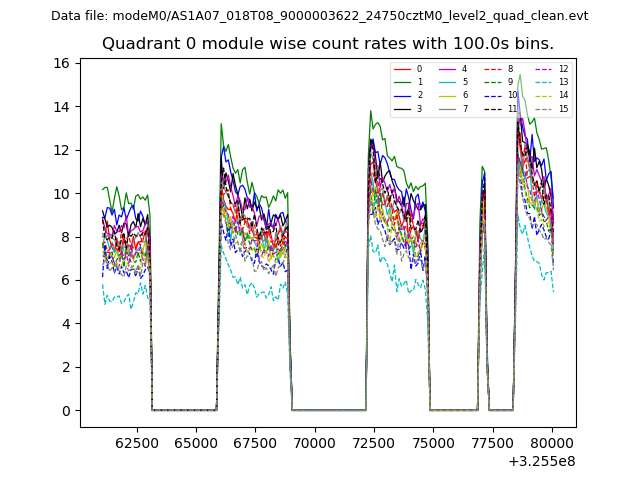 |
 |
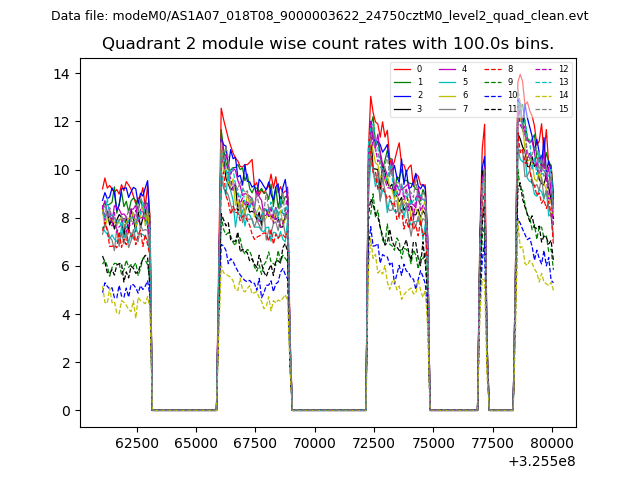
| Module-wise count rates for Quadrant B Data is divided into 100 sec bins |
 |
 |
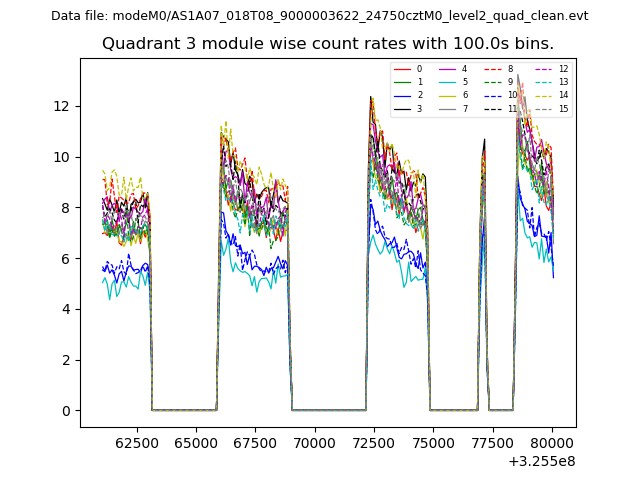
| Module-wise count rates for Quadrant C Data is divided into 100 sec bins |
 |
 |
| Module-wise count rates for Quadrant D Data is divided into 100 sec bins |
 |
 |
| Parameter | Plot |
|---|---|
| CZT HV Monitor | 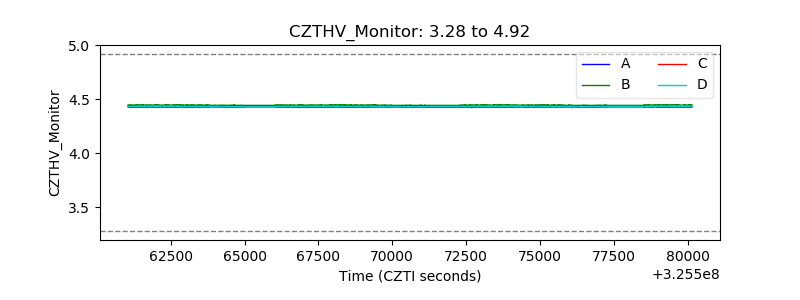 |
| D_VDD | 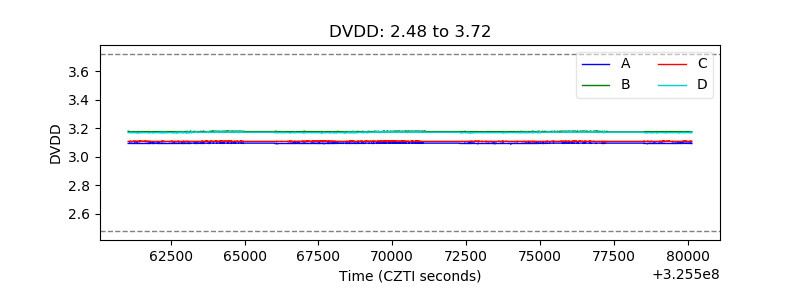 |
| Temperature 1 | 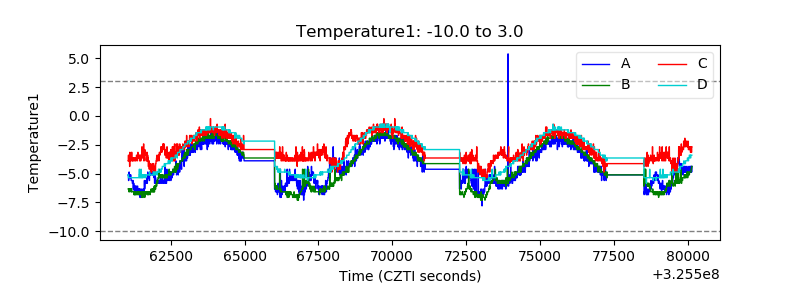 |
| Veto HV Monitor | 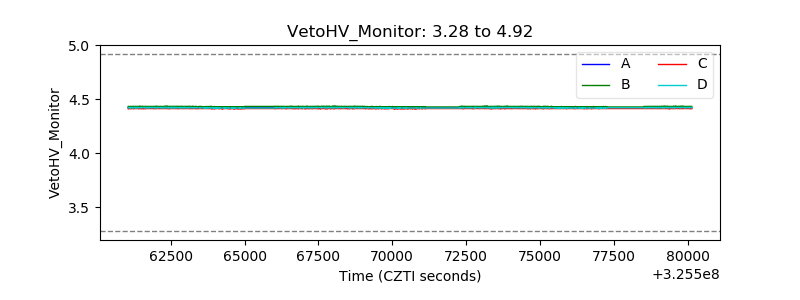 |
| Veto LLD | 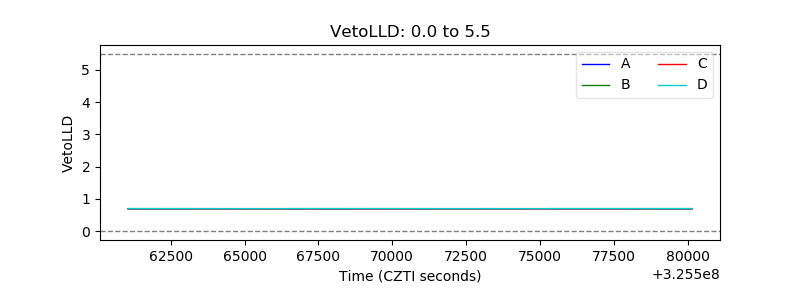 |
| Alpha Counter | 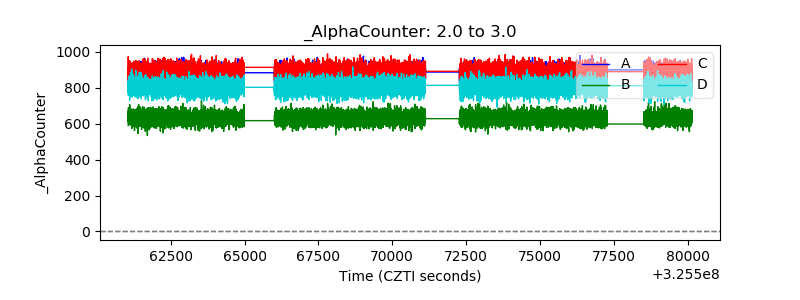 |
| _CPM_Rate | 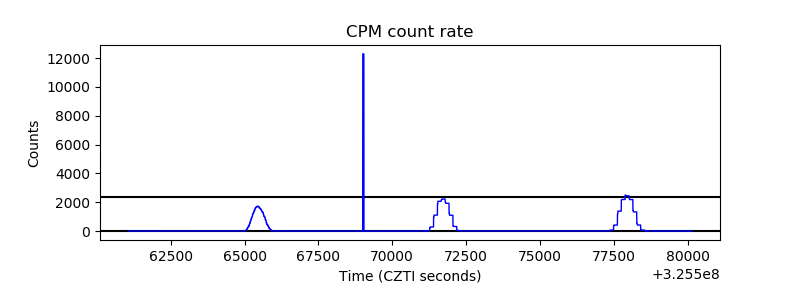 |
| CZT Counter | 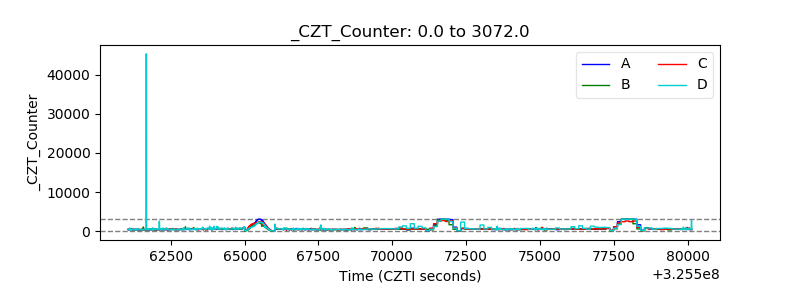 |
| +2.5 Volts monitor | 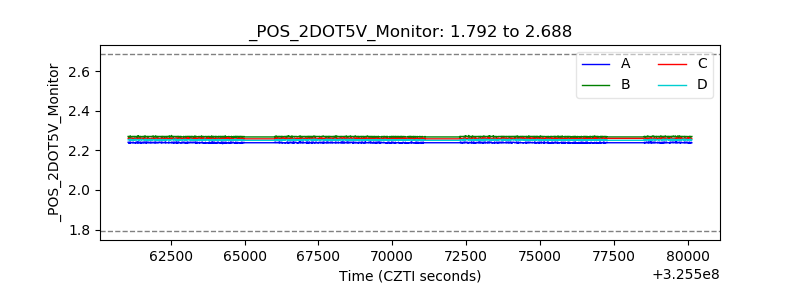 |
| +5 Volts monitor | 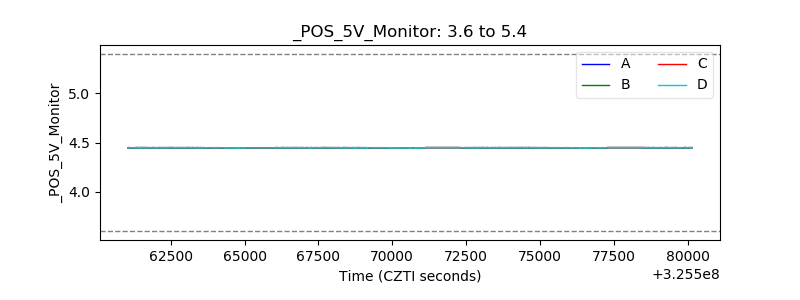 |
| _ROLL_ROT | 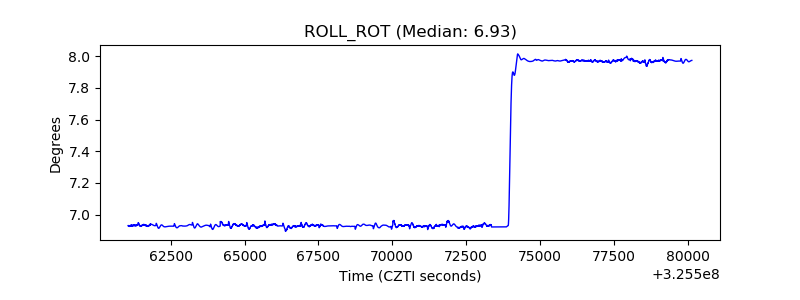 |
| _Roll_DEC | 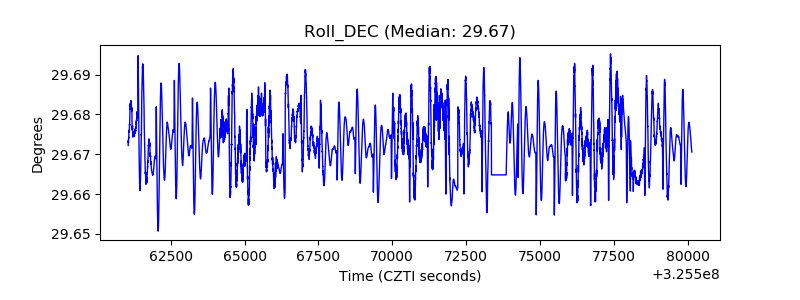 |
| _Roll_RA | 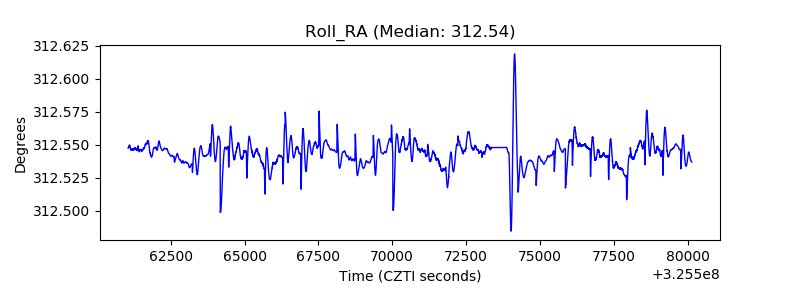 |
| Veto Counter | 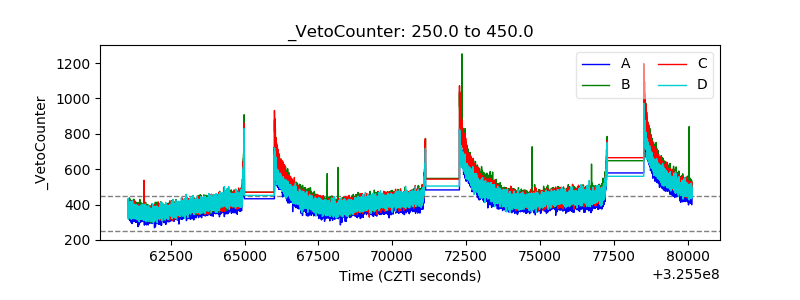 |