| Param | Original file | Final file |
|---|---|---|
| Filename | modeM0/AS1A07_018T08_9000003622_24751cztM0_level2.evt | modeM0/AS1A07_018T08_9000003622_24751cztM0_level2_quad_clean.evt |
| Size (bytes) | 434,295,360 | 81,043,200 |
| Size | 414.2 MB | 77.3 MB |
| Events in quadrant A | 2,858,186 | 531,687 |
| Events in quadrant B | 2,965,043 | 536,796 |
| Events in quadrant C | 3,101,595 | 503,178 |
| Events in quadrant D | 3,851,358 | 494,811 |
| Mode SS | |||
|---|---|---|---|
| Quadrant | BADHDUFLAG | Total packets | Discarded packets |
| A | 0 | 112 | 0 |
| B | 0 | 112 | 0 |
| C | 0 | 112 | 0 |
| D | 0 | 112 | 0 |
| Mode M0 | |||
|---|---|---|---|
| Quadrant | BADHDUFLAG | Total packets | Discarded packets |
| A | 0 | 11612 | 2 |
| B | 0 | 11902 | 1 |
| C | 0 | 12524 | 1 |
| D | 0 | 15253 | 1 |
| Mode M9 | |||
|---|---|---|---|
| Quadrant | BADHDUFLAG | Total packets | Discarded packets |
| A | 0 | 13 | 0 |
| B | 0 | 13 | 0 |
| C | 0 | 13 | 0 |
| D | 0 | 13 | 0 |
| Quadrant | Total seconds | Saturated seconds | Saturation percentage |
|---|---|---|---|
| A | 5544 | 45 | 0.811688% |
| B | 5545 | 63 | 1.136159% |
| C | 5545 | 76 | 1.370604% |
| D | 5545 | 147 | 2.651037% |
Noise dominated data is calculated using 1-second bins in cleaned event files. If a bin has >2000 counts, and if more than 50% of those come from <1% of pixels, then it is considered to be noise-dominated and hence unusable.
| Quadrant | # 1 sec bins | Bins with >0 counts | Bins with >2000 counts | High rate bins dominated by noise | Noise dominated (total time) | Noise dominated (detector-on time) | Marked lightcurve |
|---|---|---|---|---|---|---|---|
| A | 6824 | 5545 | 0 | 0 | 0.00% | 0.00% | 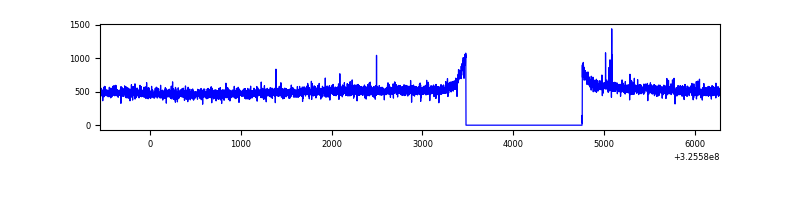 |
| B | 6825 | 5546 | 7 | 7 | 0.10% | 0.13% | 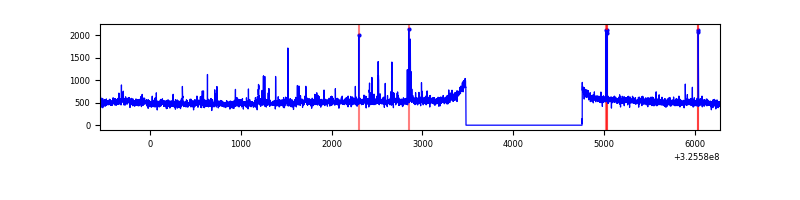 |
| C | 6825 | 5546 | 0 | 0 | 0.00% | 0.00% |  |
| D | 6825 | 5546 | 100 | 100 | 1.47% | 1.80% | 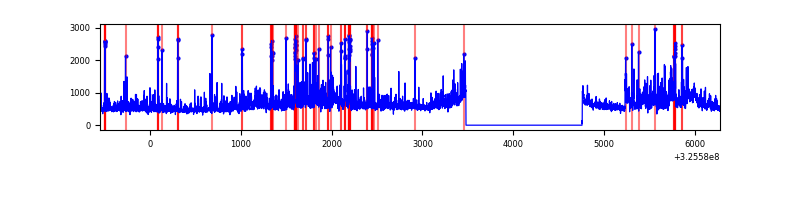 |
Top three noisy pixels from each quadrant. If the there are fewer than three noisy pixels in the level2.evt file, extra rows are filled as -1
| Pixel properties | Quadrant properties | ||||||
|---|---|---|---|---|---|---|---|
| Quadrant | DetID | PixID | Counts | Sigma | Mean | Median | Sigma |
| A | 13 | 254 | 9327 | 58.56 | 739 | 727 | 146.9 |
| A | 0 | 226 | 6490 | 39.24 | 739 | 727 | 146.9 |
| A | 4 | 2 | 6393 | 38.58 | 739 | 727 | 146.9 |
| B | 3 | 64 | 32014 | 229.6 | 726 | 711 | 136.3 |
| B | 15 | 36 | 20137 | 142.49 | 726 | 711 | 136.3 |
| B | 0 | 190 | 17401 | 122.42 | 726 | 711 | 136.3 |
| C | 7 | 247 | 184533 | 1140.47 | 693 | 697 | 161.2 |
| C | 14 | 238 | 114996 | 709.08 | 693 | 697 | 161.2 |
| C | 8 | 222 | 90202 | 555.27 | 693 | 697 | 161.2 |
| D | 1 | 52 | 543182 | 3208.99 | 703 | 684 | 169.1 |
| D | 8 | 195 | 484627 | 2862.62 | 703 | 684 | 169.1 |
| D | 7 | 238 | 149021 | 877.44 | 703 | 684 | 169.1 |
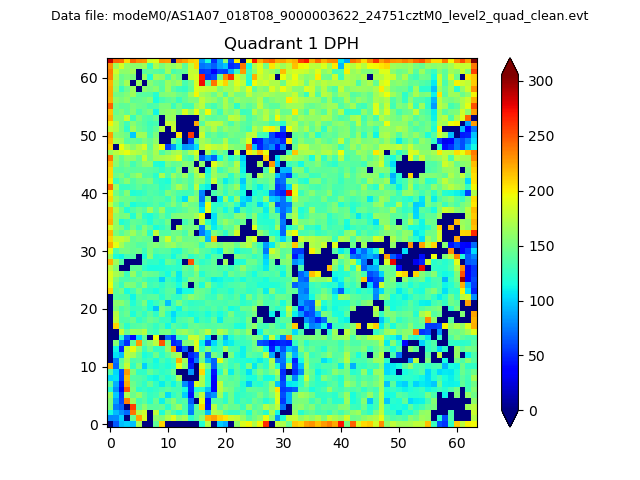
Histogram calculated using DETX and DETY for each event in the final _common_clean file
| Quadrant A | 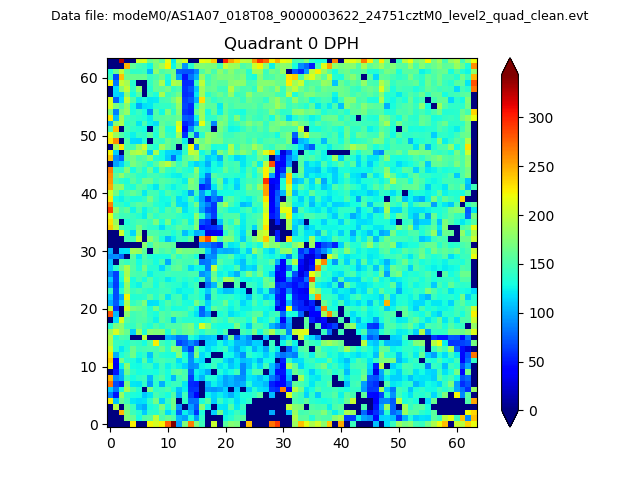 |
 |
Quadrant B |
|---|---|---|---|
| Quadrant D |  |
 |
Quadrant C |
| Plot type | Count rate plots | Images |
|---|---|---|
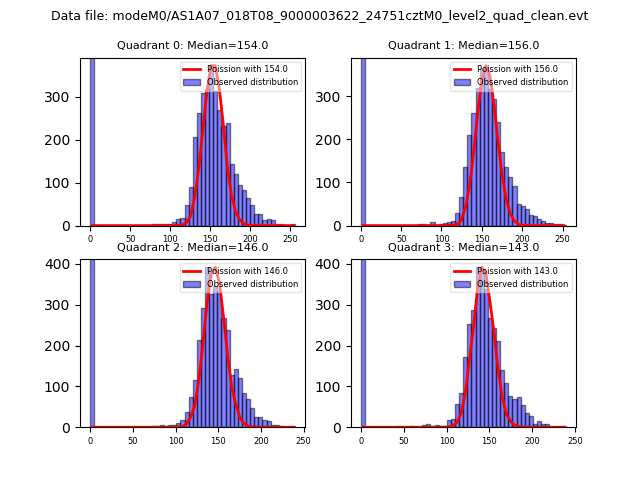
| Comparison with Poisson distribution Blue bars denote a histogram of data divided into 1 sec bins. Red curve is a Poisson curve with rate = median count rate of data. |
 |
 |
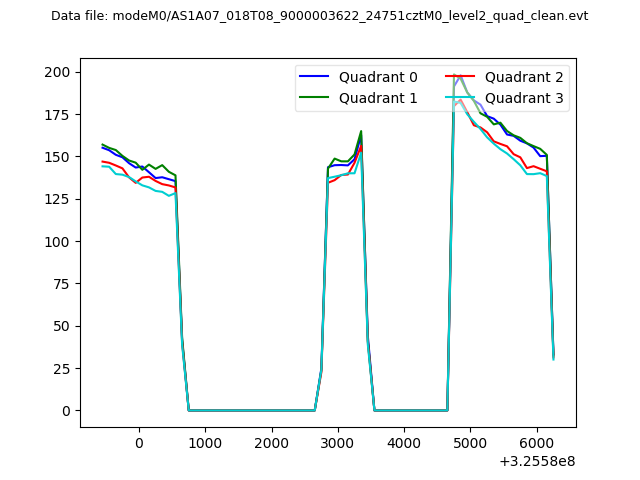
| Quadrant-wise count rates Data is divided into 100 sec bins |
 |
|
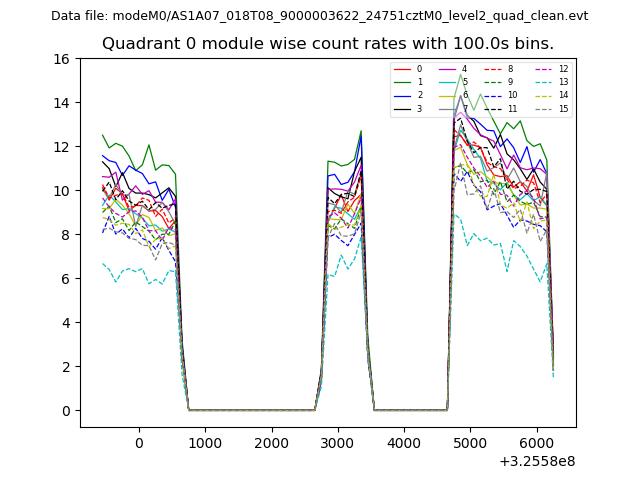
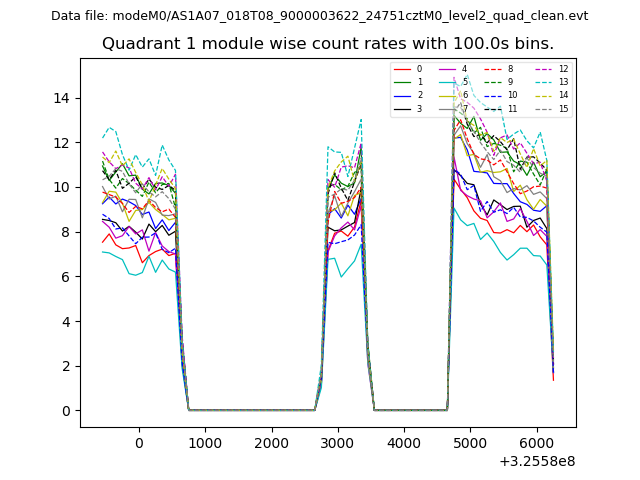
| Module-wise count rates for Quadrant A Data is divided into 100 sec bins |
 |
 |
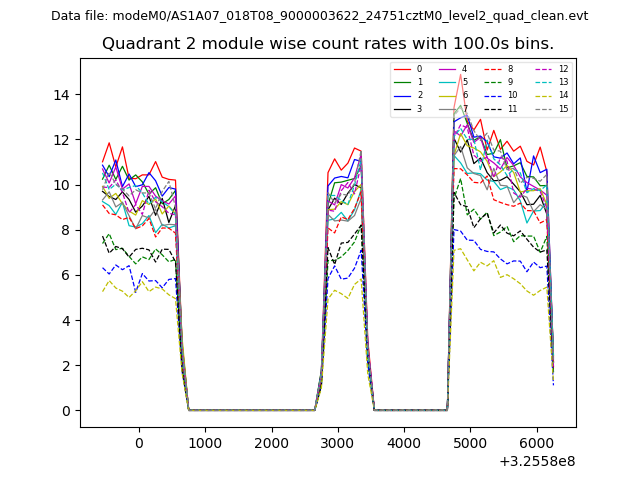
| Module-wise count rates for Quadrant B Data is divided into 100 sec bins |
 |
 |
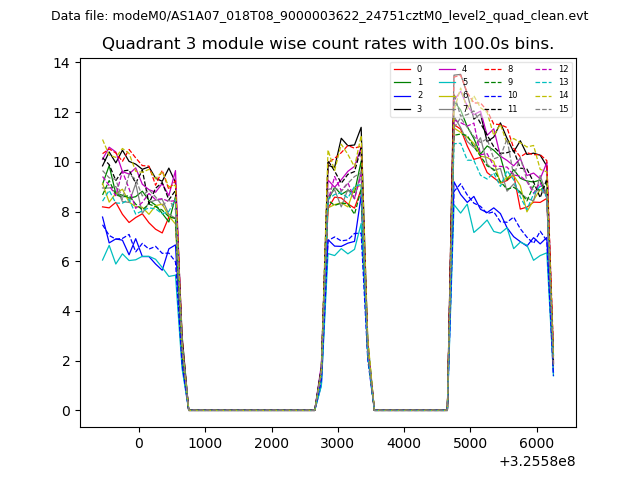
| Module-wise count rates for Quadrant C Data is divided into 100 sec bins |
 |
 |
| Module-wise count rates for Quadrant D Data is divided into 100 sec bins |
 |
 |
| Parameter | Plot |
|---|---|
| CZT HV Monitor | 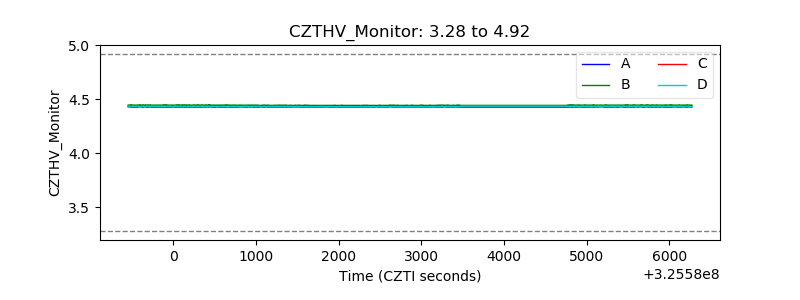 |
| D_VDD | 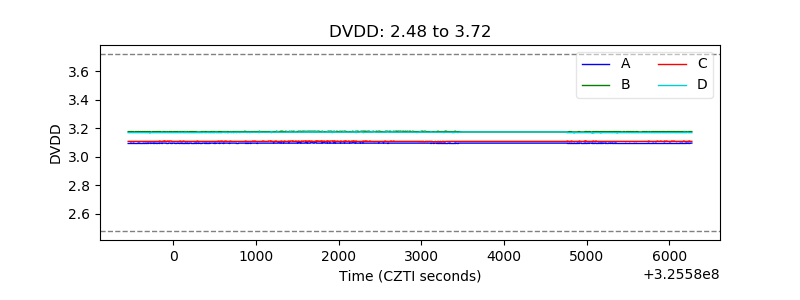 |
| Temperature 1 | 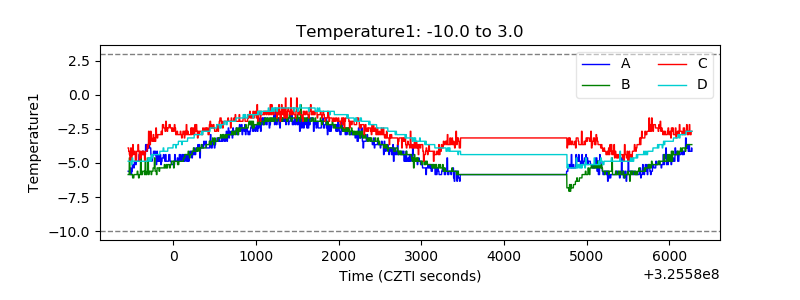 |
| Veto HV Monitor | 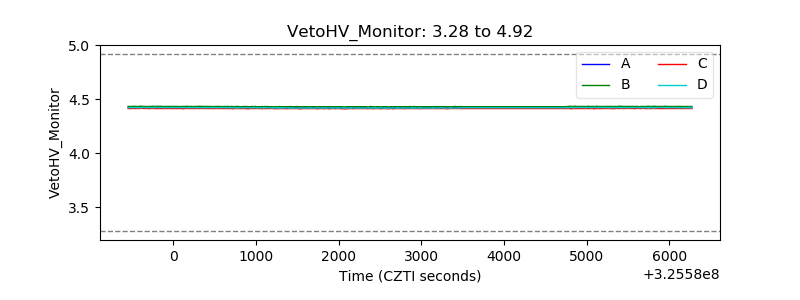 |
| Veto LLD | 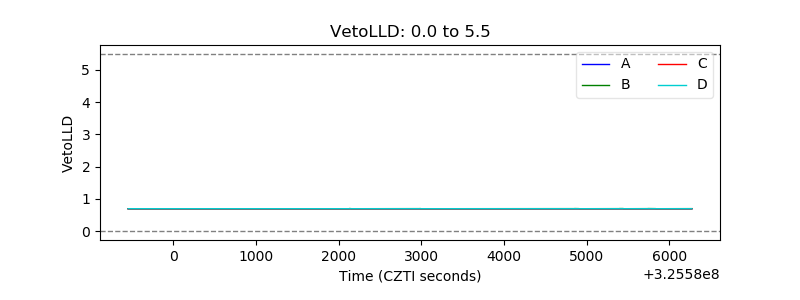 |
| Alpha Counter | 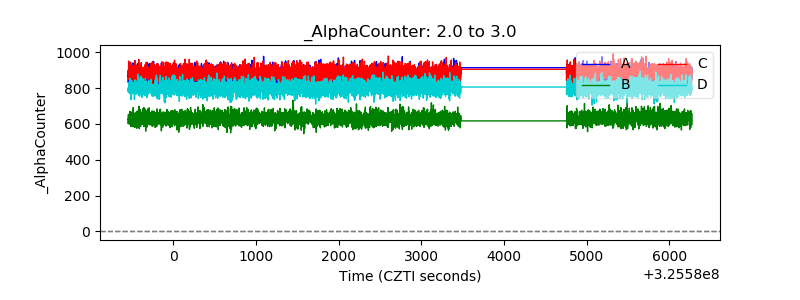 |
| _CPM_Rate | 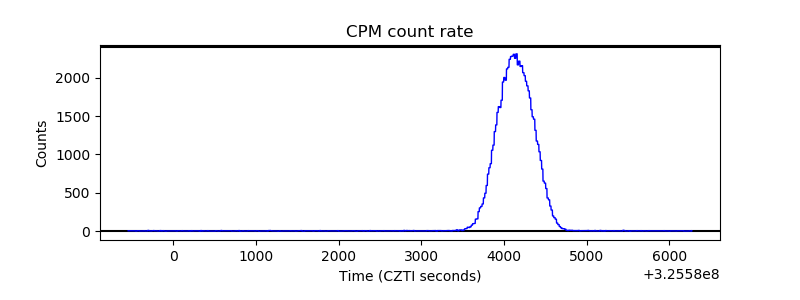 |
| CZT Counter |  |
| +2.5 Volts monitor |  |
| +5 Volts monitor |  |
| _ROLL_ROT | 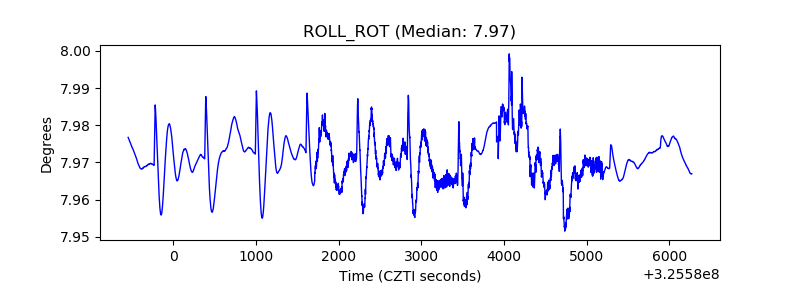 |
| _Roll_DEC | 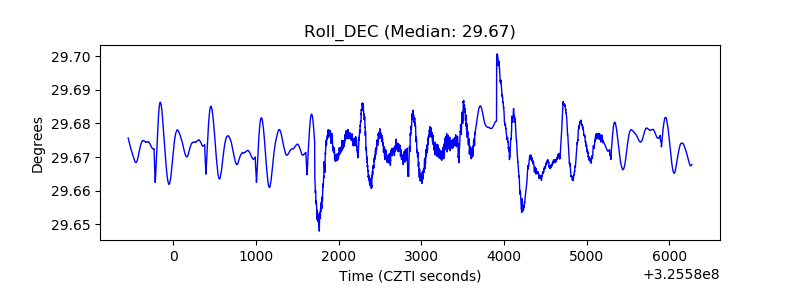 |
| _Roll_RA | 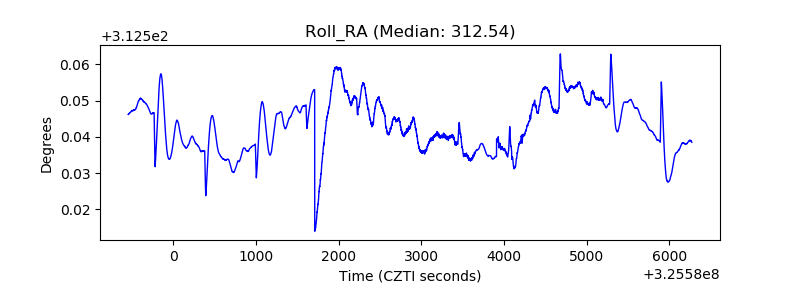 |
| Veto Counter | 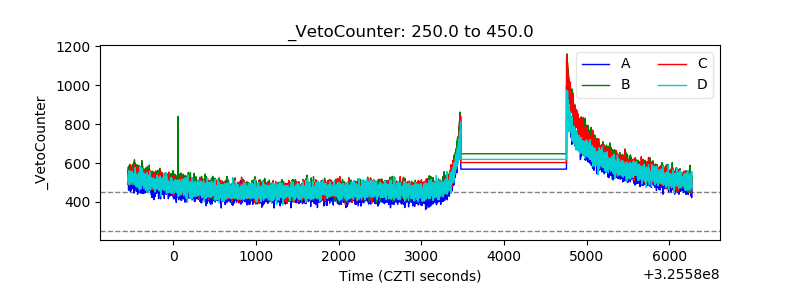 |