| Param | Original file | Final file |
|---|---|---|
| Filename | modeM0/AS1A07_018T08_9000003622_24752cztM0_level2.evt | modeM0/AS1A07_018T08_9000003622_24752cztM0_level2_quad_clean.evt |
| Size (bytes) | 433,543,680 | 81,339,840 |
| Size | 413.5 MB | 77.6 MB |
| Events in quadrant A | 2,912,984 | 535,230 |
| Events in quadrant B | 2,966,589 | 537,668 |
| Events in quadrant C | 2,976,216 | 505,441 |
| Events in quadrant D | 3,897,522 | 496,930 |
| Mode SS | |||
|---|---|---|---|
| Quadrant | BADHDUFLAG | Total packets | Discarded packets |
| A | 0 | 112 | 0 |
| B | 0 | 112 | 0 |
| C | 0 | 112 | 0 |
| D | 0 | 112 | 0 |
| Mode M0 | |||
|---|---|---|---|
| Quadrant | BADHDUFLAG | Total packets | Discarded packets |
| A | 0 | 11654 | 1 |
| B | 0 | 11842 | 1 |
| C | 0 | 11944 | 1 |
| D | 0 | 15413 | 1 |
| Mode M9 | |||
|---|---|---|---|
| Quadrant | BADHDUFLAG | Total packets | Discarded packets |
| A | 0 | 13 | 0 |
| B | 0 | 13 | 0 |
| C | 0 | 13 | 0 |
| D | 0 | 13 | 0 |
| Quadrant | Total seconds | Saturated seconds | Saturation percentage |
|---|---|---|---|
| A | 5547 | 87 | 1.568415% |
| B | 5548 | 99 | 1.784427% |
| C | 5548 | 109 | 1.964672% |
| D | 5548 | 99 | 1.784427% |
Noise dominated data is calculated using 1-second bins in cleaned event files. If a bin has >2000 counts, and if more than 50% of those come from <1% of pixels, then it is considered to be noise-dominated and hence unusable.
| Quadrant | # 1 sec bins | Bins with >0 counts | Bins with >2000 counts | High rate bins dominated by noise | Noise dominated (total time) | Noise dominated (detector-on time) | Marked lightcurve |
|---|---|---|---|---|---|---|---|
| A | 6822 | 5548 | 0 | 0 | 0.00% | 0.00% | 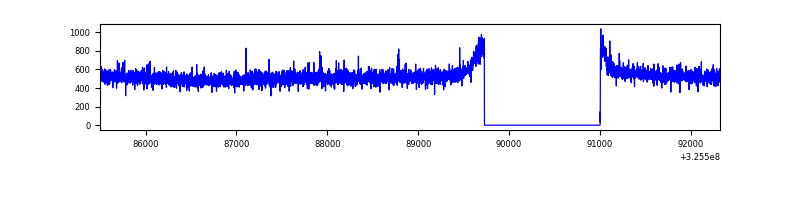 |
| B | 6823 | 5549 | 8 | 8 | 0.12% | 0.14% | 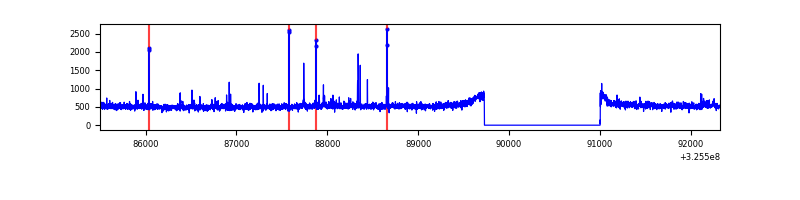 |
| C | 6823 | 5549 | 8 | 8 | 0.12% | 0.14% | 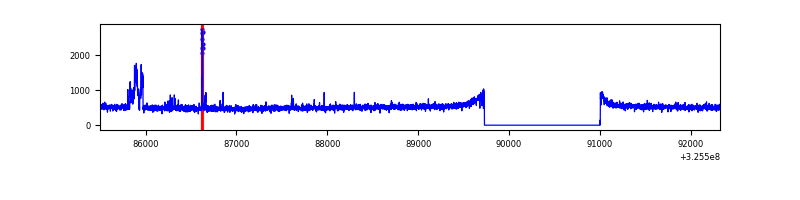 |
| D | 6823 | 5549 | 43 | 43 | 0.63% | 0.77% | 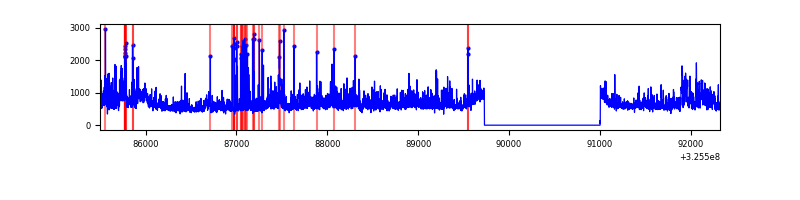 |
Top three noisy pixels from each quadrant. If the there are fewer than three noisy pixels in the level2.evt file, extra rows are filled as -1
| Pixel properties | Quadrant properties | ||||||
|---|---|---|---|---|---|---|---|
| Quadrant | DetID | PixID | Counts | Sigma | Mean | Median | Sigma |
| A | 13 | 254 | 9183 | 56.15 | 753 | 740 | 150.4 |
| A | 0 | 226 | 6702 | 39.65 | 753 | 740 | 150.4 |
| A | 3 | 137 | 6303 | 37.0 | 753 | 740 | 150.4 |
| B | 4 | 80 | 29708 | 207.99 | 734 | 719 | 139.4 |
| B | 0 | 189 | 19524 | 134.92 | 734 | 719 | 139.4 |
| B | 12 | 111 | 16212 | 111.16 | 734 | 719 | 139.4 |
| C | 14 | 238 | 113770 | 696.61 | 702 | 707 | 162.3 |
| C | 8 | 222 | 81109 | 495.38 | 702 | 707 | 162.3 |
| C | 5 | 112 | 37534 | 226.9 | 702 | 707 | 162.3 |
| D | 8 | 195 | 603287 | 3416.1 | 722 | 701 | 176.4 |
| D | 1 | 52 | 301130 | 1703.15 | 722 | 701 | 176.4 |
| D | 7 | 238 | 236024 | 1334.06 | 722 | 701 | 176.4 |
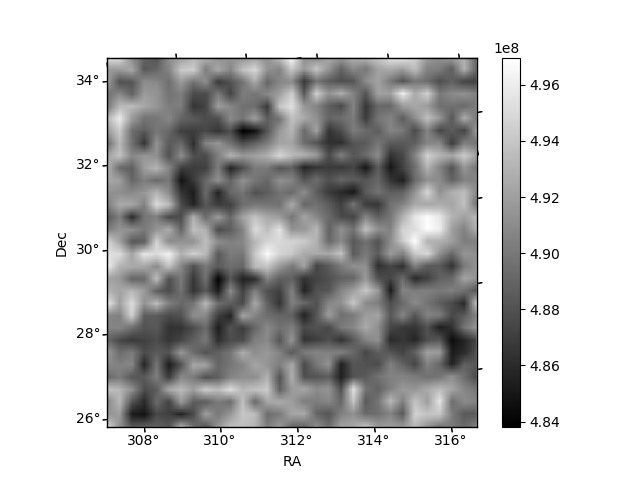
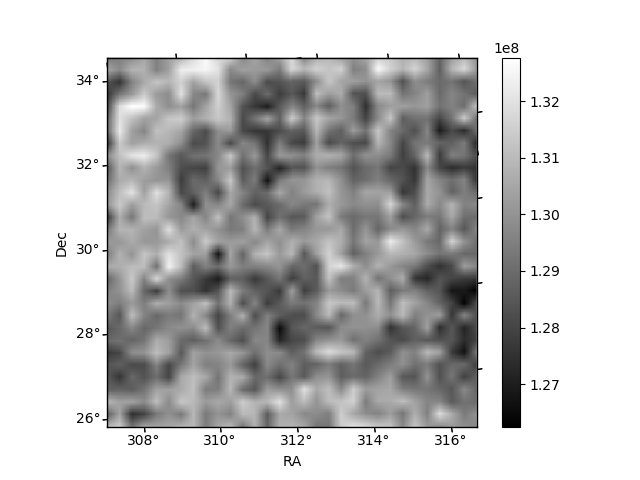
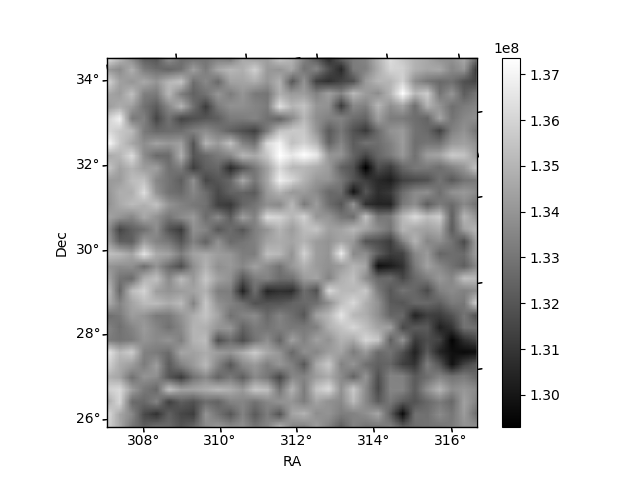
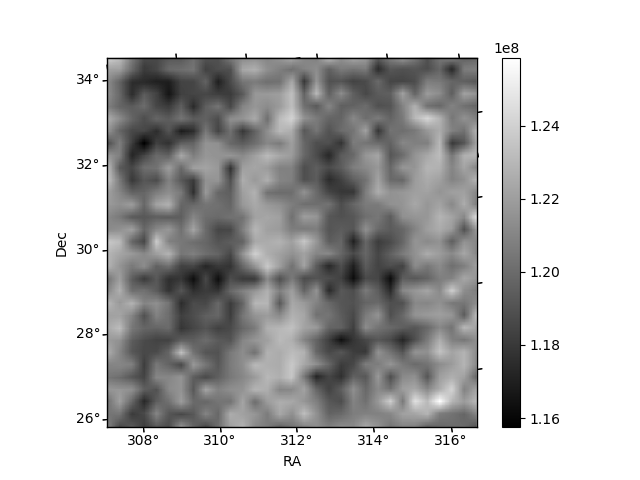
Histogram calculated using DETX and DETY for each event in the final _common_clean file
| Quadrant A | 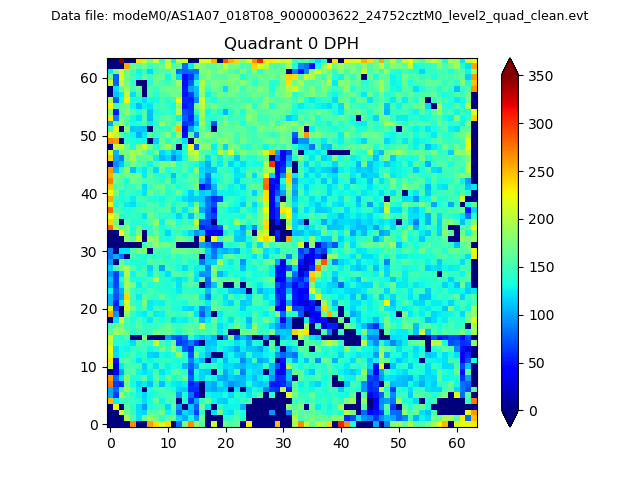 |
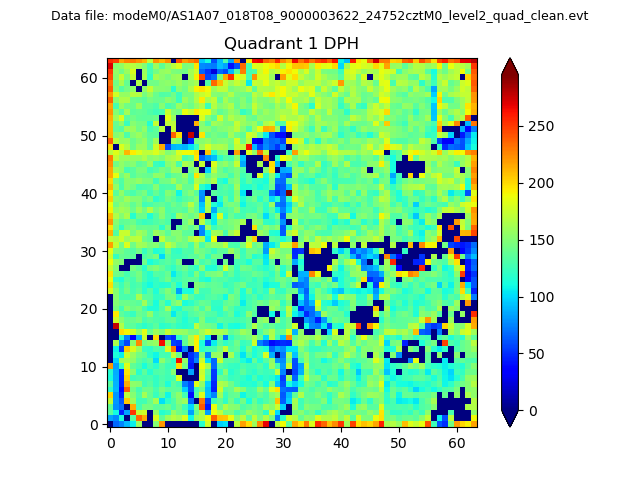 |
Quadrant B |
|---|---|---|---|
| Quadrant D | 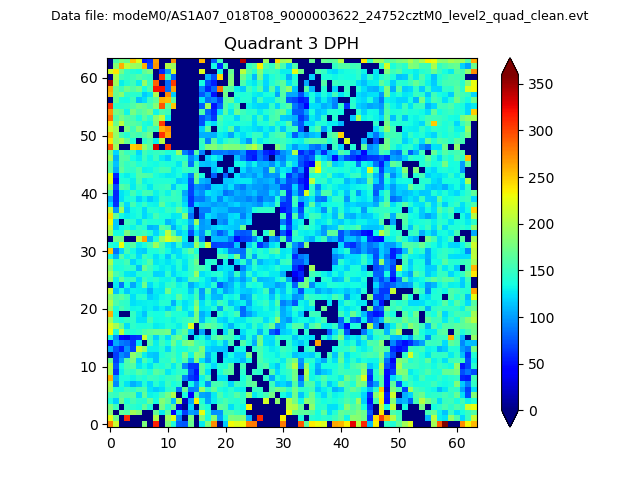 |
 |
Quadrant C |
| Plot type | Count rate plots | Images |
|---|---|---|
| Comparison with Poisson distribution Blue bars denote a histogram of data divided into 1 sec bins. Red curve is a Poisson curve with rate = median count rate of data. |
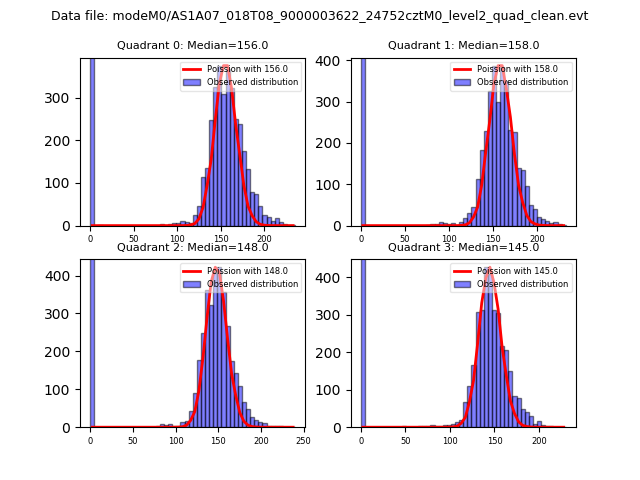 |
 |
| Quadrant-wise count rates Data is divided into 100 sec bins |
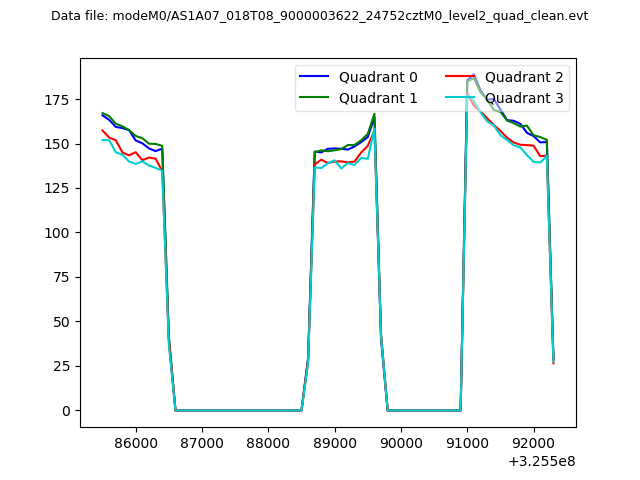 |
|
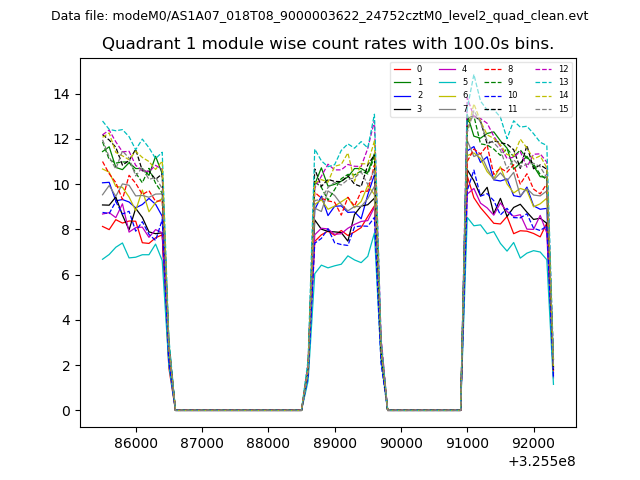
| Module-wise count rates for Quadrant A Data is divided into 100 sec bins |
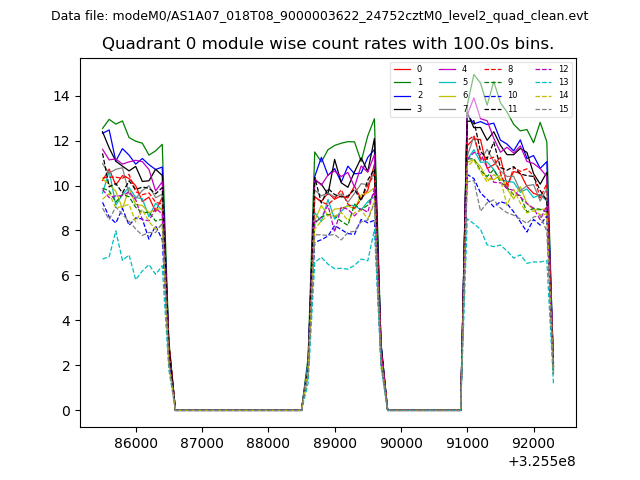 |
 |
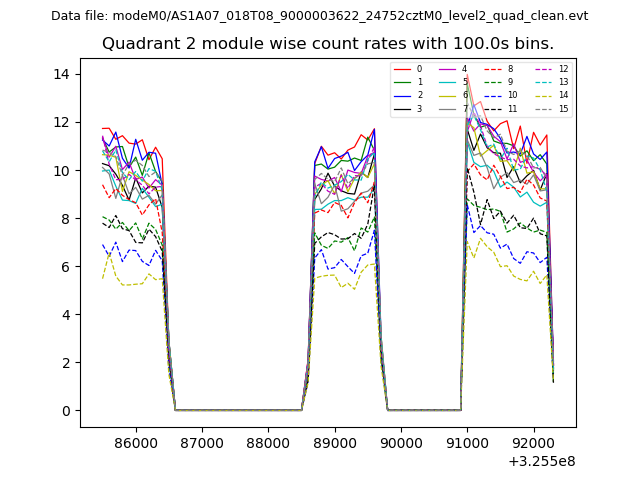
| Module-wise count rates for Quadrant B Data is divided into 100 sec bins |
 |
 |
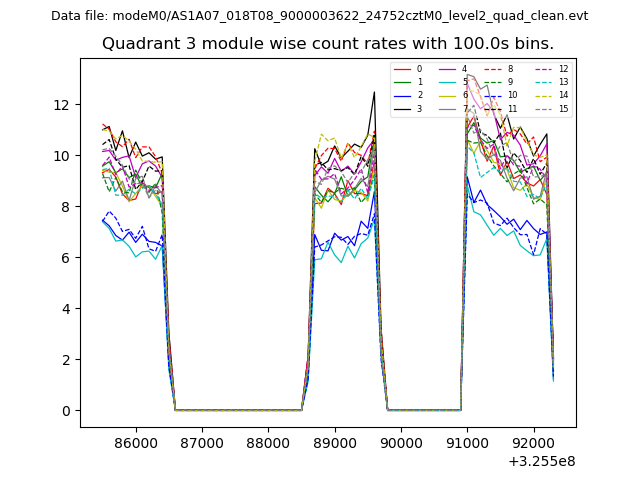
| Module-wise count rates for Quadrant C Data is divided into 100 sec bins |
 |
 |
| Module-wise count rates for Quadrant D Data is divided into 100 sec bins |
 |
 |
| Parameter | Plot |
|---|---|
| CZT HV Monitor | 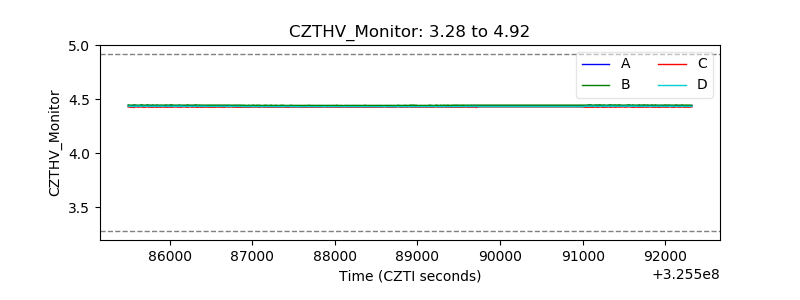 |
| D_VDD |  |
| Temperature 1 | 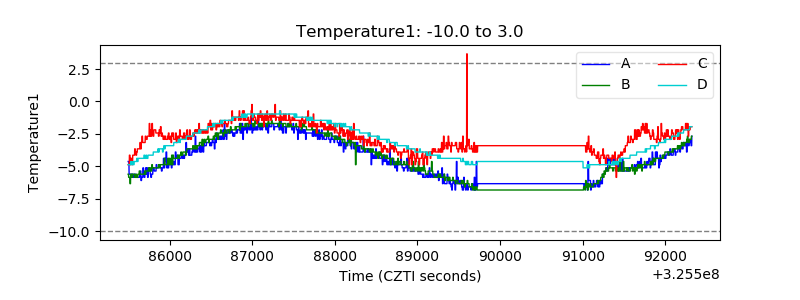 |
| Veto HV Monitor | 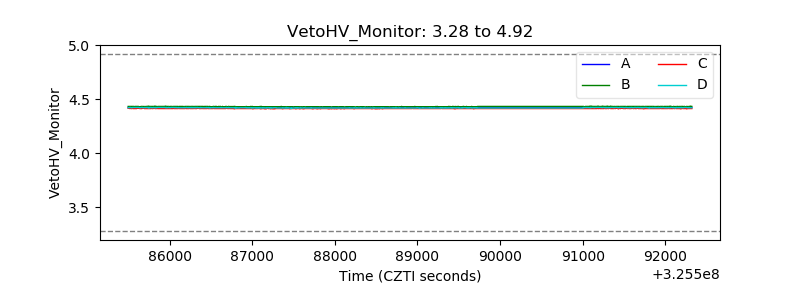 |
| Veto LLD | 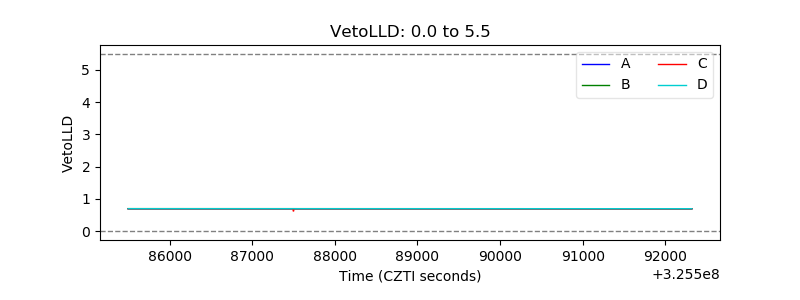 |
| Alpha Counter | 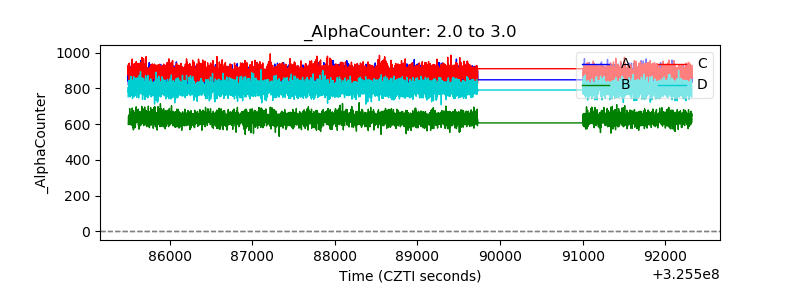 |
| _CPM_Rate | 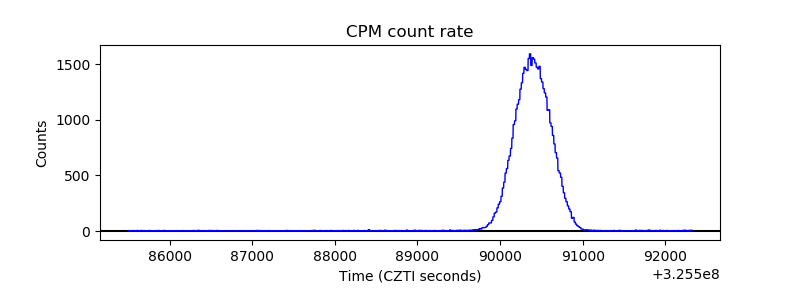 |
| CZT Counter |  |
| +2.5 Volts monitor |  |
| +5 Volts monitor | 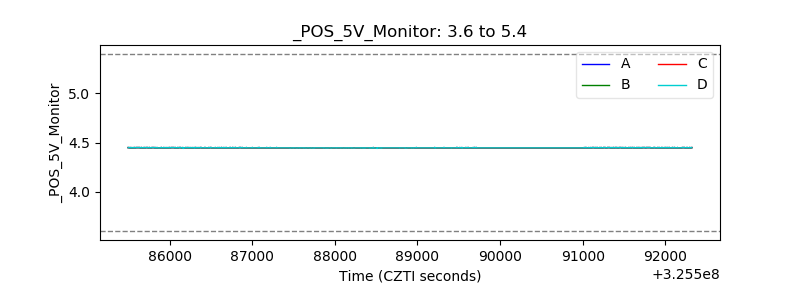 |
| _ROLL_ROT | 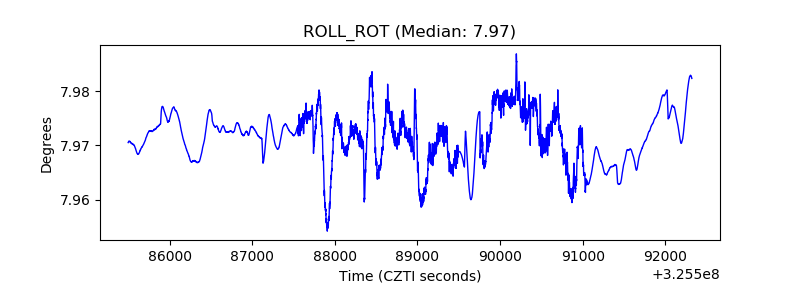 |
| _Roll_DEC | 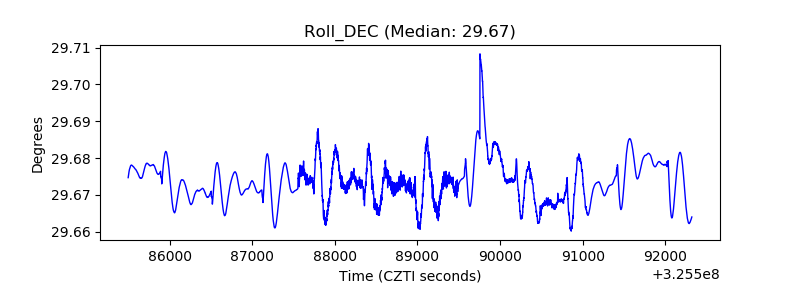 |
| _Roll_RA | 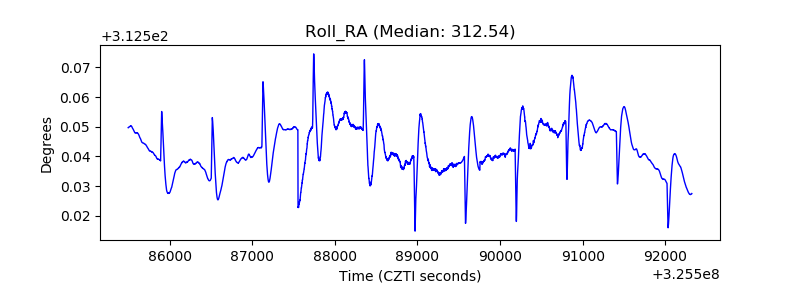 |
| Veto Counter | 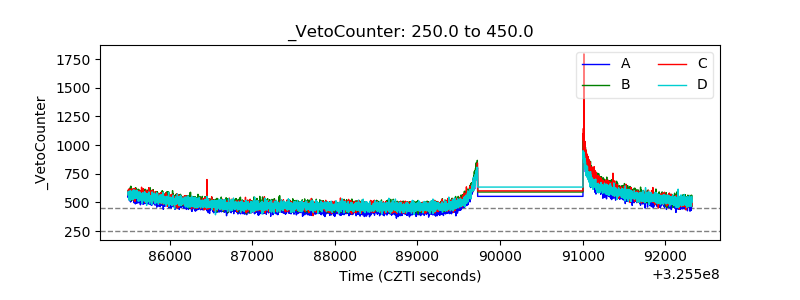 |