| Param | Original file | Final file |
|---|---|---|
| Filename | modeM0/AS1A07_018T08_9000003622_24753cztM0_level2.evt | modeM0/AS1A07_018T08_9000003622_24753cztM0_level2_quad_clean.evt |
| Size (bytes) | 464,077,440 | 90,034,560 |
| Size | 442.6 MB | 85.9 MB |
| Events in quadrant A | 3,235,308 | 589,863 |
| Events in quadrant B | 3,393,938 | 587,827 |
| Events in quadrant C | 3,232,776 | 559,636 |
| Events in quadrant D | 3,769,668 | 554,503 |
| Mode SS | |||
|---|---|---|---|
| Quadrant | BADHDUFLAG | Total packets | Discarded packets |
| A | 0 | 126 | 0 |
| B | 0 | 126 | 0 |
| C | 0 | 126 | 0 |
| D | 0 | 126 | 0 |
| Mode M0 | |||
|---|---|---|---|
| Quadrant | BADHDUFLAG | Total packets | Discarded packets |
| A | 0 | 13034 | 2 |
| B | 0 | 13529 | 2 |
| C | 0 | 13036 | 2 |
| D | 0 | 15104 | 2 |
| Mode M9 | |||
|---|---|---|---|
| Quadrant | BADHDUFLAG | Total packets | Discarded packets |
| A | 0 | 13 | 0 |
| B | 0 | 14 | 0 |
| C | 0 | 14 | 0 |
| D | 0 | 14 | 0 |
| Quadrant | Total seconds | Saturated seconds | Saturation percentage |
|---|---|---|---|
| A | 6231 | 64 | 1.027122% |
| B | 6231 | 92 | 1.476489% |
| C | 6231 | 87 | 1.396245% |
| D | 6231 | 41 | 0.658000% |
Noise dominated data is calculated using 1-second bins in cleaned event files. If a bin has >2000 counts, and if more than 50% of those come from <1% of pixels, then it is considered to be noise-dominated and hence unusable.
| Quadrant | # 1 sec bins | Bins with >0 counts | Bins with >2000 counts | High rate bins dominated by noise | Noise dominated (total time) | Noise dominated (detector-on time) | Marked lightcurve |
|---|---|---|---|---|---|---|---|
| A | 7496 | 6232 | 0 | 0 | 0.00% | 0.00% | 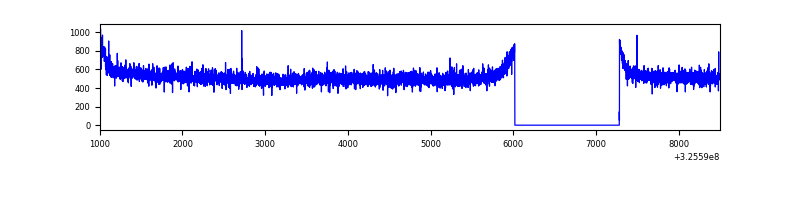 |
| B | 7496 | 6232 | 20 | 20 | 0.27% | 0.32% | 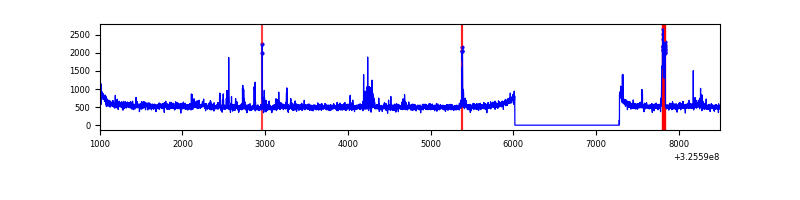 |
| C | 7496 | 6232 | 2 | 2 | 0.03% | 0.03% | 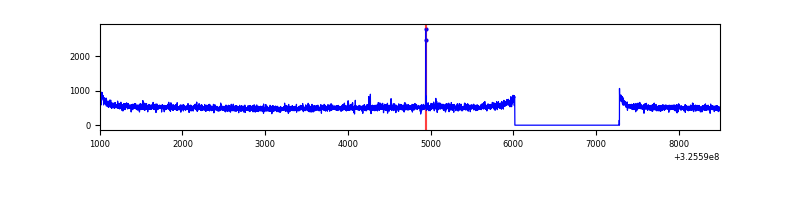 |
| D | 7496 | 6232 | 9 | 9 | 0.12% | 0.14% | 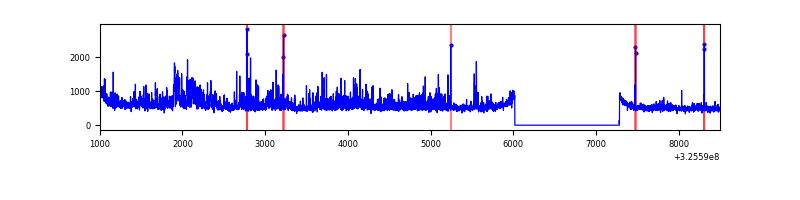 |
Top three noisy pixels from each quadrant. If the there are fewer than three noisy pixels in the level2.evt file, extra rows are filled as -1
| Pixel properties | Quadrant properties | ||||||
|---|---|---|---|---|---|---|---|
| Quadrant | DetID | PixID | Counts | Sigma | Mean | Median | Sigma |
| A | 13 | 254 | 10375 | 57.42 | 839 | 824 | 166.3 |
| A | 0 | 226 | 7401 | 39.54 | 839 | 824 | 166.3 |
| A | 3 | 137 | 7072 | 37.56 | 839 | 824 | 166.3 |
| B | 5 | 172 | 76538 | 490.43 | 818 | 799 | 154.4 |
| B | 3 | 64 | 45171 | 287.32 | 818 | 799 | 154.4 |
| B | 0 | 189 | 36045 | 228.22 | 818 | 799 | 154.4 |
| C | 14 | 238 | 126886 | 693.83 | 785 | 790 | 181.7 |
| C | 7 | 247 | 34436 | 185.13 | 785 | 790 | 181.7 |
| C | 5 | 112 | 11907 | 61.17 | 785 | 790 | 181.7 |
| D | 8 | 195 | 400030 | 2031.72 | 809 | 786 | 196.5 |
| D | 7 | 238 | 153717 | 778.25 | 809 | 786 | 196.5 |
| D | 1 | 52 | 116023 | 586.43 | 809 | 786 | 196.5 |
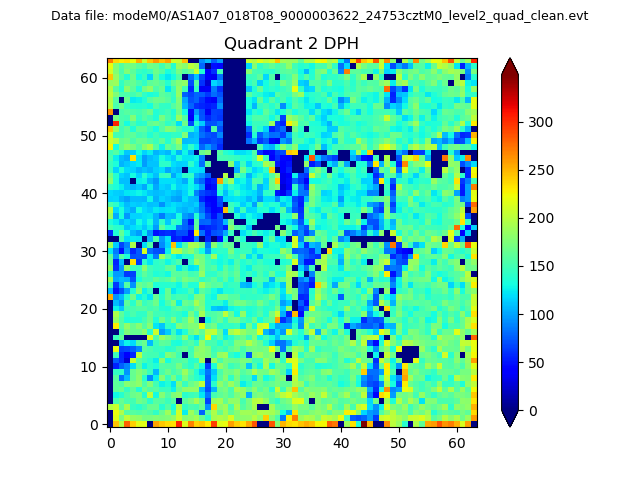
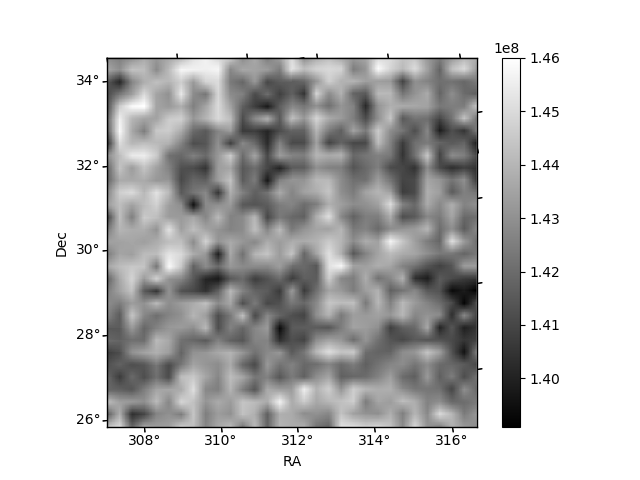
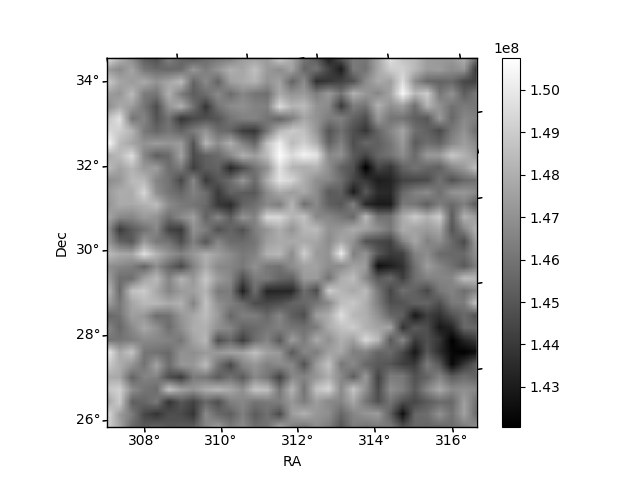
Histogram calculated using DETX and DETY for each event in the final _common_clean file
| Quadrant A | 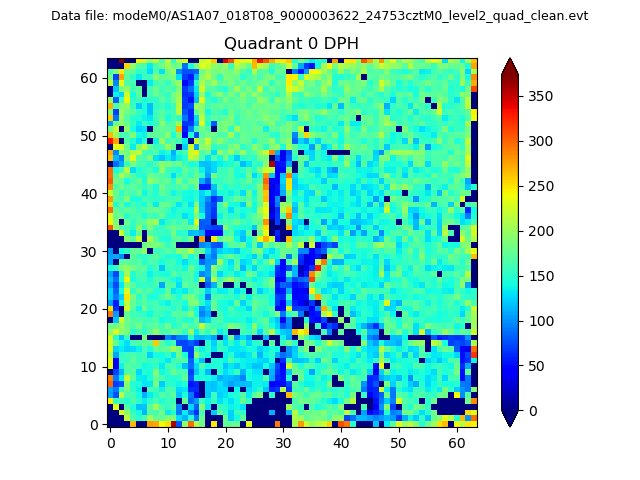 |
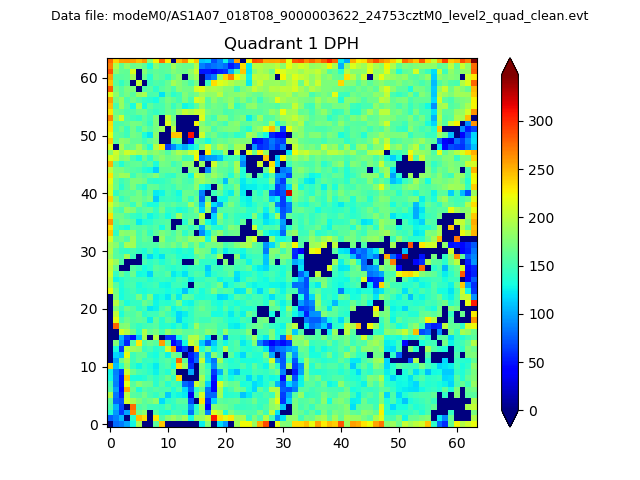 |
Quadrant B |
|---|---|---|---|
| Quadrant D | 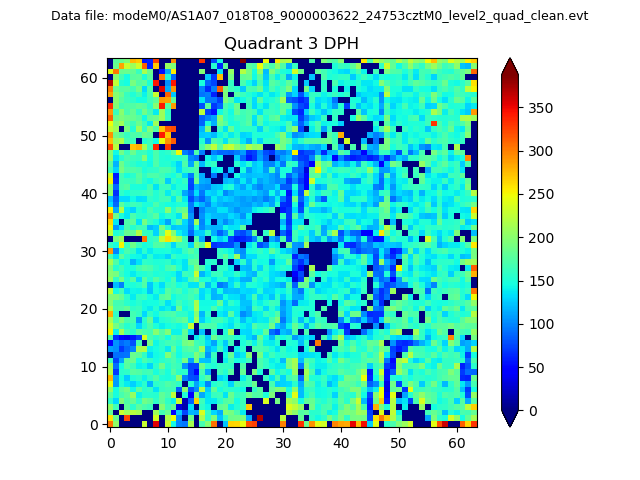 |
 |
Quadrant C |
| Plot type | Count rate plots | Images |
|---|---|---|
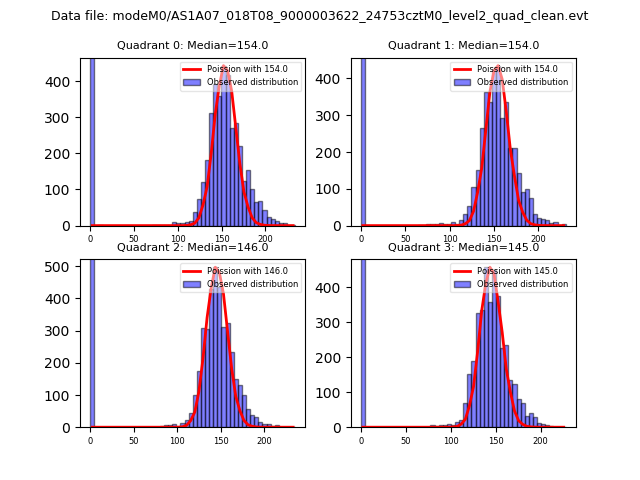
| Comparison with Poisson distribution Blue bars denote a histogram of data divided into 1 sec bins. Red curve is a Poisson curve with rate = median count rate of data. |
 |
 |
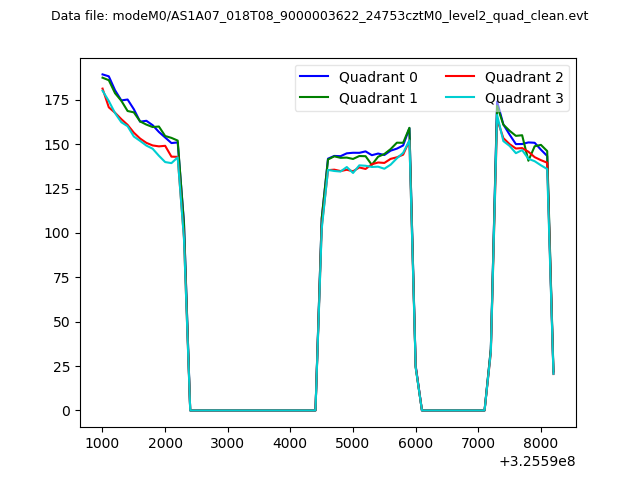
| Quadrant-wise count rates Data is divided into 100 sec bins |
 |
|
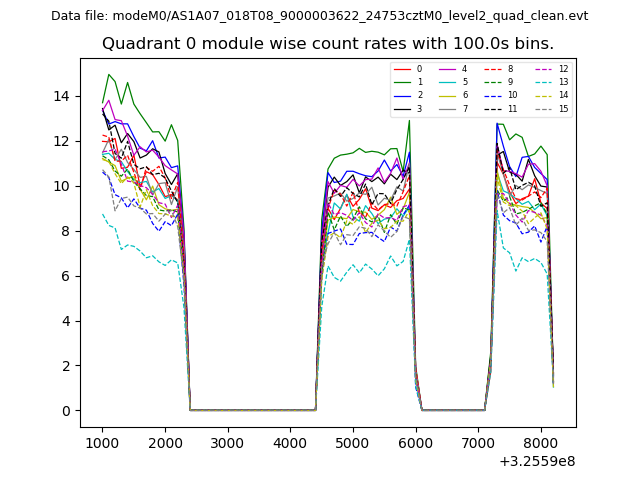
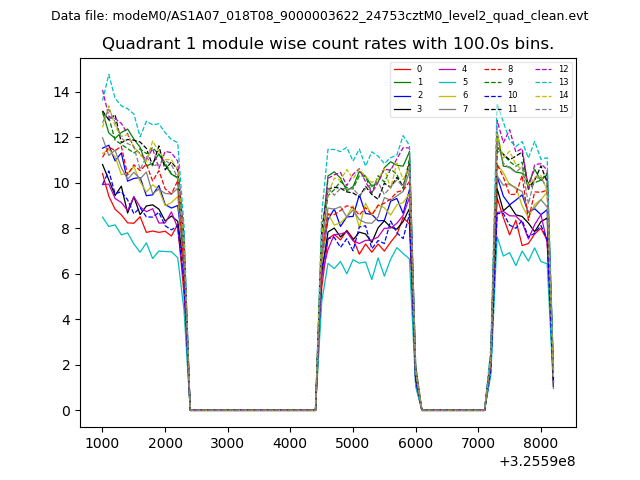
| Module-wise count rates for Quadrant A Data is divided into 100 sec bins |
 |
 |
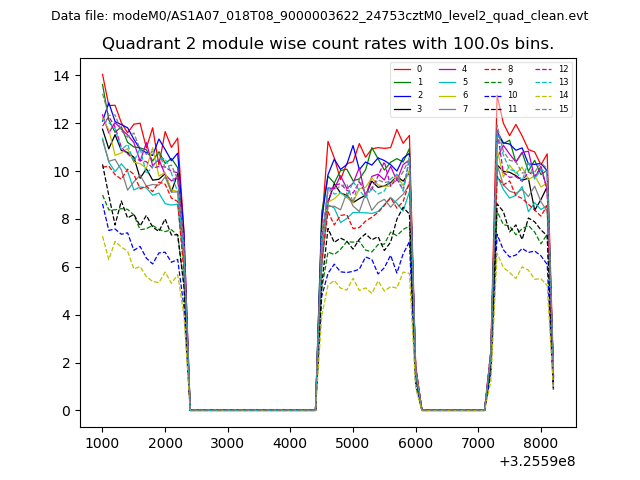
| Module-wise count rates for Quadrant B Data is divided into 100 sec bins |
 |
 |
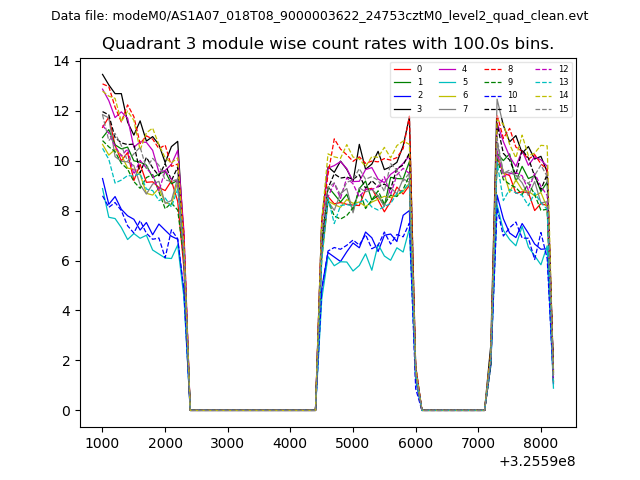
| Module-wise count rates for Quadrant C Data is divided into 100 sec bins |
 |
 |
| Module-wise count rates for Quadrant D Data is divided into 100 sec bins |
 |
 |
| Parameter | Plot |
|---|---|
| CZT HV Monitor | 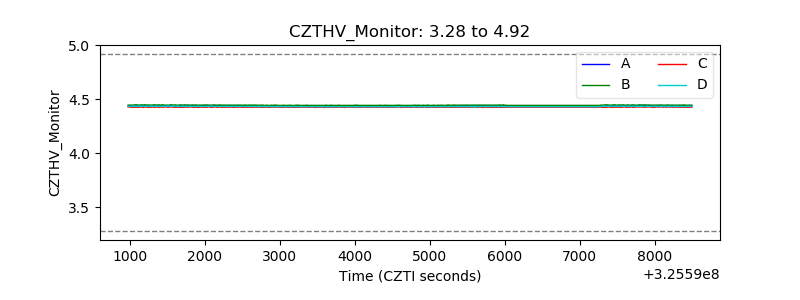 |
| D_VDD | 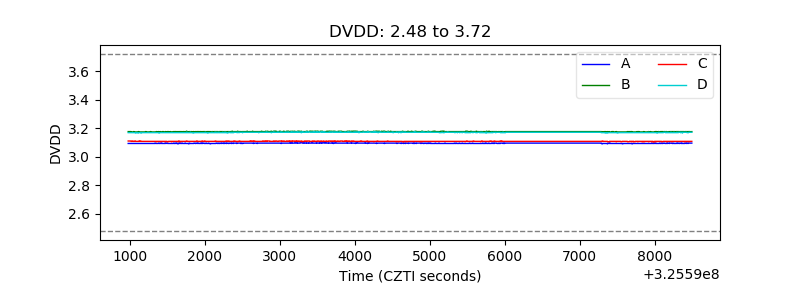 |
| Temperature 1 | 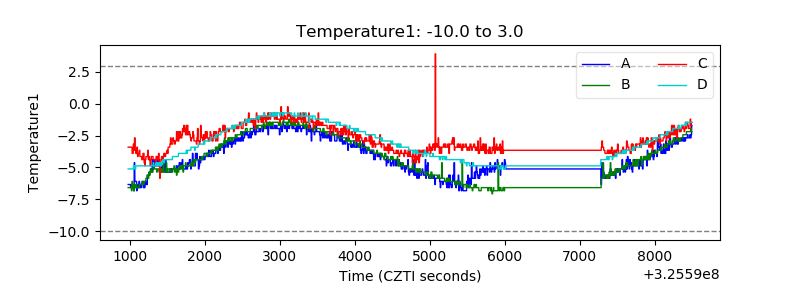 |
| Veto HV Monitor | 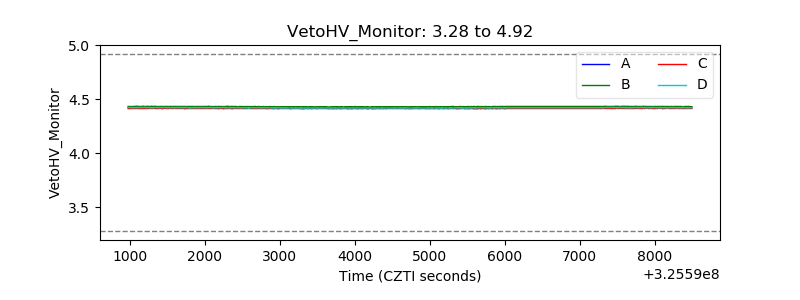 |
| Veto LLD | 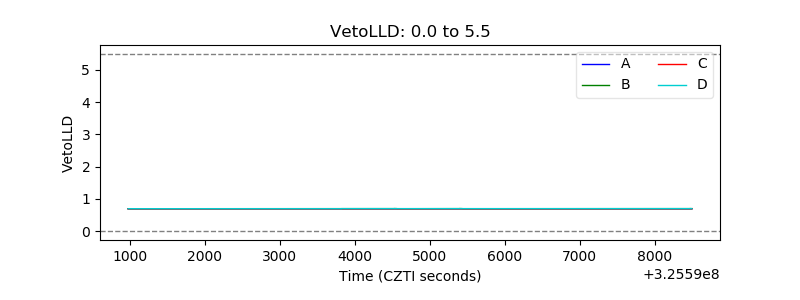 |
| Alpha Counter | 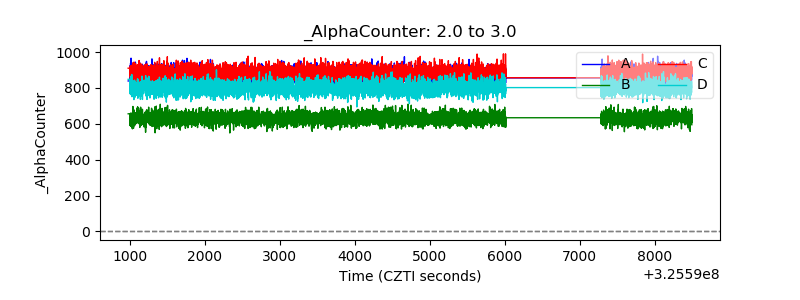 |
| _CPM_Rate | 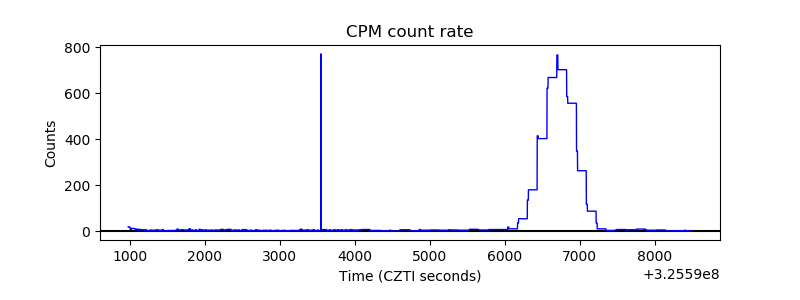 |
| CZT Counter | 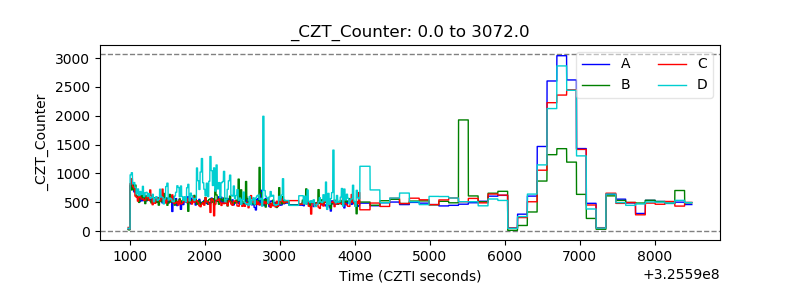 |
| +2.5 Volts monitor | 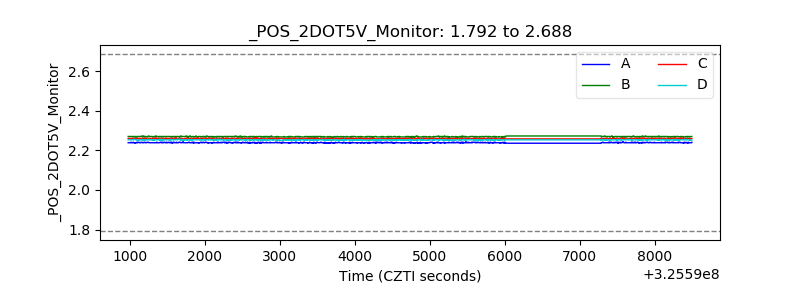 |
| +5 Volts monitor | 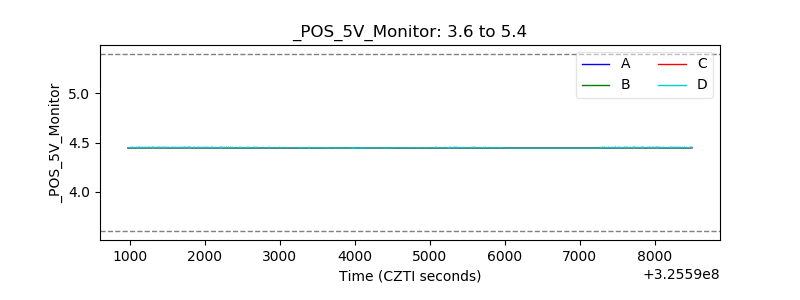 |
| _ROLL_ROT | 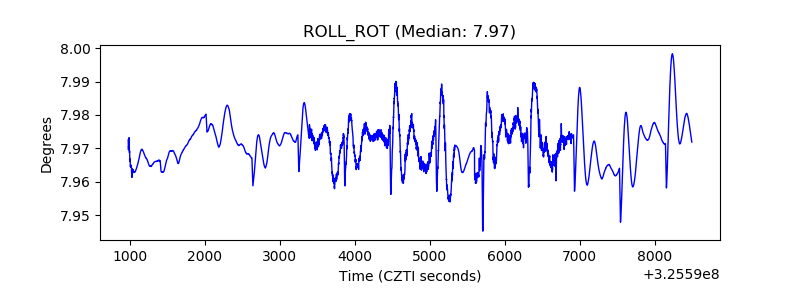 |
| _Roll_DEC | 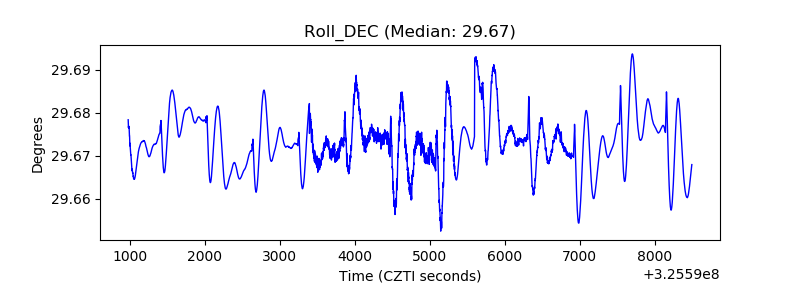 |
| _Roll_RA | 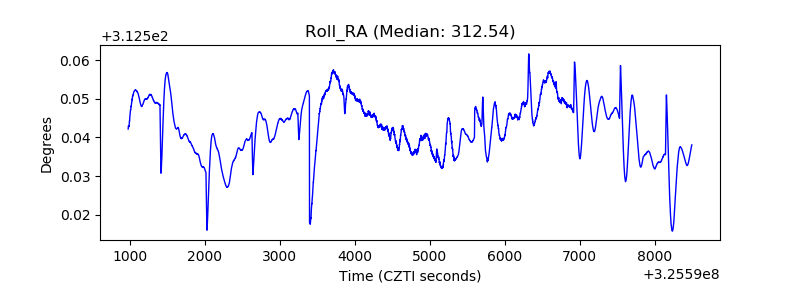 |
| Veto Counter | 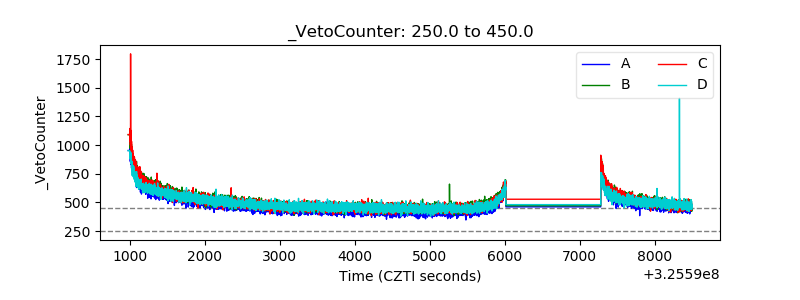 |