| Param | Original file | Final file |
|---|---|---|
| Filename | modeM0/AS1A07_018T08_9000003622_24754cztM0_level2.evt | modeM0/AS1A07_018T08_9000003622_24754cztM0_level2_quad_clean.evt |
| Size (bytes) | 499,780,800 | 82,019,520 |
| Size | 476.6 MB | 78.2 MB |
| Events in quadrant A | 3,422,207 | 511,513 |
| Events in quadrant B | 3,638,064 | 514,308 |
| Events in quadrant C | 4,082,855 | 490,051 |
| Events in quadrant D | 3,526,648 | 489,223 |
| Mode SS | |||
|---|---|---|---|
| Quadrant | BADHDUFLAG | Total packets | Discarded packets |
| A | 0 | 140 | 0 |
| B | 0 | 140 | 0 |
| C | 0 | 140 | 0 |
| D | 0 | 140 | 0 |
| Mode M0 | |||
|---|---|---|---|
| Quadrant | BADHDUFLAG | Total packets | Discarded packets |
| A | 0 | 14129 | 2 |
| B | 0 | 14765 | 2 |
| C | 0 | 16655 | 2 |
| D | 0 | 14599 | 2 |
| Mode M9 | |||
|---|---|---|---|
| Quadrant | BADHDUFLAG | Total packets | Discarded packets |
| A | 0 | 10 | 0 |
| B | 0 | 10 | 0 |
| C | 0 | 10 | 0 |
| D | 0 | 10 | 0 |
| Quadrant | Total seconds | Saturated seconds | Saturation percentage |
|---|---|---|---|
| A | 6864 | 91 | 1.325758% |
| B | 6864 | 112 | 1.631702% |
| C | 6864 | 170 | 2.476690% |
| D | 6864 | 73 | 1.063520% |
Noise dominated data is calculated using 1-second bins in cleaned event files. If a bin has >2000 counts, and if more than 50% of those come from <1% of pixels, then it is considered to be noise-dominated and hence unusable.
| Quadrant | # 1 sec bins | Bins with >0 counts | Bins with >2000 counts | High rate bins dominated by noise | Noise dominated (total time) | Noise dominated (detector-on time) | Marked lightcurve |
|---|---|---|---|---|---|---|---|
| A | 7844 | 6865 | 0 | 0 | 0.00% | 0.00% | 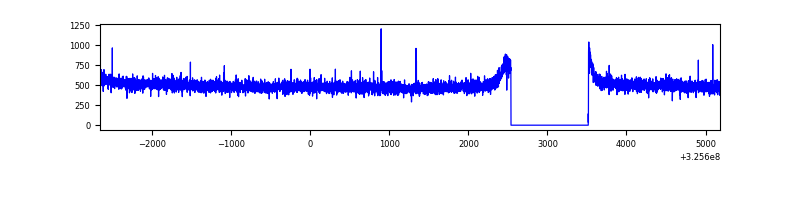 |
| B | 7844 | 6865 | 28 | 28 | 0.36% | 0.41% | 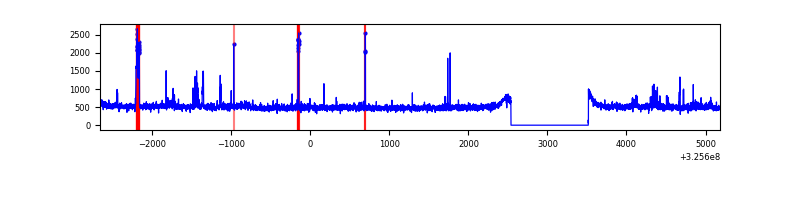 |
| C | 7844 | 6865 | 45 | 45 | 0.57% | 0.66% | 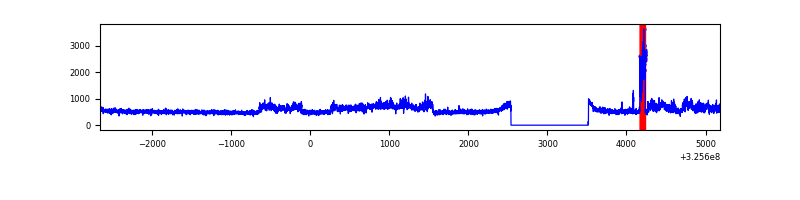 |
| D | 7844 | 6865 | 9 | 9 | 0.11% | 0.13% | 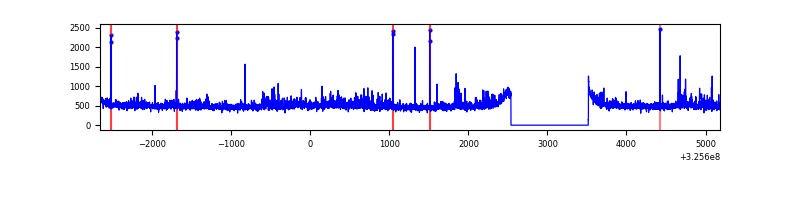 |
Top three noisy pixels from each quadrant. If the there are fewer than three noisy pixels in the level2.evt file, extra rows are filled as -1
| Pixel properties | Quadrant properties | ||||||
|---|---|---|---|---|---|---|---|
| Quadrant | DetID | PixID | Counts | Sigma | Mean | Median | Sigma |
| A | 13 | 254 | 12063 | 63.15 | 886 | 867 | 177.3 |
| A | 3 | 137 | 7801 | 39.11 | 886 | 867 | 177.3 |
| A | 0 | 226 | 7681 | 38.43 | 886 | 867 | 177.3 |
| B | 5 | 172 | 74138 | 446.01 | 869 | 848 | 164.3 |
| B | 0 | 189 | 69351 | 416.88 | 869 | 848 | 164.3 |
| B | 0 | 190 | 50726 | 303.53 | 869 | 848 | 164.3 |
| C | 7 | 247 | 552797 | 2846.93 | 833 | 839 | 193.9 |
| C | 2 | 16 | 151353 | 776.33 | 833 | 839 | 193.9 |
| C | 14 | 238 | 132015 | 676.59 | 833 | 839 | 193.9 |
| D | 8 | 195 | 220050 | 1050.89 | 859 | 835 | 208.6 |
| D | 2 | 234 | 28068 | 130.55 | 859 | 835 | 208.6 |
| D | 2 | 120 | 14991 | 67.86 | 859 | 835 | 208.6 |
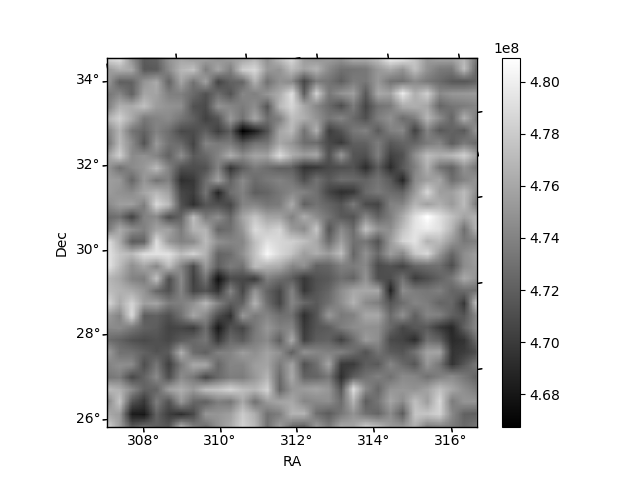
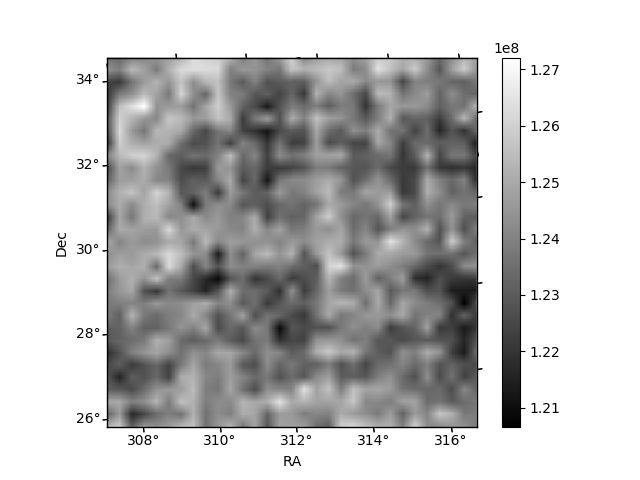
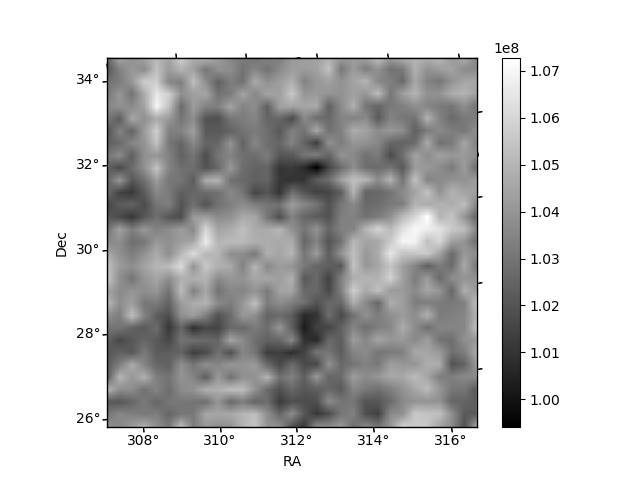
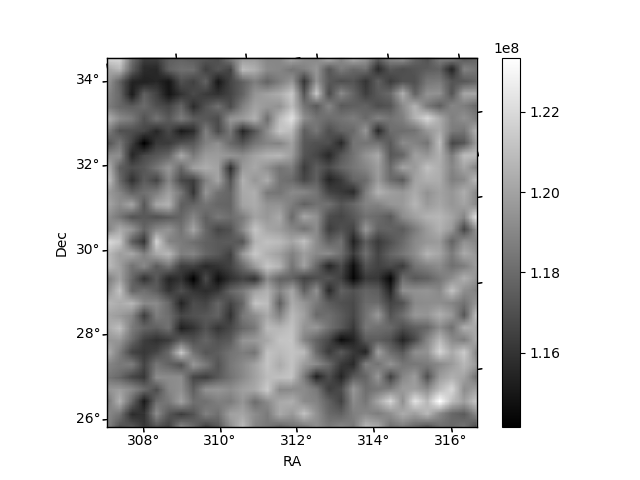
Histogram calculated using DETX and DETY for each event in the final _common_clean file
| Quadrant A | 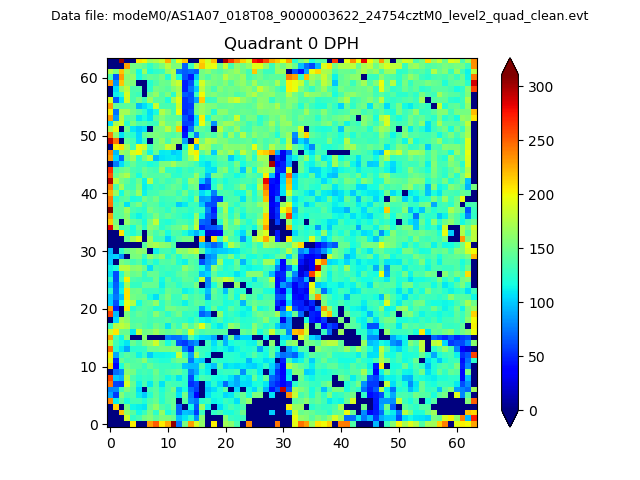 |
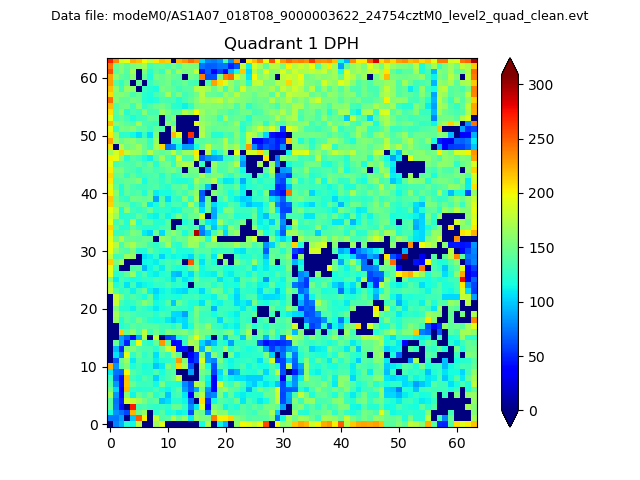 |
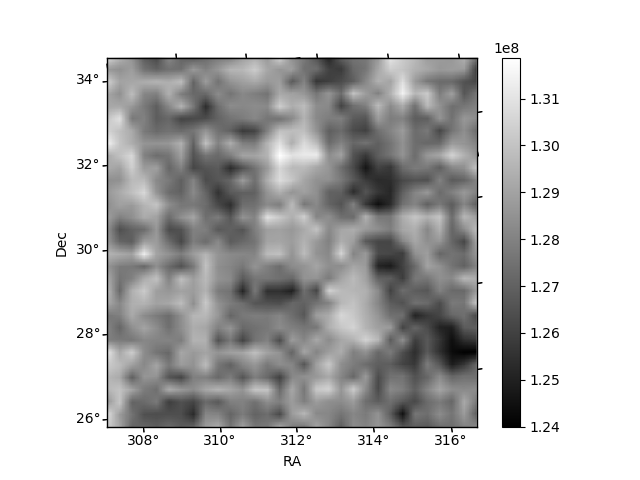
Quadrant B |
|---|---|---|---|
| Quadrant D | 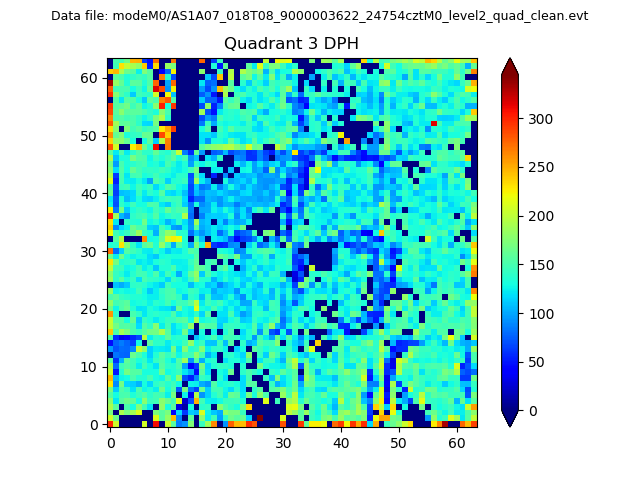 |
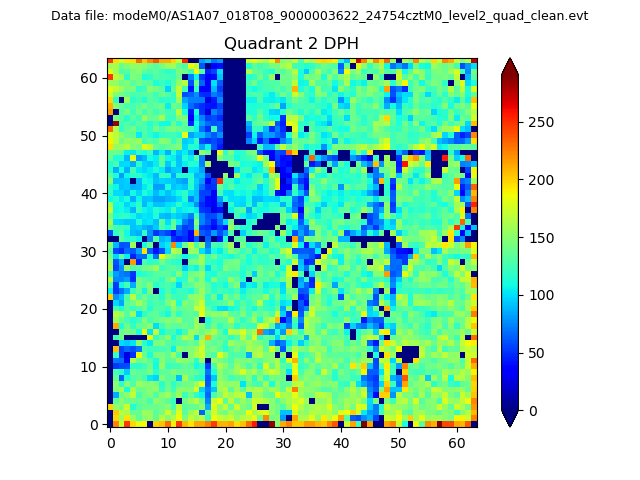 |
Quadrant C |
| Plot type | Count rate plots | Images |
|---|---|---|
| Comparison with Poisson distribution Blue bars denote a histogram of data divided into 1 sec bins. Red curve is a Poisson curve with rate = median count rate of data. |
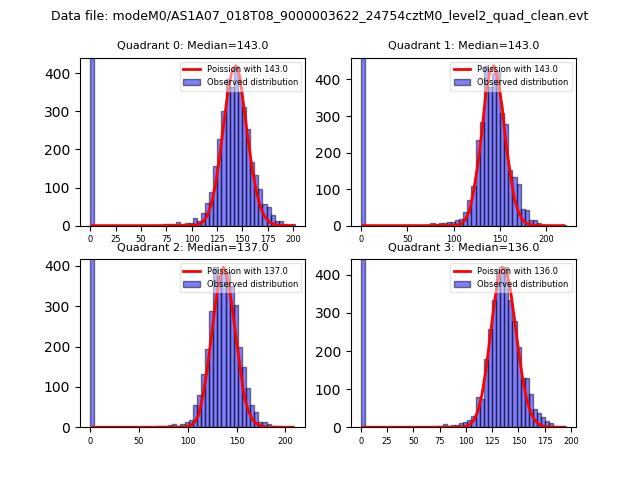 |
 |
| Quadrant-wise count rates Data is divided into 100 sec bins |
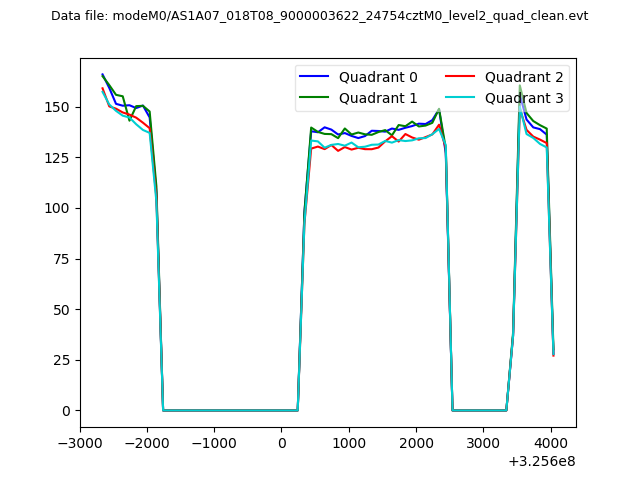 |
|
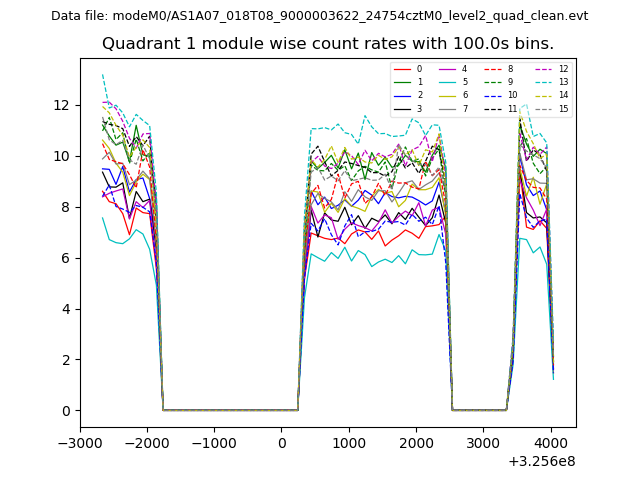
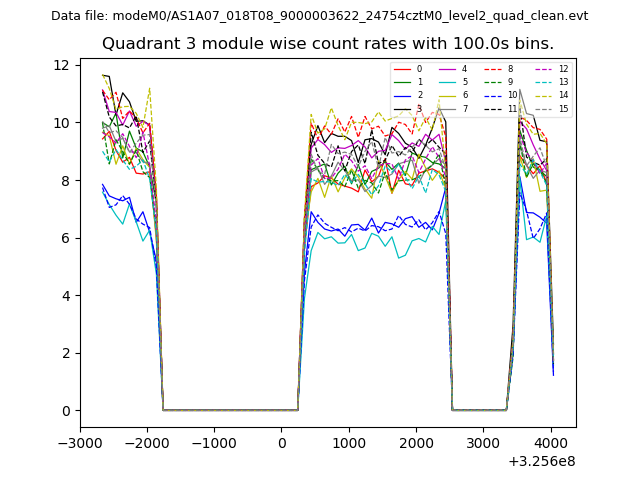
| Module-wise count rates for Quadrant A Data is divided into 100 sec bins |
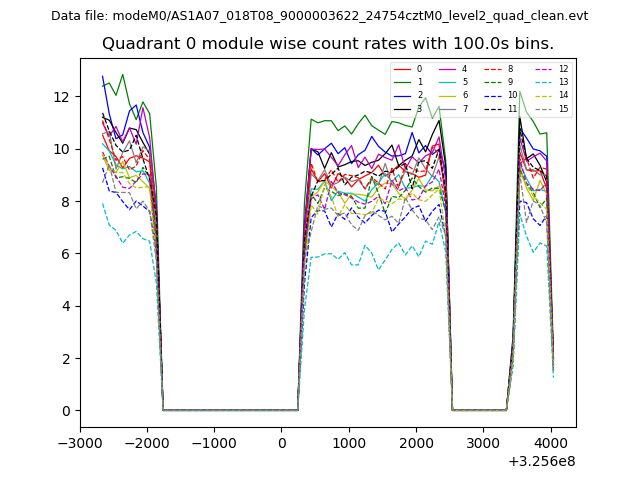 |
 |
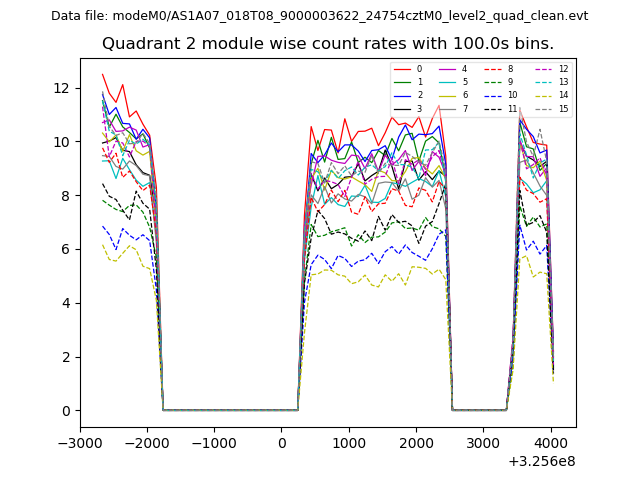
| Module-wise count rates for Quadrant B Data is divided into 100 sec bins |
 |
 |
| Module-wise count rates for Quadrant C Data is divided into 100 sec bins |
 |
 |
| Module-wise count rates for Quadrant D Data is divided into 100 sec bins |
 |
 |
| Parameter | Plot |
|---|---|
| CZT HV Monitor | 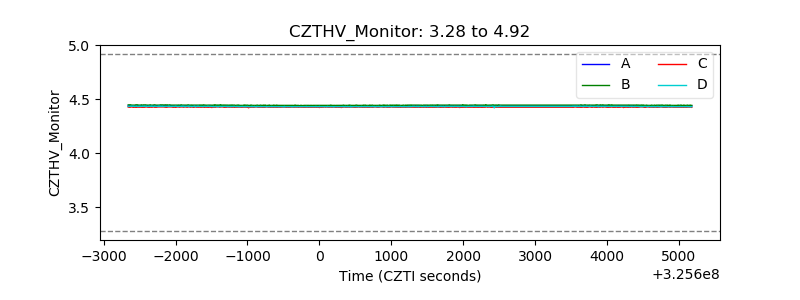 |
| D_VDD | 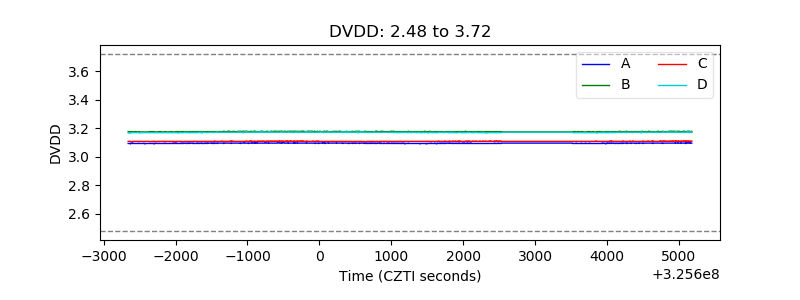 |
| Temperature 1 | 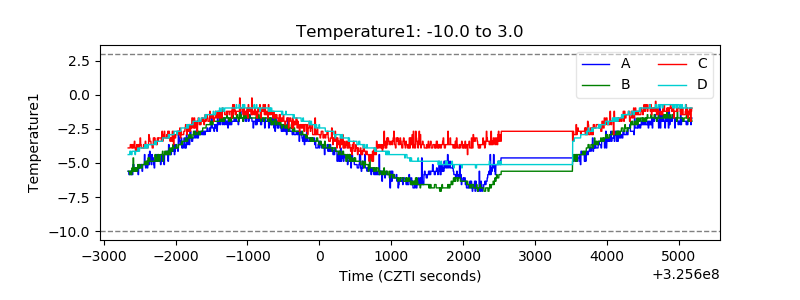 |
| Veto HV Monitor | 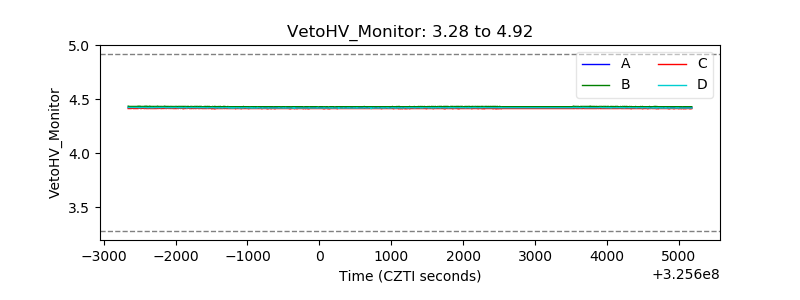 |
| Veto LLD | 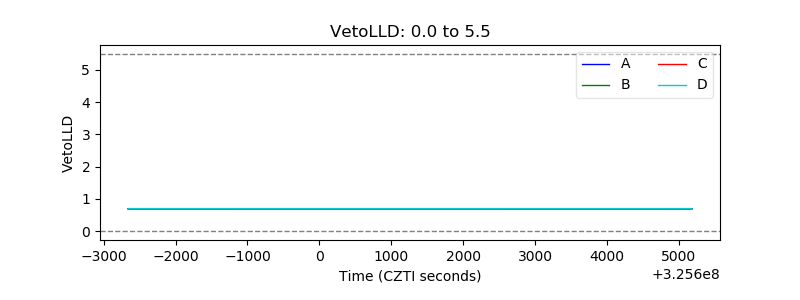 |
| Alpha Counter | 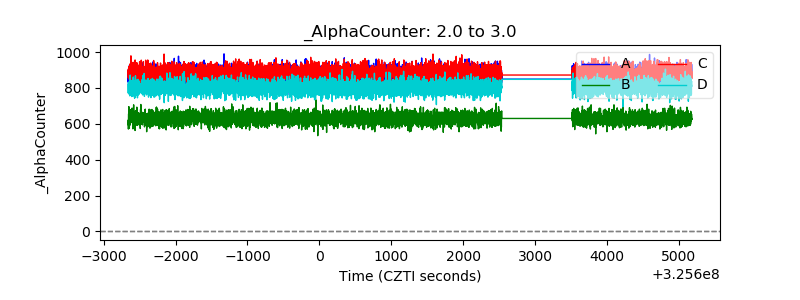 |
| _CPM_Rate | 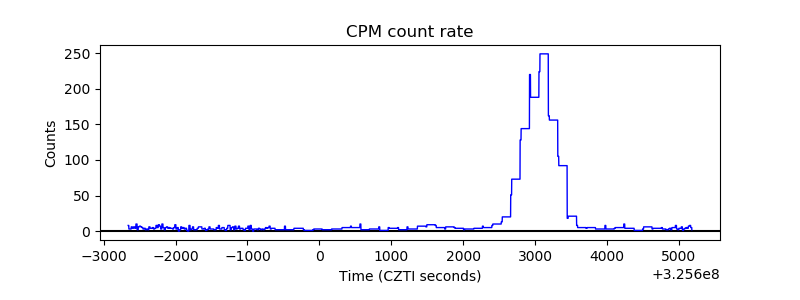 |
| CZT Counter | 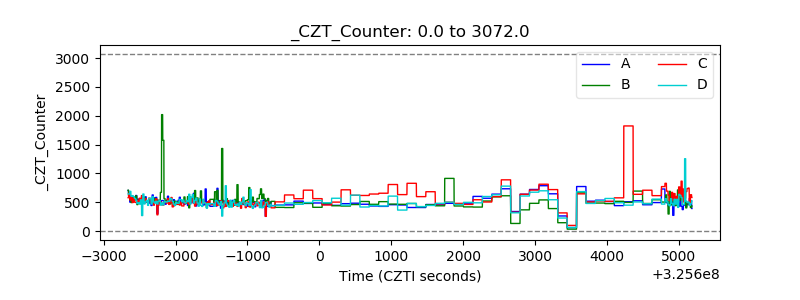 |
| +2.5 Volts monitor |  |
| +5 Volts monitor | 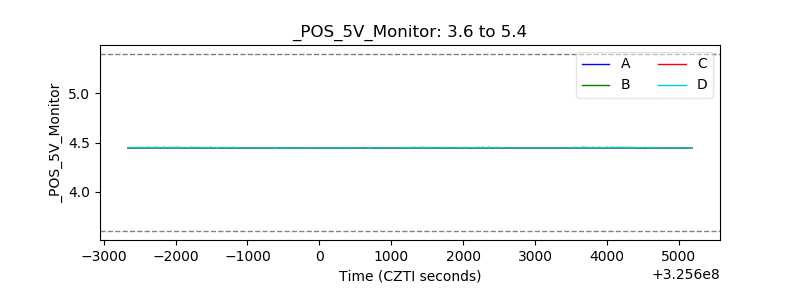 |
| _ROLL_ROT | 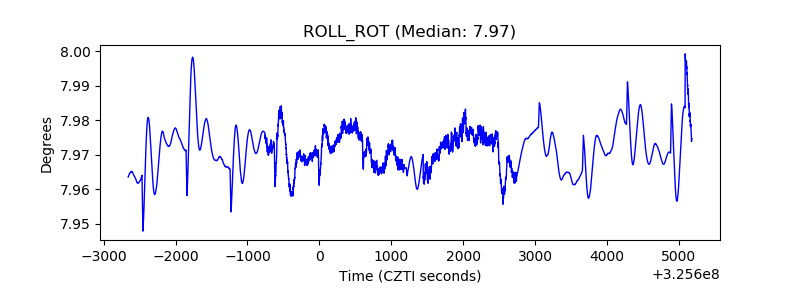 |
| _Roll_DEC | 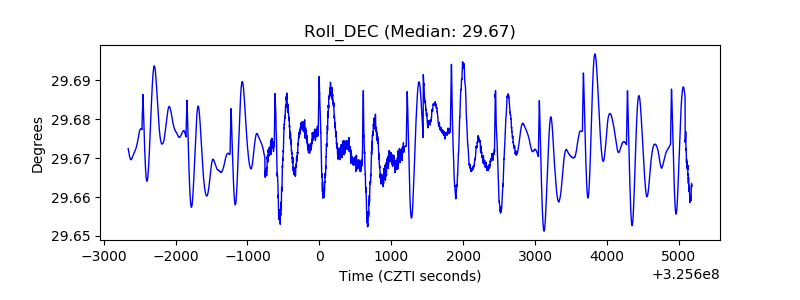 |
| _Roll_RA | 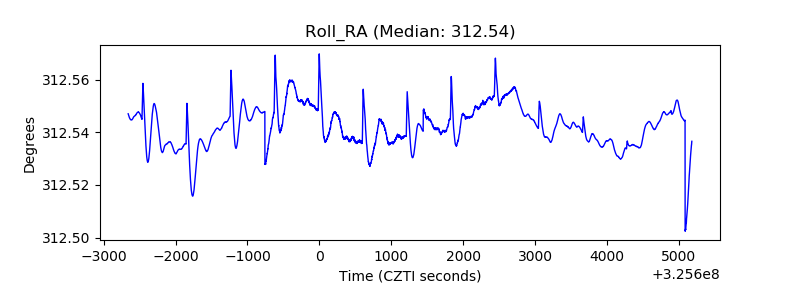 |
| Veto Counter | 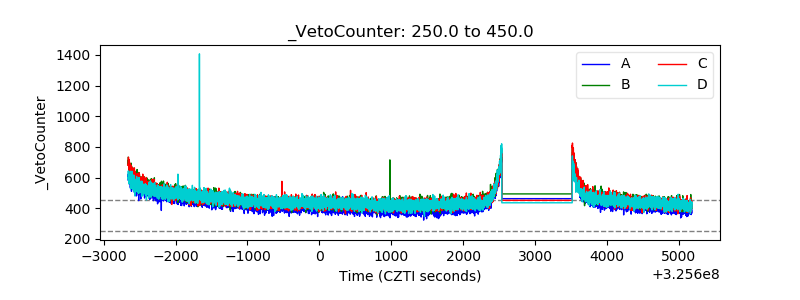 |