| Param | Original file | Final file |
|---|---|---|
| Filename | modeM0/AS1A07_018T08_9000003622_24756cztM0_level2.evt | modeM0/AS1A07_018T08_9000003622_24756cztM0_level2_quad_clean.evt |
| Size (bytes) | 497,188,800 | 76,956,480 |
| Size | 474.2 MB | 73.4 MB |
| Events in quadrant A | 3,443,179 | 466,967 |
| Events in quadrant B | 3,582,937 | 467,736 |
| Events in quadrant C | 3,446,015 | 450,796 |
| Events in quadrant D | 4,100,896 | 448,364 |
| Mode SS | |||
|---|---|---|---|
| Quadrant | BADHDUFLAG | Total packets | Discarded packets |
| A | 0 | 146 | 0 |
| B | 0 | 146 | 0 |
| C | 0 | 146 | 0 |
| D | 0 | 146 | 0 |
| Mode M0 | |||
|---|---|---|---|
| Quadrant | BADHDUFLAG | Total packets | Discarded packets |
| A | 0 | 14672 | 1 |
| B | 0 | 15061 | 1 |
| C | 0 | 14659 | 1 |
| D | 0 | 16949 | 2 |
| Mode M9 | |||
|---|---|---|---|
| Quadrant | BADHDUFLAG | Total packets | Discarded packets |
| A | 0 | 3 | 0 |
| B | 0 | 3 | 0 |
| C | 0 | 3 | 0 |
| D | 0 | 3 | 0 |
| Quadrant | Total seconds | Saturated seconds | Saturation percentage |
|---|---|---|---|
| A | 7122 | 112 | 1.572592% |
| B | 7122 | 156 | 2.190396% |
| C | 7123 | 160 | 2.246245% |
| D | 7122 | 190 | 2.667790% |
Noise dominated data is calculated using 1-second bins in cleaned event files. If a bin has >2000 counts, and if more than 50% of those come from <1% of pixels, then it is considered to be noise-dominated and hence unusable.
| Quadrant | # 1 sec bins | Bins with >0 counts | Bins with >2000 counts | High rate bins dominated by noise | Noise dominated (total time) | Noise dominated (detector-on time) | Marked lightcurve |
|---|---|---|---|---|---|---|---|
| A | 7437 | 7123 | 3 | 3 | 0.04% | 0.04% | 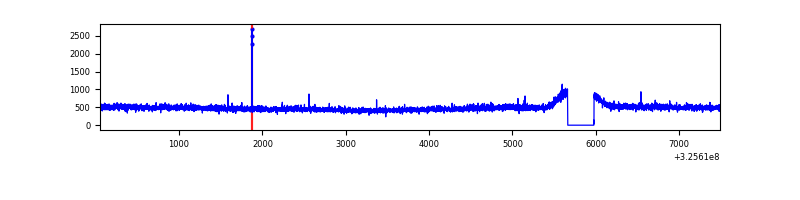 |
| B | 7437 | 7123 | 2 | 2 | 0.03% | 0.03% | 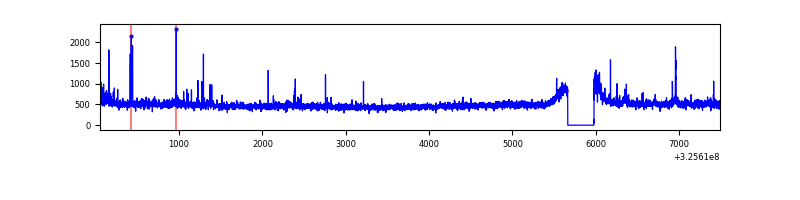 |
| C | 7438 | 7124 | 0 | 0 | 0.00% | 0.00% | 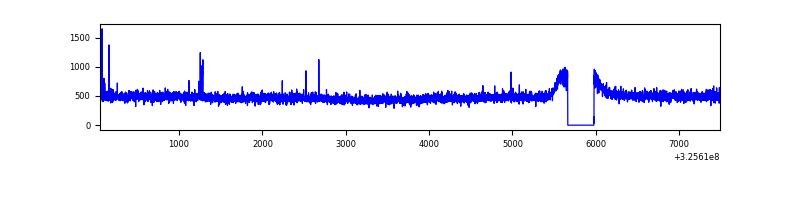 |
| D | 7437 | 7123 | 59 | 59 | 0.79% | 0.83% | 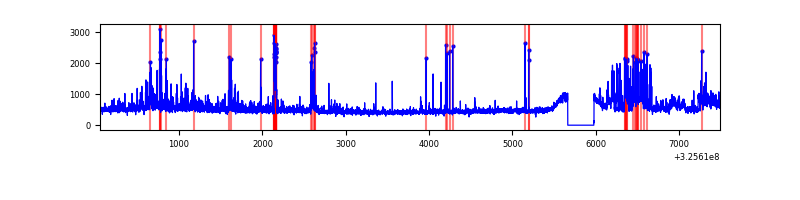 |
Top three noisy pixels from each quadrant. If the there are fewer than three noisy pixels in the level2.evt file, extra rows are filled as -1
| Pixel properties | Quadrant properties | ||||||
|---|---|---|---|---|---|---|---|
| Quadrant | DetID | PixID | Counts | Sigma | Mean | Median | Sigma |
| A | 13 | 254 | 12311 | 63.89 | 889 | 870 | 179.1 |
| A | 12 | 96 | 10700 | 54.9 | 889 | 870 | 179.1 |
| A | 3 | 137 | 8260 | 41.27 | 889 | 870 | 179.1 |
| B | 0 | 189 | 60712 | 351.87 | 876 | 854 | 170.1 |
| B | 3 | 64 | 29574 | 168.83 | 876 | 854 | 170.1 |
| B | 12 | 111 | 20496 | 115.46 | 876 | 854 | 170.1 |
| C | 14 | 238 | 134218 | 671.25 | 842 | 844 | 198.7 |
| C | 2 | 16 | 15652 | 74.53 | 842 | 844 | 198.7 |
| C | 7 | 247 | 12994 | 61.15 | 842 | 844 | 198.7 |
| D | 1 | 52 | 426221 | 2040.83 | 857 | 831 | 208.4 |
| D | 12 | 233 | 211769 | 1011.99 | 857 | 831 | 208.4 |
| D | 8 | 195 | 178872 | 854.16 | 857 | 831 | 208.4 |
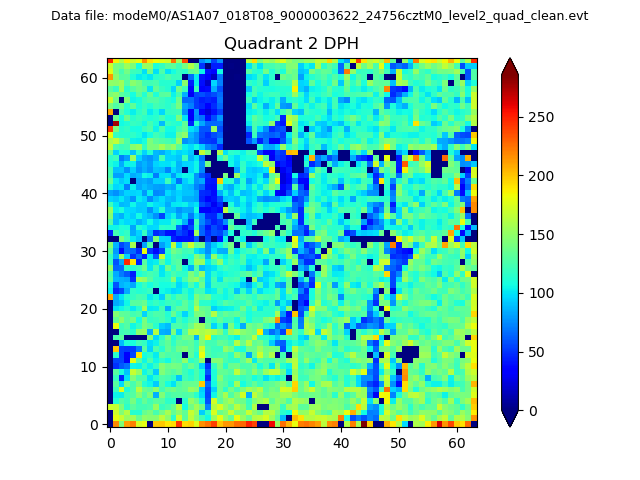
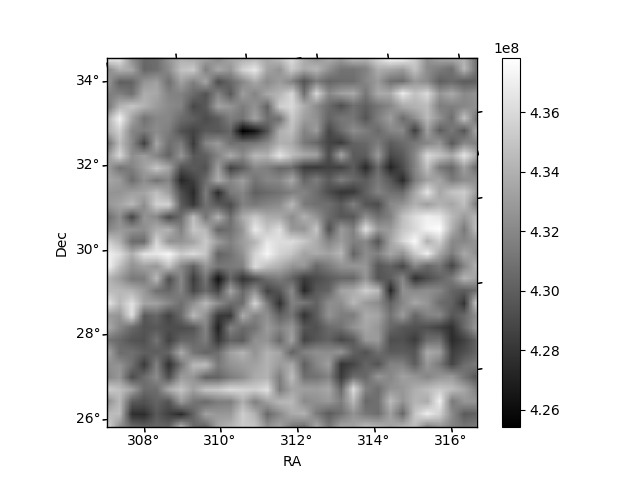
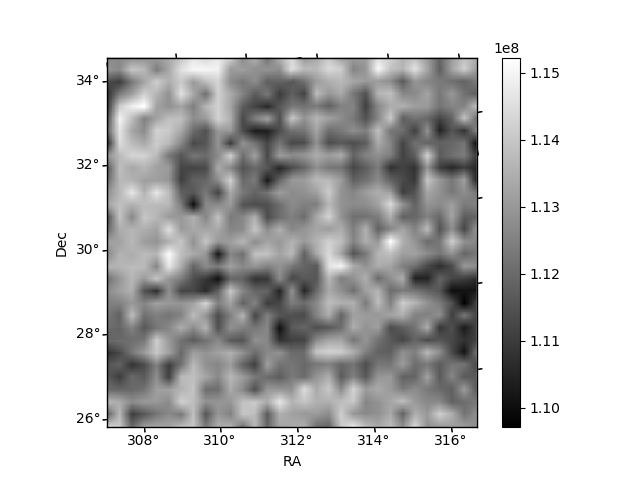
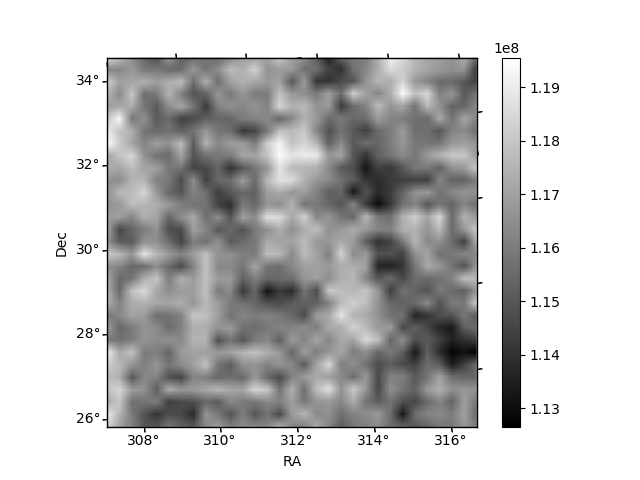
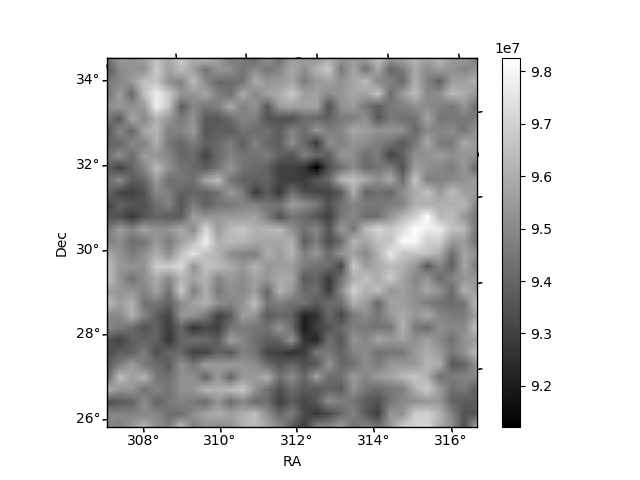
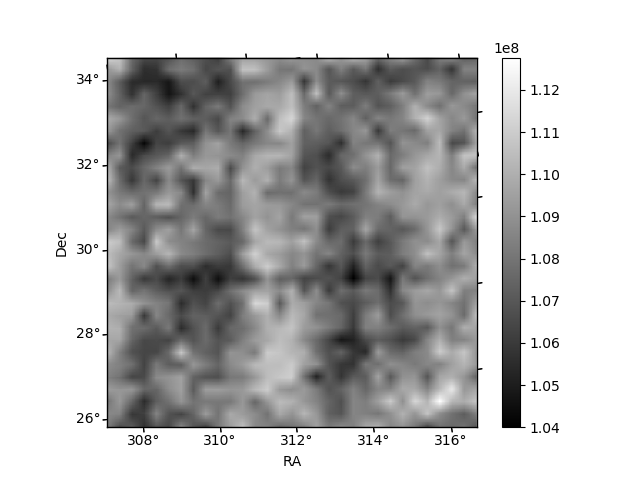
Histogram calculated using DETX and DETY for each event in the final _common_clean file
| Quadrant A | 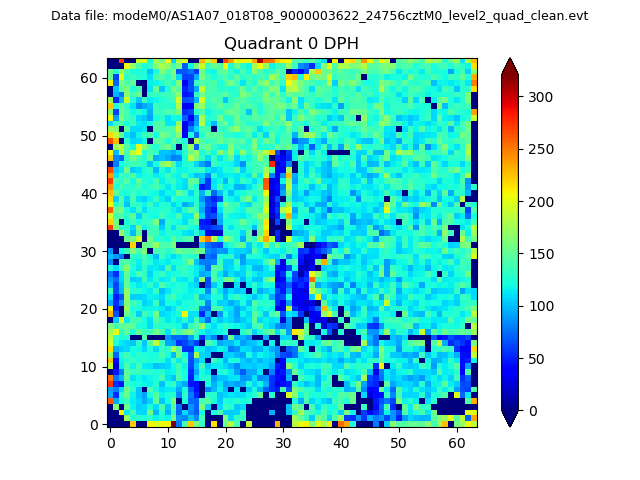 |
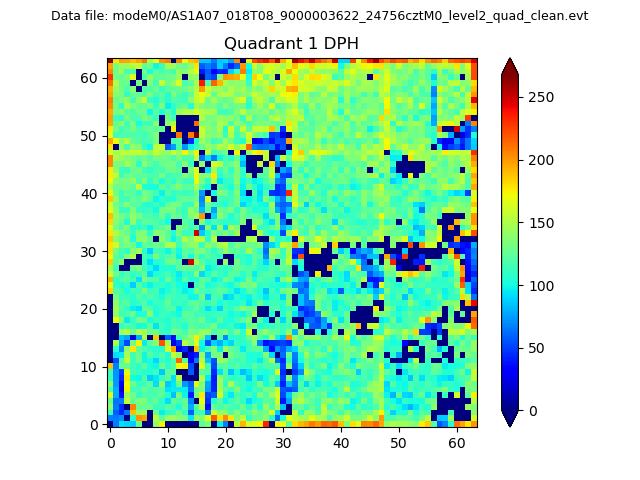 |
Quadrant B |
|---|---|---|---|
| Quadrant D | 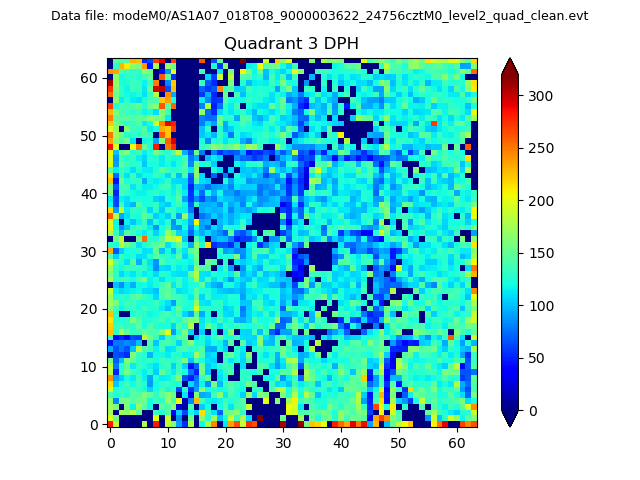 |
 |
Quadrant C |
| Plot type | Count rate plots | Images |
|---|---|---|
| Comparison with Poisson distribution Blue bars denote a histogram of data divided into 1 sec bins. Red curve is a Poisson curve with rate = median count rate of data. |
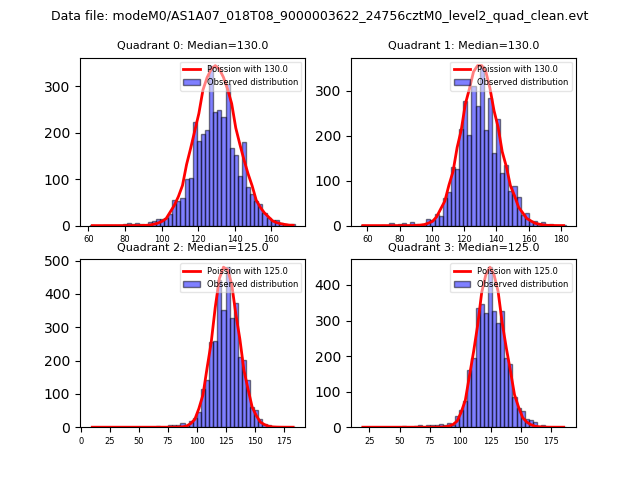 |
 |
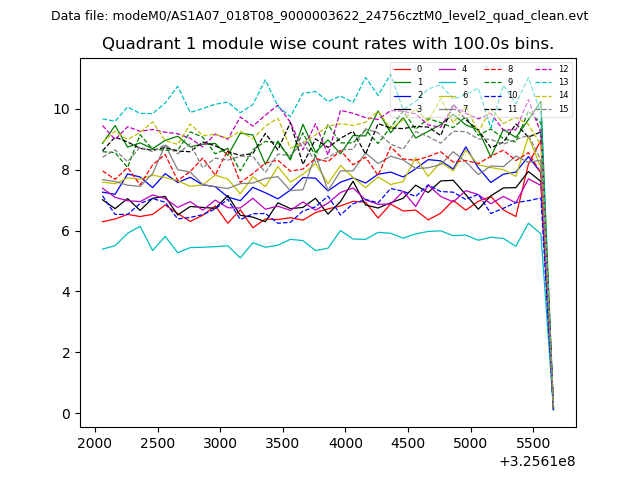
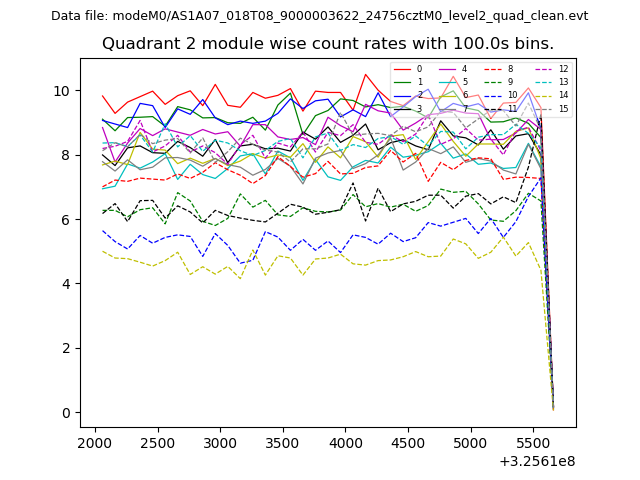
| Quadrant-wise count rates Data is divided into 100 sec bins |
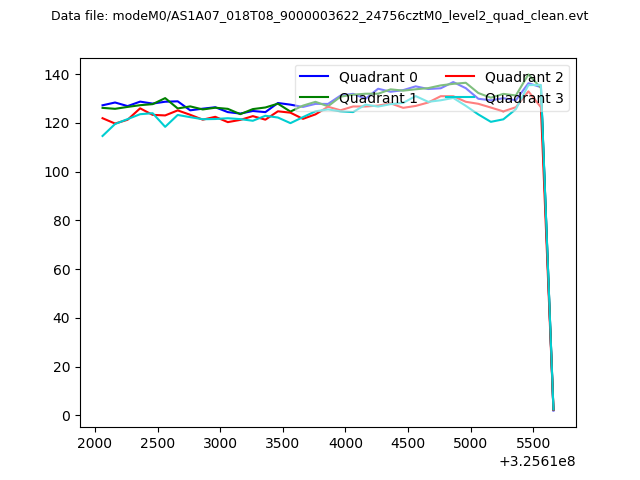 |
|
| Module-wise count rates for Quadrant A Data is divided into 100 sec bins |
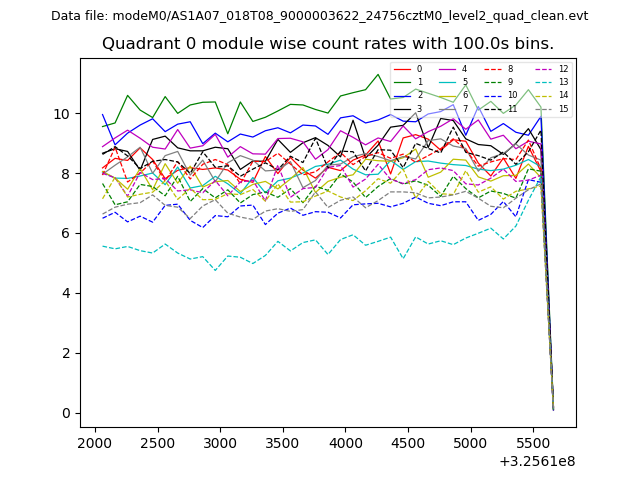 |
 |
| Module-wise count rates for Quadrant B Data is divided into 100 sec bins |
 |
 |
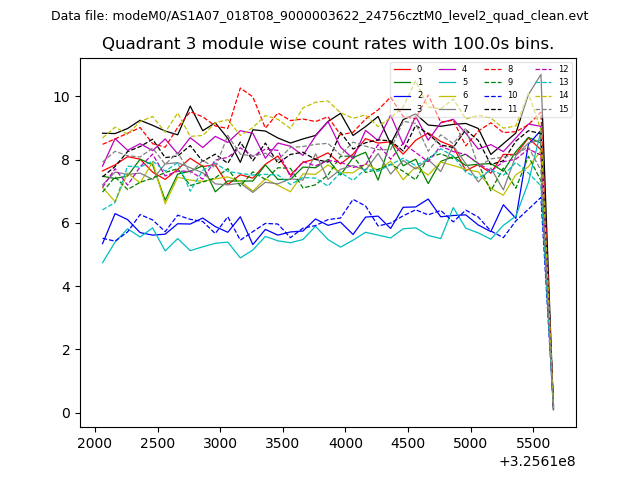
| Module-wise count rates for Quadrant C Data is divided into 100 sec bins |
 |
 |
| Module-wise count rates for Quadrant D Data is divided into 100 sec bins |
 |
 |
| Parameter | Plot |
|---|---|
| CZT HV Monitor | 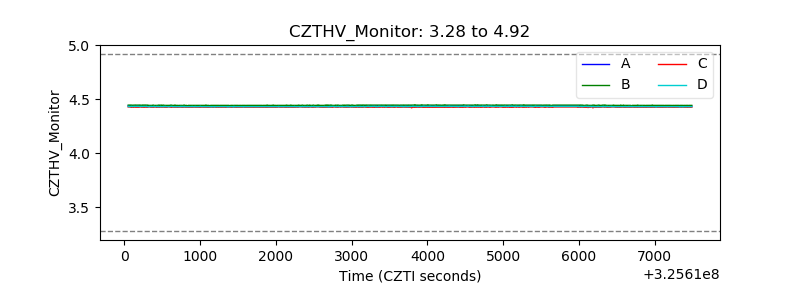 |
| D_VDD | 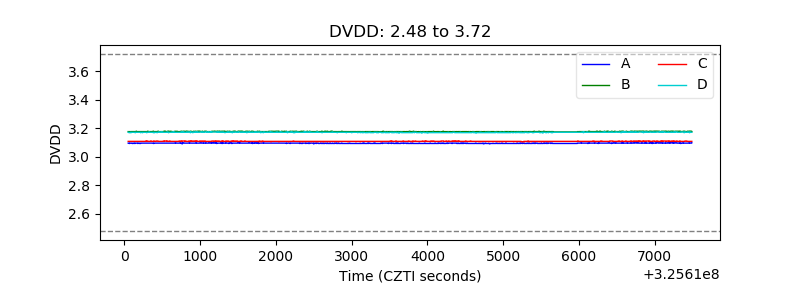 |
| Temperature 1 | 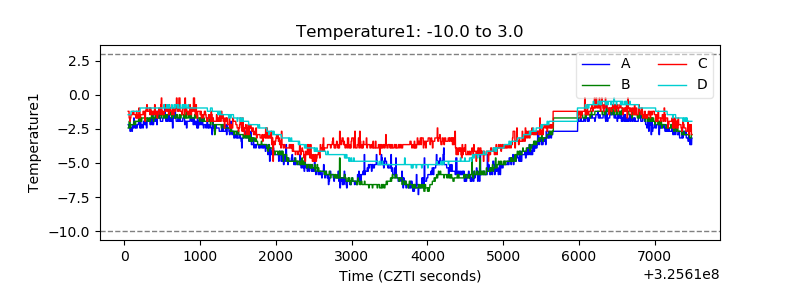 |
| Veto HV Monitor |  |
| Veto LLD | 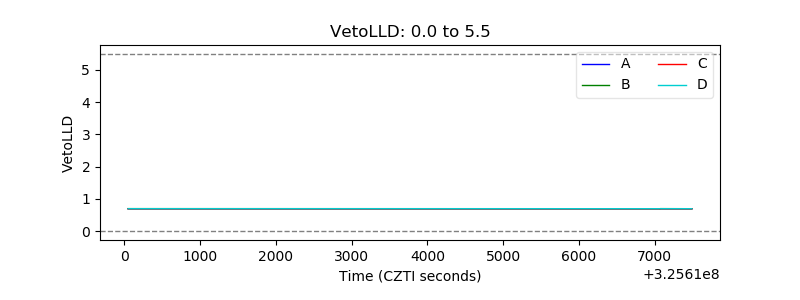 |
| Alpha Counter | 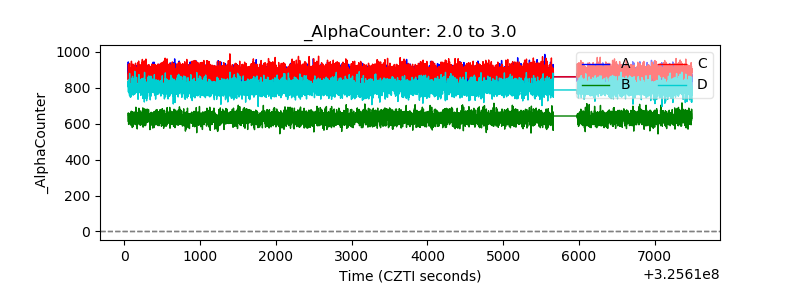 |
| _CPM_Rate | 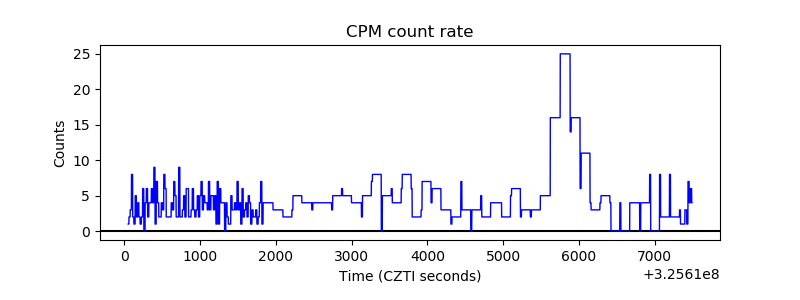 |
| CZT Counter | 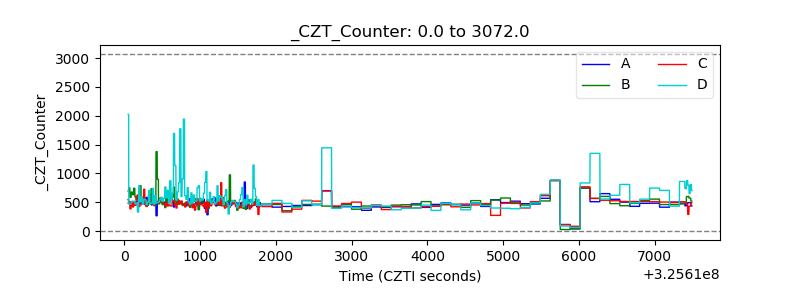 |
| +2.5 Volts monitor |  |
| +5 Volts monitor |  |
| _ROLL_ROT | 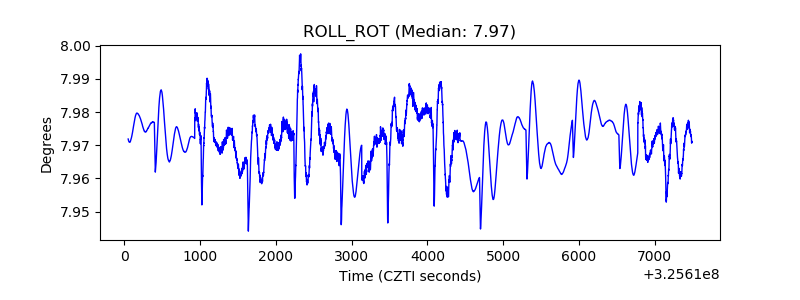 |
| _Roll_DEC | 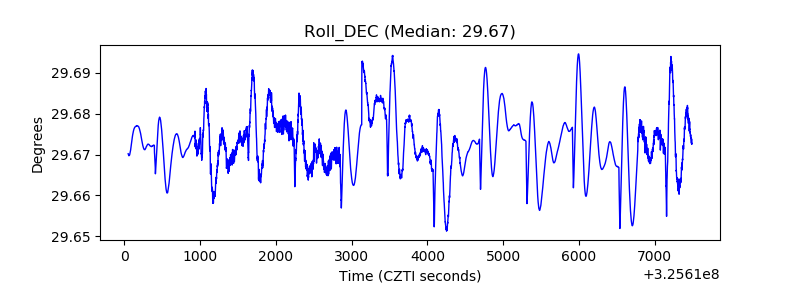 |
| _Roll_RA | 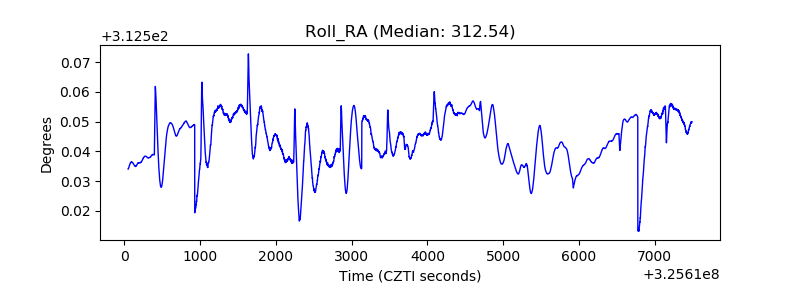 |
| Veto Counter | 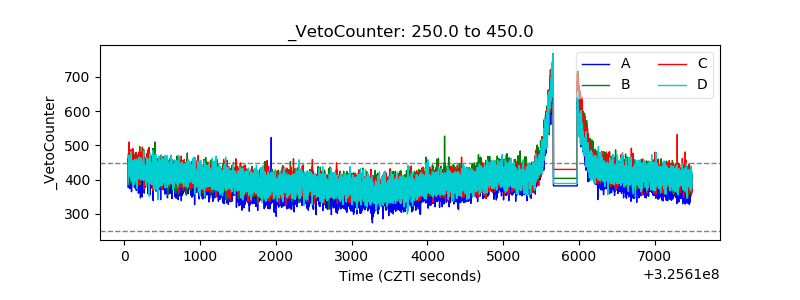 |