| Param | Original file | Final file |
|---|---|---|
| Filename | modeM0/AS1A07_018T08_9000003622_24757cztM0_level2.evt | modeM0/AS1A07_018T08_9000003622_24757cztM0_level2_quad_clean.evt |
| Size (bytes) | 565,790,400 | 84,139,200 |
| Size | 539.6 MB | 80.2 MB |
| Events in quadrant A | 3,853,351 | 510,050 |
| Events in quadrant B | 4,179,824 | 511,982 |
| Events in quadrant C | 3,884,526 | 493,200 |
| Events in quadrant D | 4,687,666 | 490,007 |
| Mode SS | |||
|---|---|---|---|
| Quadrant | BADHDUFLAG | Total packets | Discarded packets |
| A | 0 | 160 | 0 |
| B | 0 | 160 | 0 |
| C | 0 | 160 | 0 |
| D | 0 | 160 | 0 |
| Mode M0 | |||
|---|---|---|---|
| Quadrant | BADHDUFLAG | Total packets | Discarded packets |
| A | 0 | 16374 | 3 |
| B | 0 | 17330 | 3 |
| C | 0 | 16424 | 3 |
| D | 0 | 19106 | 6 |
| Mode M9 | |||
|---|---|---|---|
| Quadrant | BADHDUFLAG | Total packets | Discarded packets |
| A | 0 | 6 | 0 |
| B | 0 | 6 | 0 |
| C | 0 | 6 | 0 |
| D | 0 | 6 | 0 |
| Quadrant | Total seconds | Saturated seconds | Saturation percentage |
|---|---|---|---|
| A | 7802 | 217 | 2.781338% |
| B | 7803 | 341 | 4.370114% |
| C | 7803 | 310 | 3.972831% |
| D | 7802 | 288 | 3.691361% |
Noise dominated data is calculated using 1-second bins in cleaned event files. If a bin has >2000 counts, and if more than 50% of those come from <1% of pixels, then it is considered to be noise-dominated and hence unusable.
| Quadrant | # 1 sec bins | Bins with >0 counts | Bins with >2000 counts | High rate bins dominated by noise | Noise dominated (total time) | Noise dominated (detector-on time) | Marked lightcurve |
|---|---|---|---|---|---|---|---|
| A | 8407 | 7805 | 0 | 0 | 0.00% | 0.00% | 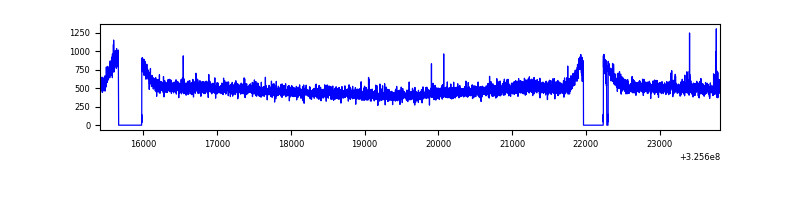 |
| B | 8408 | 7806 | 9 | 9 | 0.11% | 0.12% | 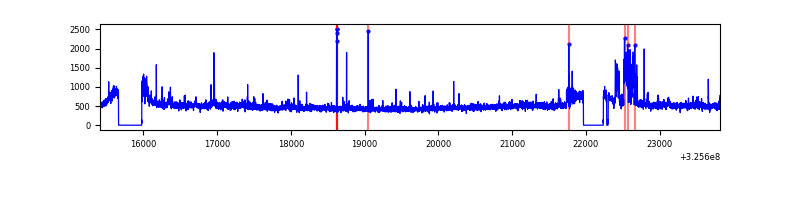 |
| C | 8408 | 7806 | 3 | 3 | 0.04% | 0.04% | 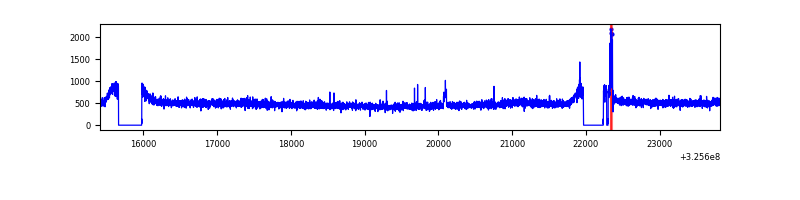 |
| D | 8407 | 7805 | 53 | 53 | 0.63% | 0.68% | 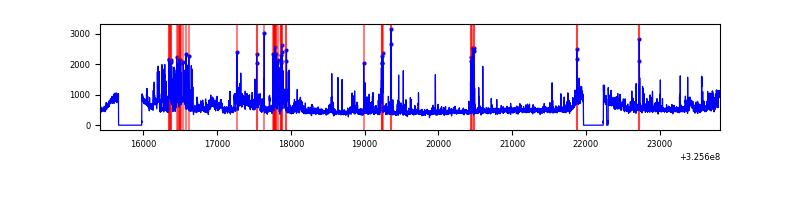 |
Top three noisy pixels from each quadrant. If the there are fewer than three noisy pixels in the level2.evt file, extra rows are filled as -1
| Pixel properties | Quadrant properties | ||||||
|---|---|---|---|---|---|---|---|
| Quadrant | DetID | PixID | Counts | Sigma | Mean | Median | Sigma |
| A | 12 | 96 | 15648 | 72.97 | 993 | 970 | 201.2 |
| A | 13 | 254 | 13767 | 63.62 | 993 | 970 | 201.2 |
| A | 3 | 137 | 9158 | 40.7 | 993 | 970 | 201.2 |
| B | 15 | 33 | 176493 | 930.89 | 978 | 953 | 188.6 |
| B | 0 | 189 | 66714 | 348.73 | 978 | 953 | 188.6 |
| B | 5 | 172 | 33994 | 175.22 | 978 | 953 | 188.6 |
| C | 14 | 238 | 147933 | 660.96 | 940 | 944 | 222.4 |
| C | 2 | 16 | 45569 | 200.66 | 940 | 944 | 222.4 |
| C | 7 | 247 | 17113 | 72.7 | 940 | 944 | 222.4 |
| D | 1 | 52 | 673703 | 2850.31 | 964 | 932 | 236.0 |
| D | 8 | 195 | 156401 | 658.67 | 964 | 932 | 236.0 |
| D | 12 | 233 | 83283 | 348.89 | 964 | 932 | 236.0 |
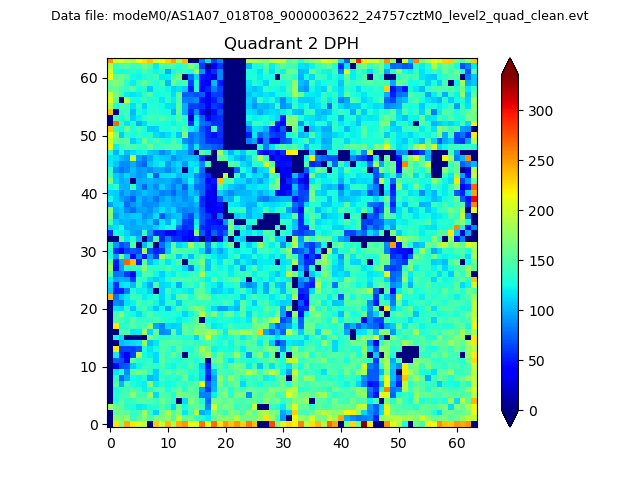
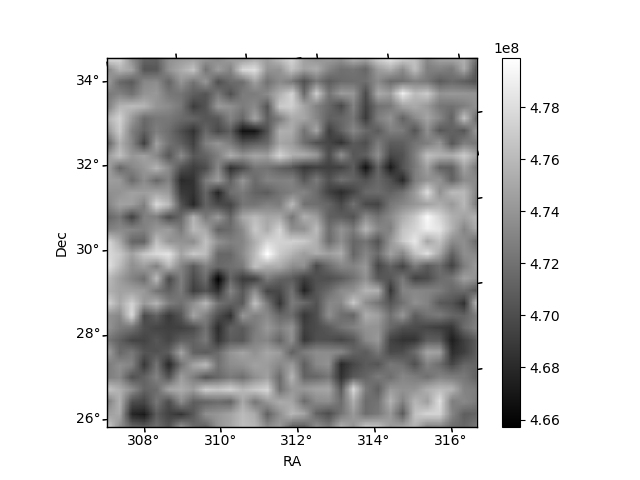
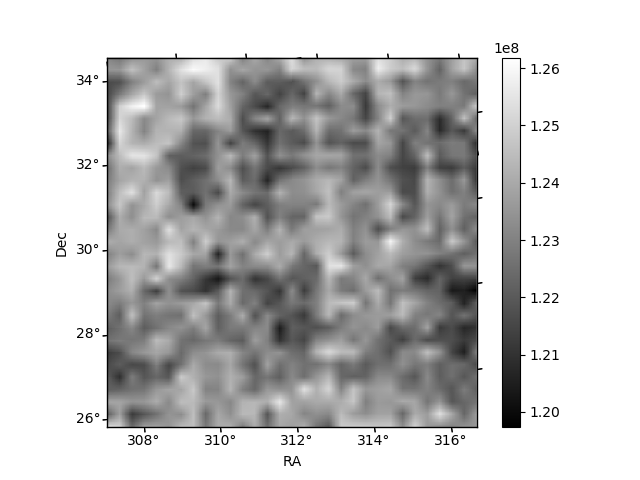
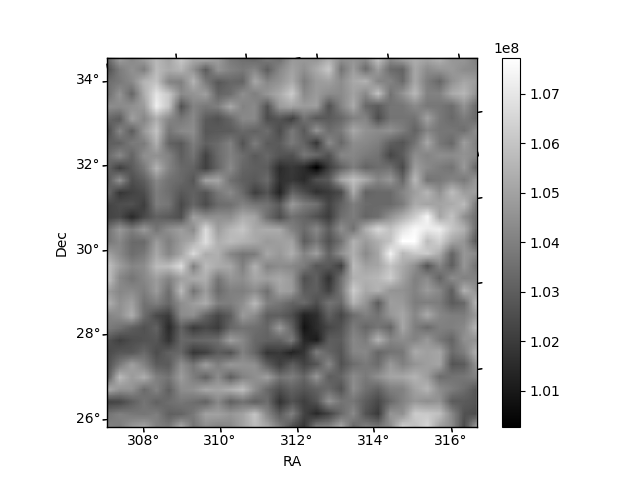
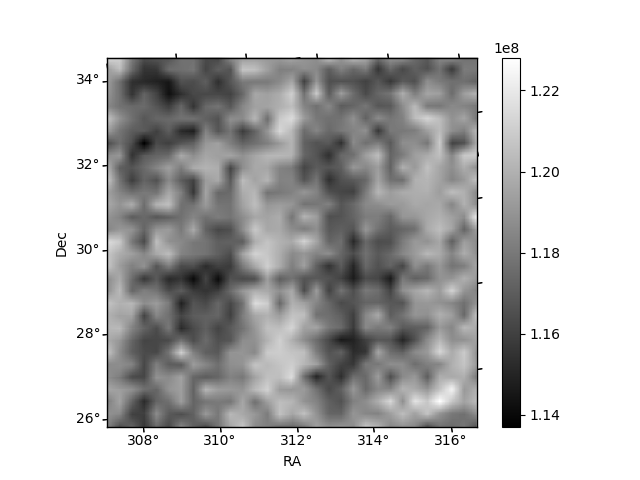
Histogram calculated using DETX and DETY for each event in the final _common_clean file
| Quadrant A | 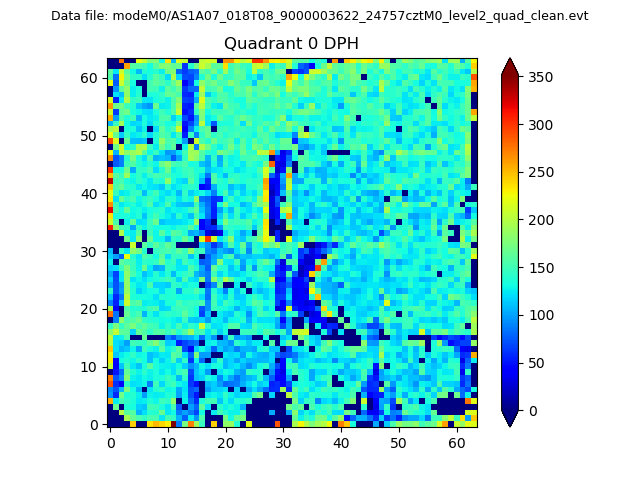 |
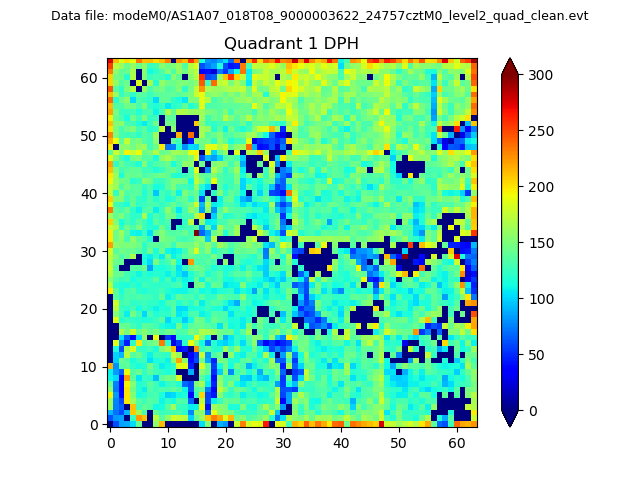 |
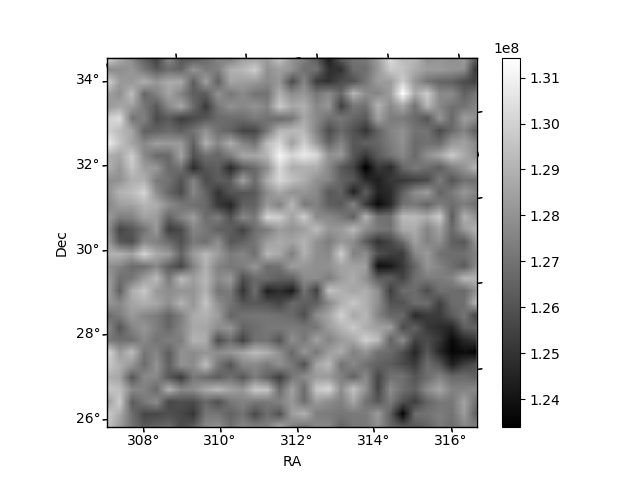
Quadrant B |
|---|---|---|---|
| Quadrant D | 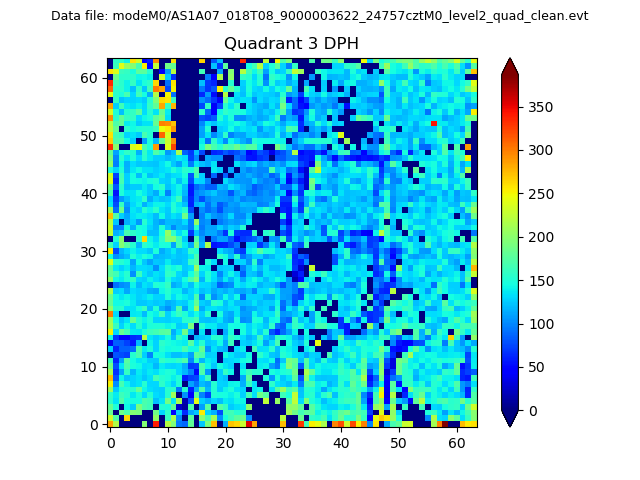 |
 |
Quadrant C |
| Plot type | Count rate plots | Images |
|---|---|---|
| Comparison with Poisson distribution Blue bars denote a histogram of data divided into 1 sec bins. Red curve is a Poisson curve with rate = median count rate of data. |
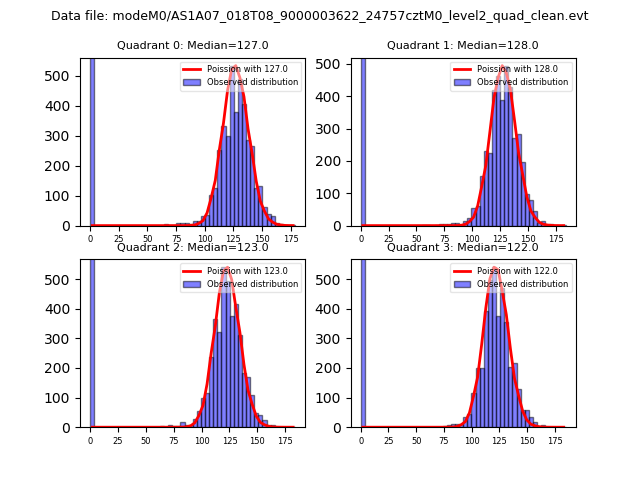 |
 |
| Quadrant-wise count rates Data is divided into 100 sec bins |
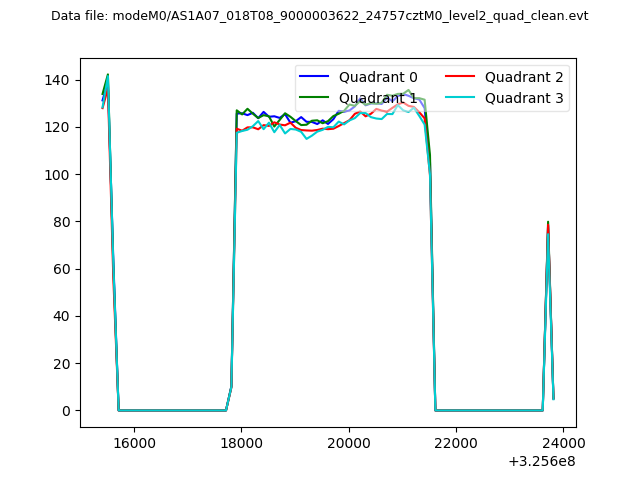 |
|
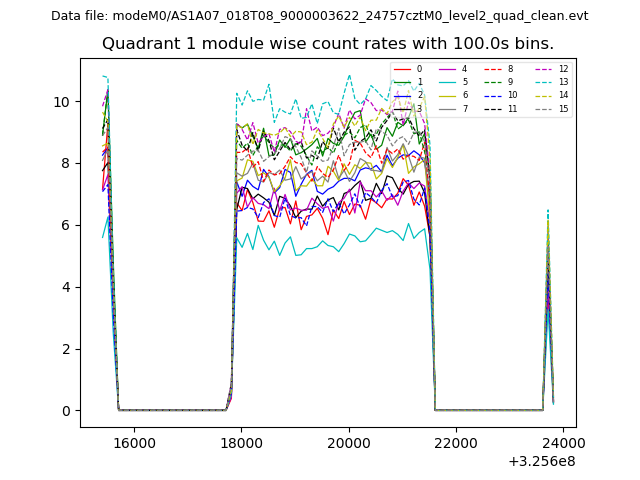
| Module-wise count rates for Quadrant A Data is divided into 100 sec bins |
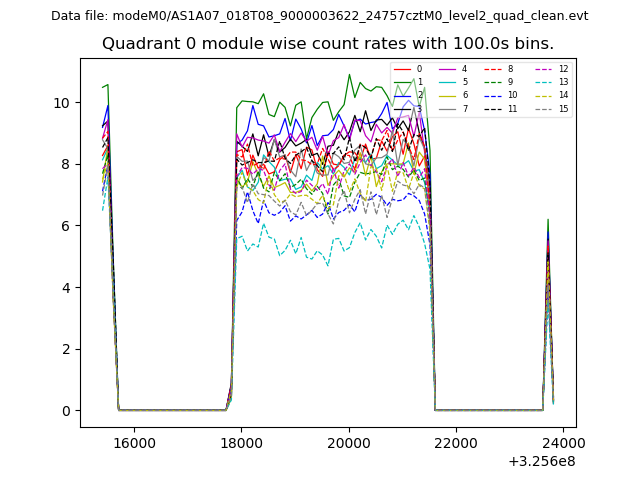 |
 |
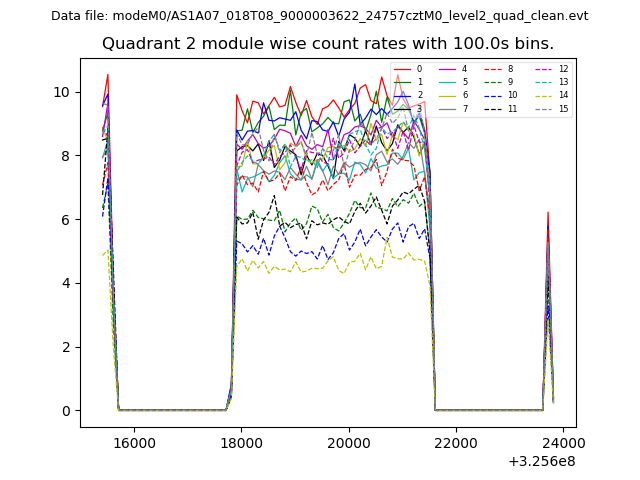
| Module-wise count rates for Quadrant B Data is divided into 100 sec bins |
 |
 |
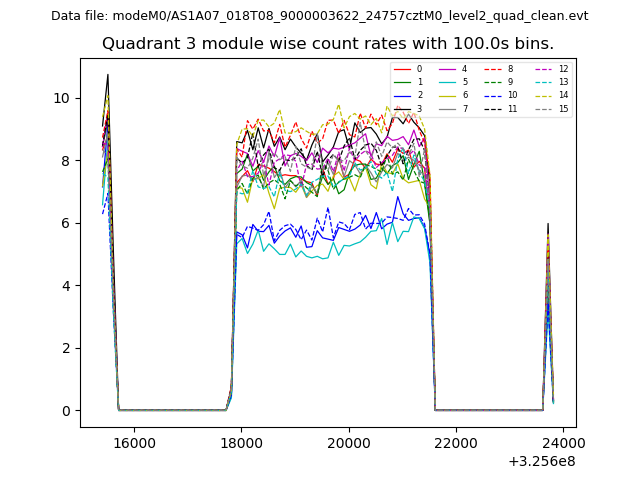
| Module-wise count rates for Quadrant C Data is divided into 100 sec bins |
 |
 |
| Module-wise count rates for Quadrant D Data is divided into 100 sec bins |
 |
 |
| Parameter | Plot |
|---|---|
| CZT HV Monitor | 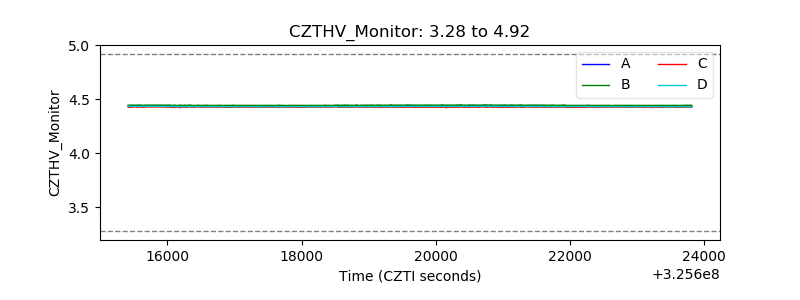 |
| D_VDD | 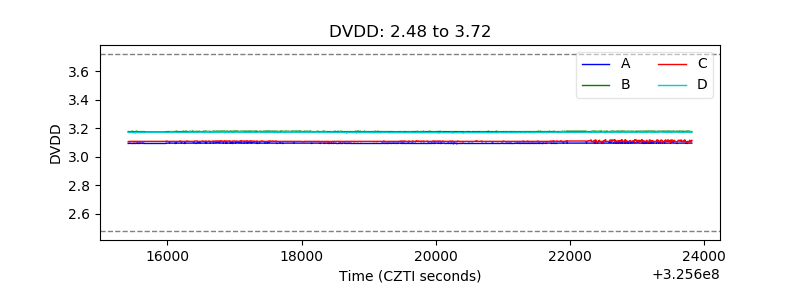 |
| Temperature 1 | 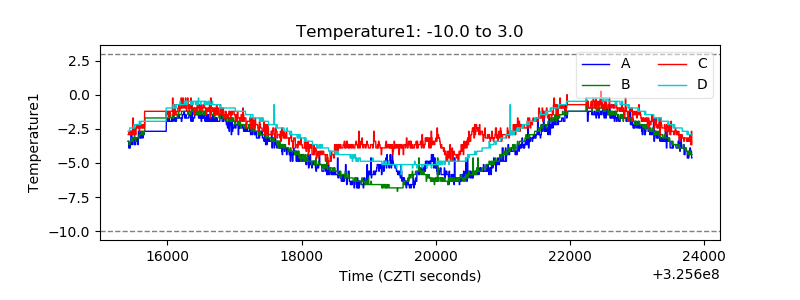 |
| Veto HV Monitor | 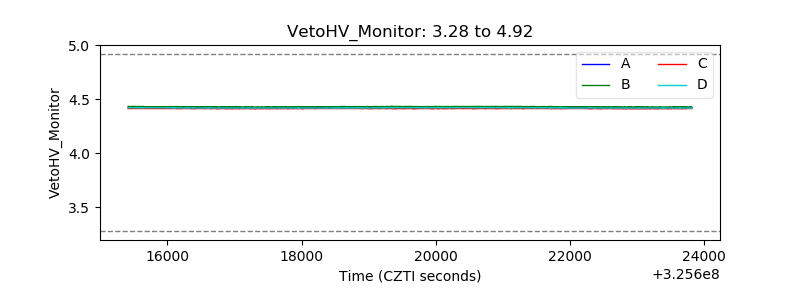 |
| Veto LLD | 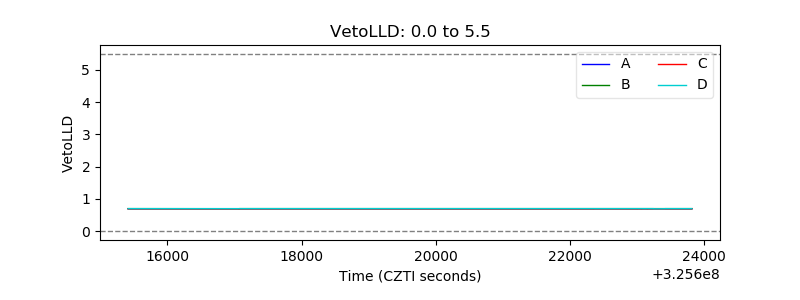 |
| Alpha Counter | 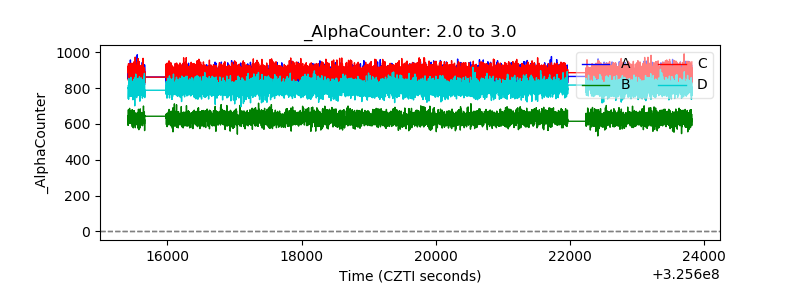 |
| _CPM_Rate |  |
| CZT Counter | 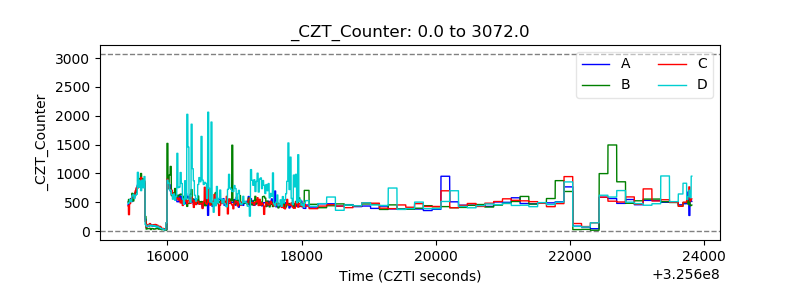 |
| +2.5 Volts monitor |  |
| +5 Volts monitor |  |
| _ROLL_ROT | 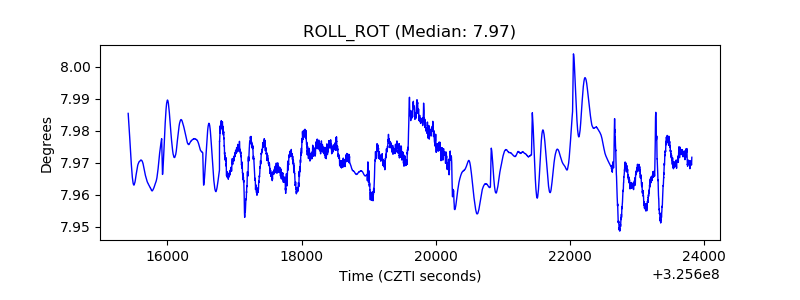 |
| _Roll_DEC | 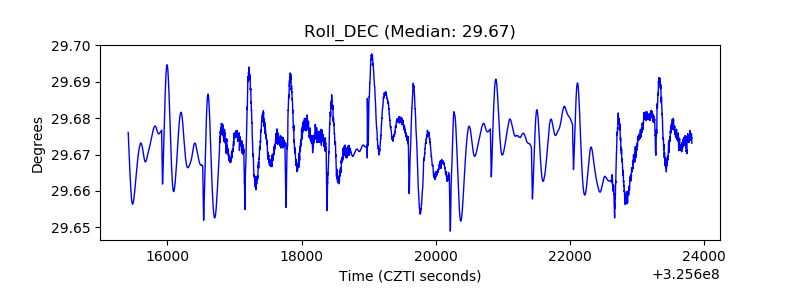 |
| _Roll_RA | 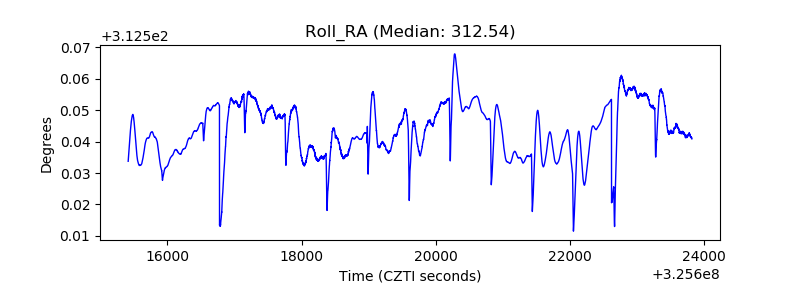 |
| Veto Counter | 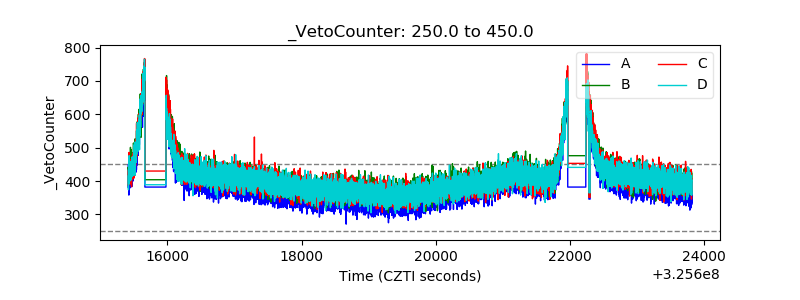 |