| Param | Original file | Final file |
|---|---|---|
| Filename | modeM0/AS1A07_018T08_9000003622_24760cztM0_level2.evt | modeM0/AS1A07_018T08_9000003622_24760cztM0_level2_quad_clean.evt |
| Size (bytes) | 953,642,880 | 161,219,520 |
| Size | 909.5 MB | 153.8 MB |
| Events in quadrant A | 6,325,021 | 1,013,077 |
| Events in quadrant B | 7,447,789 | 1,006,656 |
| Events in quadrant C | 6,518,668 | 981,703 |
| Events in quadrant D | 7,698,436 | 971,459 |
| Mode SS | |||
|---|---|---|---|
| Quadrant | BADHDUFLAG | Total packets | Discarded packets |
| A | 0 | 270 | 0 |
| B | 0 | 270 | 0 |
| C | 0 | 270 | 0 |
| D | 0 | 270 | 0 |
| Mode M0 | |||
|---|---|---|---|
| Quadrant | BADHDUFLAG | Total packets | Discarded packets |
| A | 0 | 27251 | 0 |
| B | 0 | 30729 | 0 |
| C | 0 | 27579 | 0 |
| D | 0 | 31764 | 0 |
| Mode M9 | |||
|---|---|---|---|
| Quadrant | BADHDUFLAG | Total packets | Discarded packets |
| A | 0 | 14 | 0 |
| B | 0 | 14 | 0 |
| C | 0 | 14 | 0 |
| D | 0 | 14 | 0 |
| Quadrant | Total seconds | Saturated seconds | Saturation percentage |
|---|---|---|---|
| A | 13165 | 179 | 1.359666% |
| B | 13166 | 492 | 3.736898% |
| C | 13166 | 311 | 2.362145% |
| D | 13166 | 478 | 3.630564% |
Noise dominated data is calculated using 1-second bins in cleaned event files. If a bin has >2000 counts, and if more than 50% of those come from <1% of pixels, then it is considered to be noise-dominated and hence unusable.
| Quadrant | # 1 sec bins | Bins with >0 counts | Bins with >2000 counts | High rate bins dominated by noise | Noise dominated (total time) | Noise dominated (detector-on time) | Marked lightcurve |
|---|---|---|---|---|---|---|---|
| A | 14595 | 13169 | 0 | 0 | 0.00% | 0.00% |  |
| B | 14596 | 13170 | 154 | 154 | 1.06% | 1.17% | 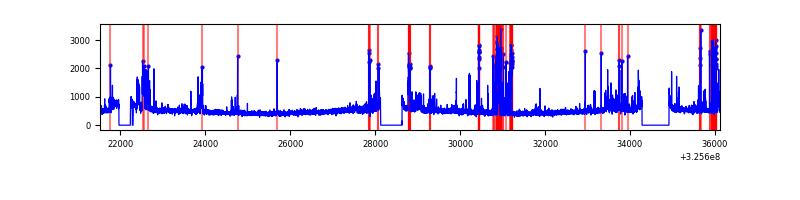 |
| C | 14596 | 13170 | 7 | 7 | 0.05% | 0.05% | 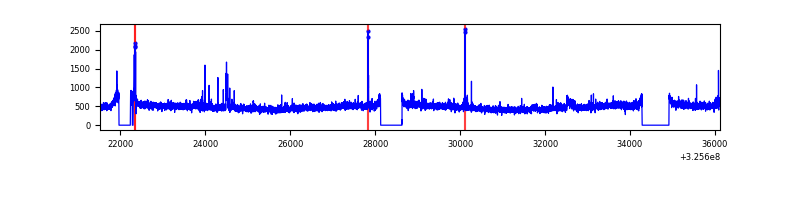 |
| D | 14596 | 13170 | 141 | 141 | 0.97% | 1.07% | 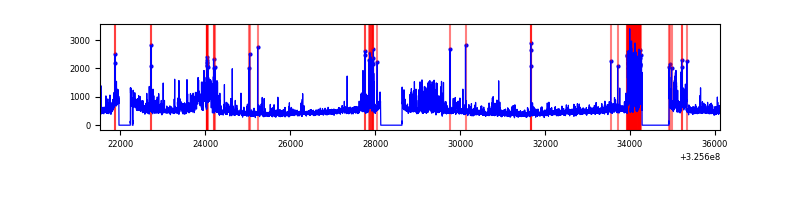 |
Top three noisy pixels from each quadrant. If the there are fewer than three noisy pixels in the level2.evt file, extra rows are filled as -1
| Pixel properties | Quadrant properties | ||||||
|---|---|---|---|---|---|---|---|
| Quadrant | DetID | PixID | Counts | Sigma | Mean | Median | Sigma |
| A | 12 | 96 | 50405 | 148.63 | 1625 | 1591 | 328.4 |
| A | 13 | 254 | 22122 | 62.51 | 1625 | 1591 | 328.4 |
| A | 3 | 137 | 14857 | 40.39 | 1625 | 1591 | 328.4 |
| B | 3 | 64 | 592711 | 1935.09 | 1596 | 1552 | 305.5 |
| B | 15 | 33 | 195818 | 635.9 | 1596 | 1552 | 305.5 |
| B | 0 | 189 | 130546 | 422.24 | 1596 | 1552 | 305.5 |
| C | 14 | 238 | 243977 | 672.97 | 1542 | 1549 | 360.2 |
| C | 2 | 16 | 147226 | 404.39 | 1542 | 1549 | 360.2 |
| C | 7 | 247 | 57920 | 156.48 | 1542 | 1549 | 360.2 |
| D | 12 | 233 | 559723 | 1463.59 | 1565 | 1514 | 381.4 |
| D | 1 | 52 | 445061 | 1162.95 | 1565 | 1514 | 381.4 |
| D | 7 | 238 | 335873 | 876.67 | 1565 | 1514 | 381.4 |
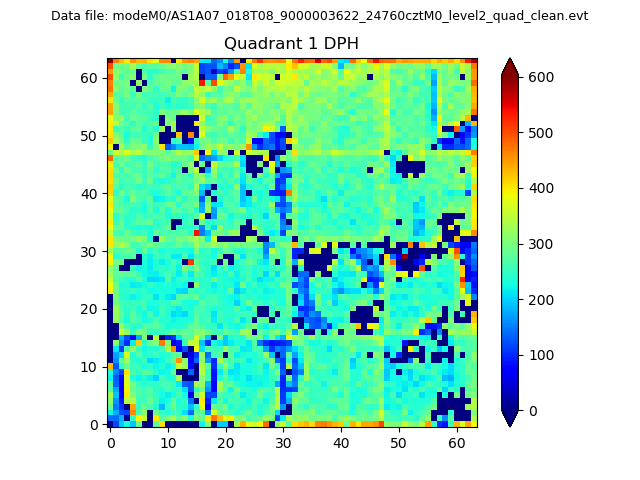
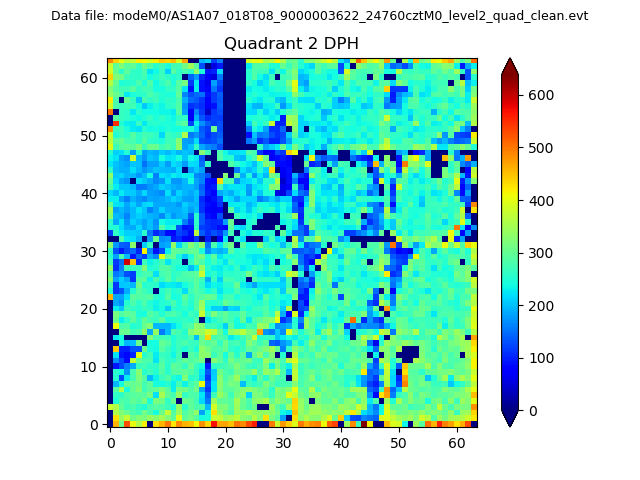
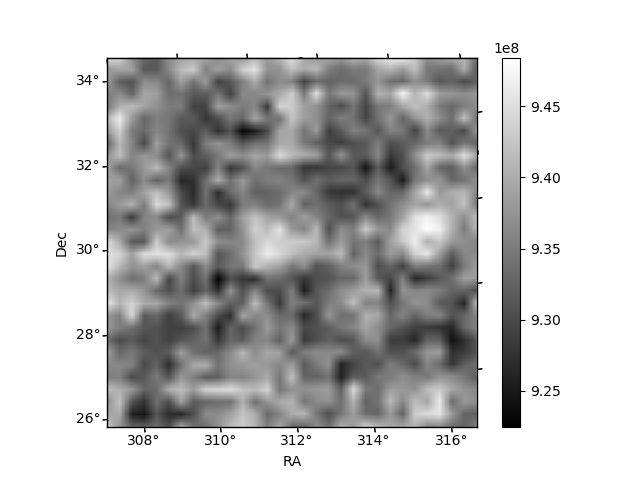
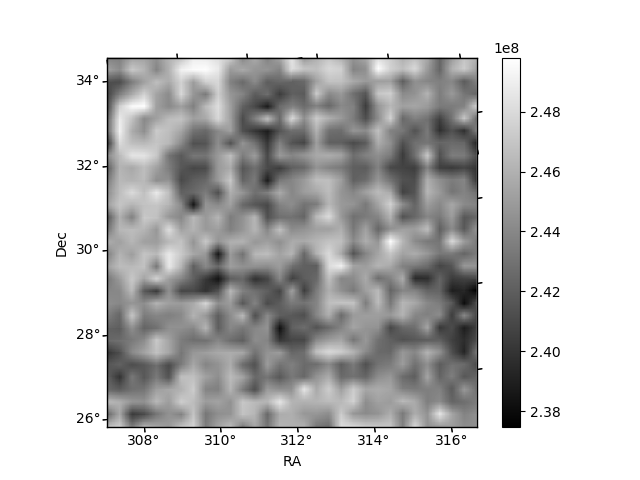
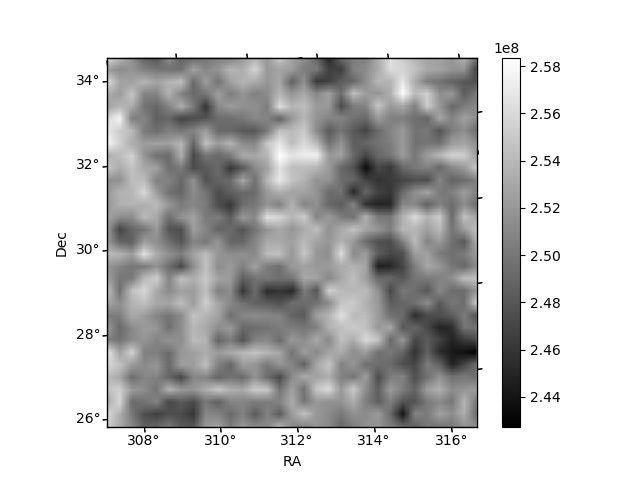
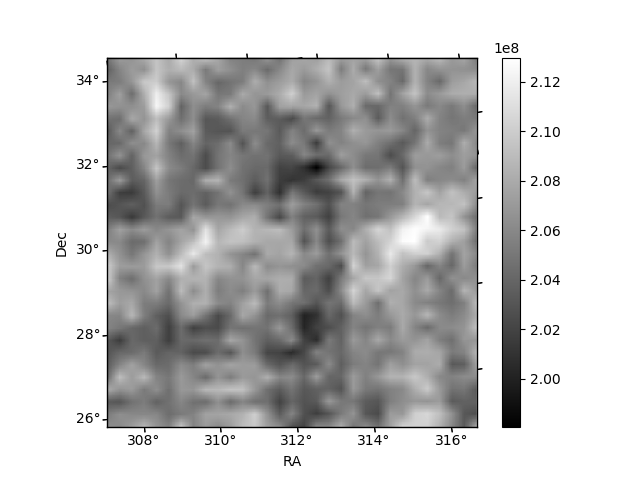
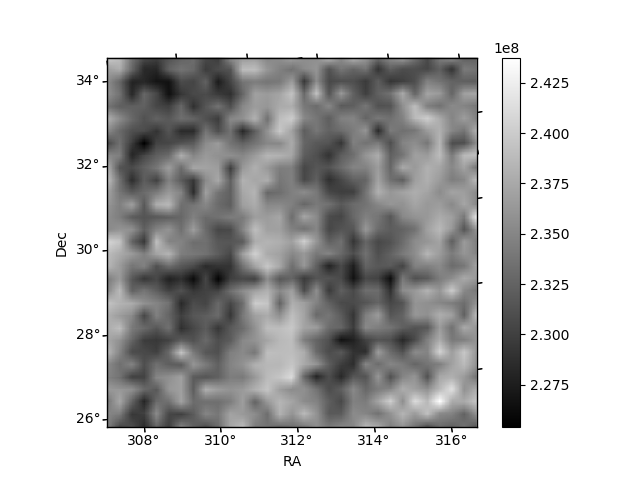
Histogram calculated using DETX and DETY for each event in the final _common_clean file
| Quadrant A | 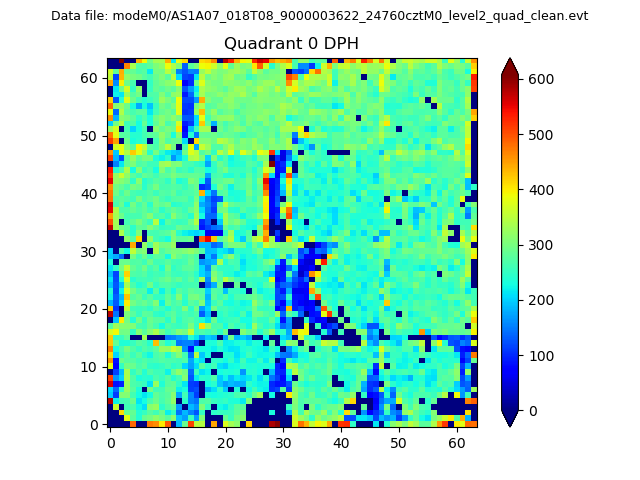 |
 |
Quadrant B |
|---|---|---|---|
| Quadrant D | 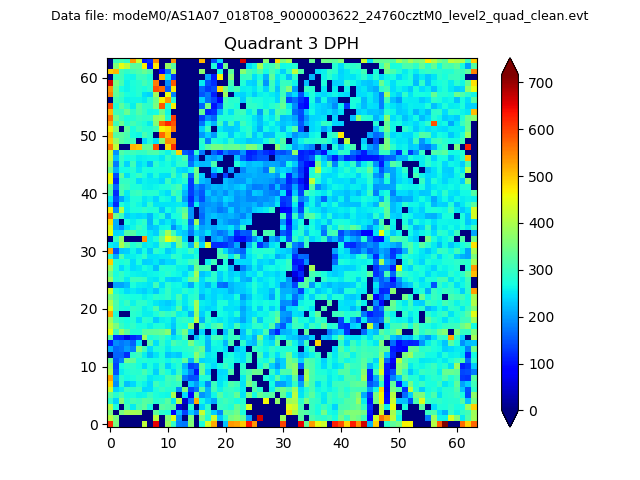 |
 |
Quadrant C |
| Plot type | Count rate plots | Images |
|---|---|---|
| Comparison with Poisson distribution Blue bars denote a histogram of data divided into 1 sec bins. Red curve is a Poisson curve with rate = median count rate of data. |
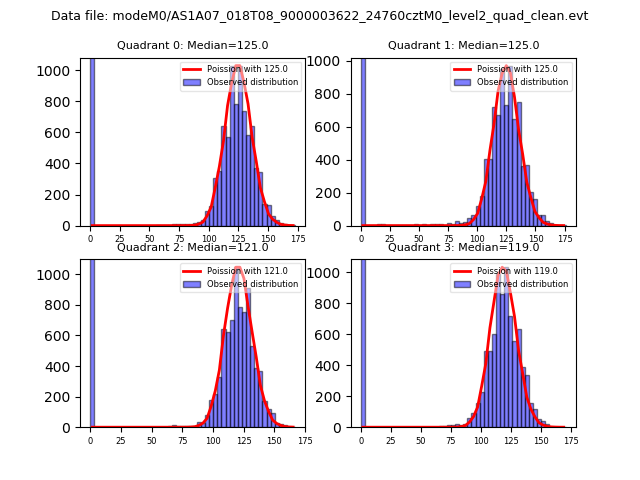 |
 |
| Quadrant-wise count rates Data is divided into 100 sec bins |
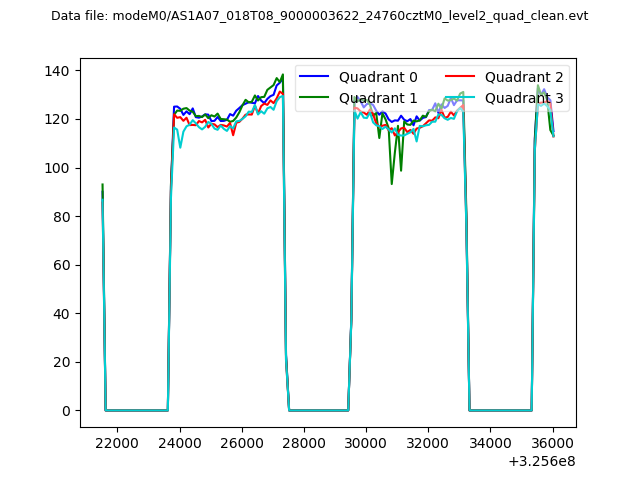 |
|
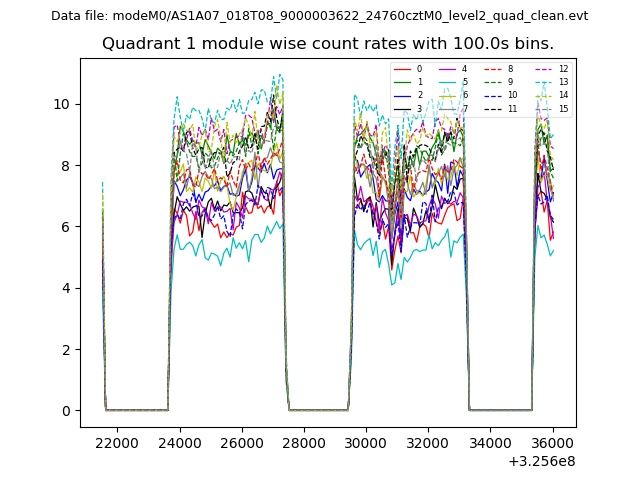
| Module-wise count rates for Quadrant A Data is divided into 100 sec bins |
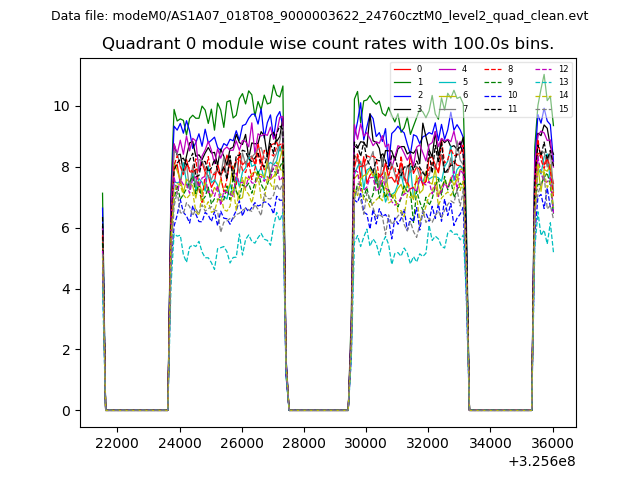 |
 |
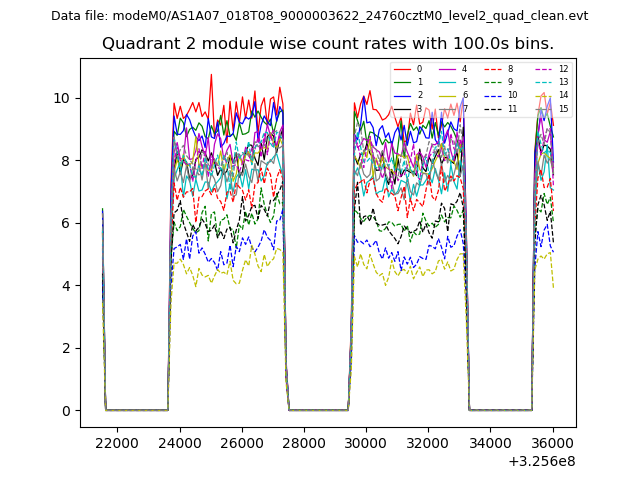
| Module-wise count rates for Quadrant B Data is divided into 100 sec bins |
 |
 |
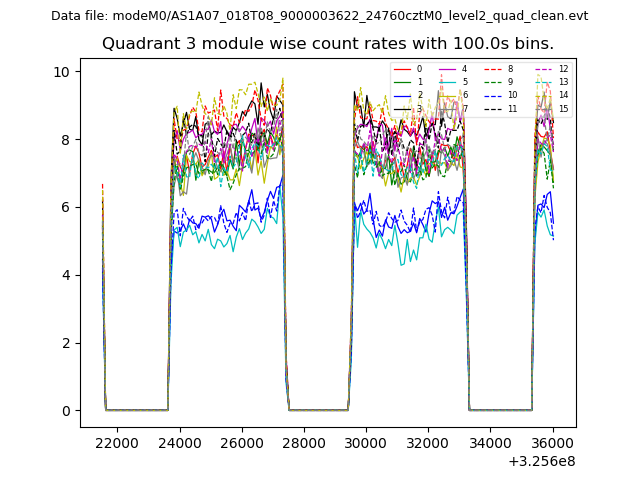
| Module-wise count rates for Quadrant C Data is divided into 100 sec bins |
 |
 |
| Module-wise count rates for Quadrant D Data is divided into 100 sec bins |
 |
 |
| Parameter | Plot |
|---|---|
| CZT HV Monitor | 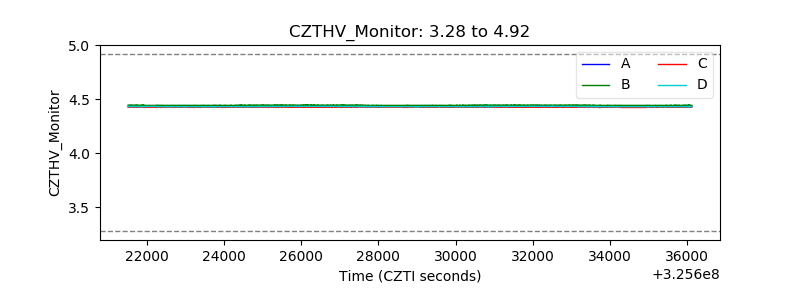 |
| D_VDD | 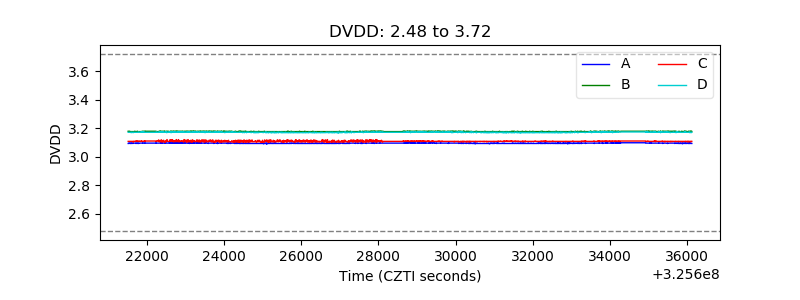 |
| Temperature 1 | 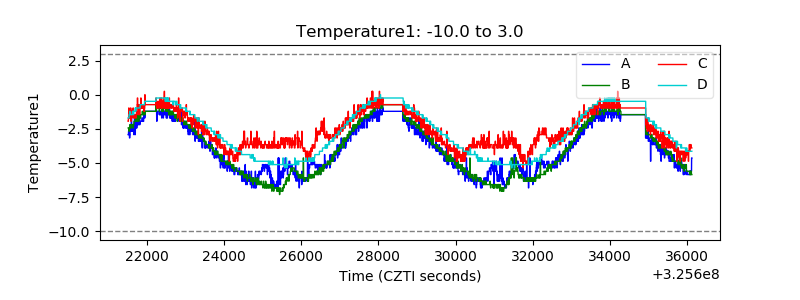 |
| Veto HV Monitor |  |
| Veto LLD | 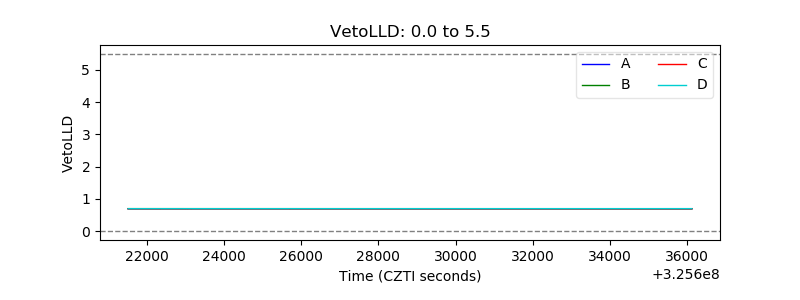 |
| Alpha Counter | 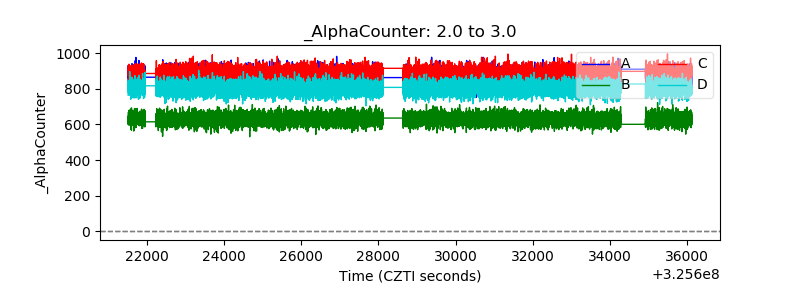 |
| _CPM_Rate | 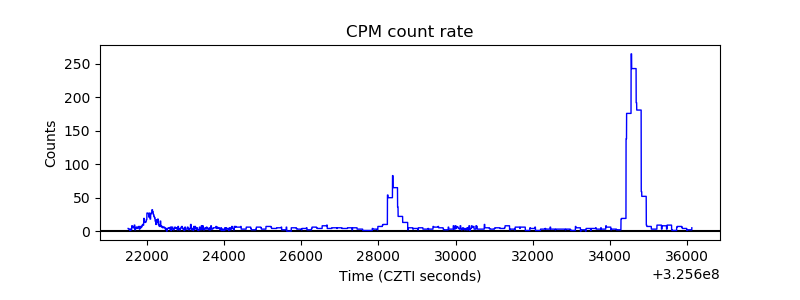 |
| CZT Counter | 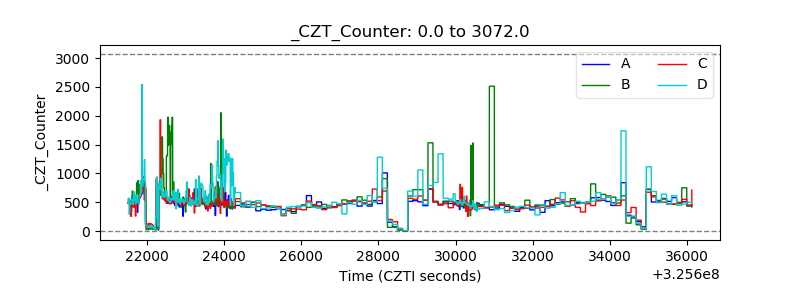 |
| +2.5 Volts monitor |  |
| +5 Volts monitor |  |
| _ROLL_ROT | 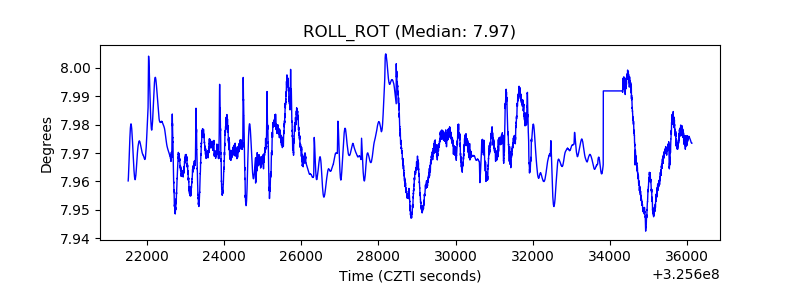 |
| _Roll_DEC | 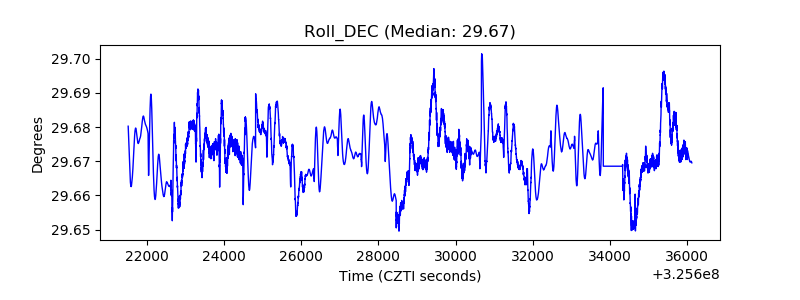 |
| _Roll_RA | 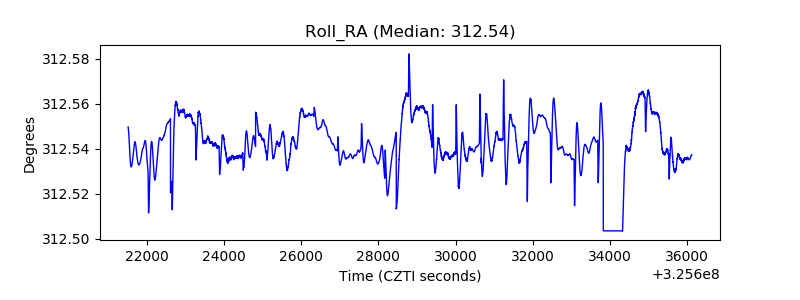 |
| Veto Counter | 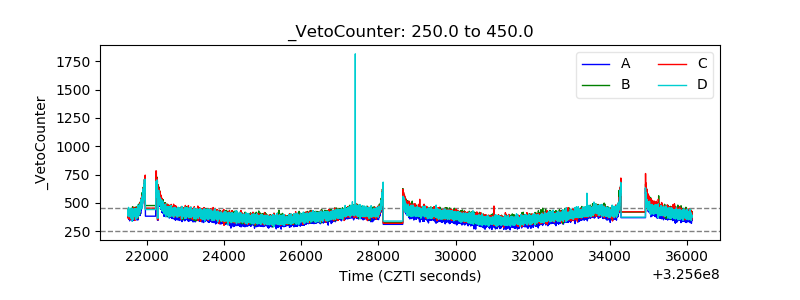 |