| Param | Original file | Final file |
|---|---|---|
| Filename | modeM0/AS1A07_147T01_9000003624cztM0_level2.fits | modeM0/AS1A07_147T01_9000003624cztM0_level2_quad_clean.evt |
| Size (bytes) | 1,302,505,920 | 1,039,455,360 |
| Size | 1.2 GB | 991.3 MB |
| Events in quadrant A | 8,294,866 | 6,103,430 |
| Events in quadrant B | 7,522,560 | 5,710,896 |
| Events in quadrant C | 7,875,824 | 5,656,697 |
| Events in quadrant D | 6,976,784 | 5,231,584 |
| Mode M0 | |||
|---|---|---|---|
| Quadrant | BADHDUFLAG | Total packets | Discarded packets |
| A | 0 | 268288 | 0 |
| B | 0 | 327891 | 0 |
| C | 0 | 283788 | 0 |
| D | 0 | 290282 | 0 |
| Mode SS | |||
|---|---|---|---|
| Quadrant | BADHDUFLAG | Total packets | Discarded packets |
| A | 0 | 2610 | 0 |
| B | 0 | 2610 | 0 |
| C | 0 | 2610 | 0 |
| D | 0 | 2610 | 0 |
| Mode M9 | |||
|---|---|---|---|
| Quadrant | BADHDUFLAG | Total packets | Discarded packets |
| A | 0 | 220 | 0 |
| B | 0 | 220 | 0 |
| C | 0 | 220 | 0 |
| D | 0 | 220 | 0 |
| Quadrant | Total seconds | Saturated seconds | Saturation percentage |
|---|---|---|---|
| A | 128047 | 1559 | 1.217522% |
| B | 128046 | 10015 | 7.821408% |
| C | 128047 | 2950 | 2.303842% |
| D | 128047 | 2059 | 1.608003% |
Noise dominated data is calculated using 1-second bins in cleaned event files. If a bin has >2000 counts, and if more than 50% of those come from <1% of pixels, then it is considered to be noise-dominated and hence unusable.
| Quadrant | # 1 sec bins | Bins with >0 counts | Bins with >2000 counts | High rate bins dominated by noise | Noise dominated (total time) | Noise dominated (detector-on time) | Marked lightcurve |
|---|---|---|---|---|---|---|---|
| A | 149882 | 128048 | 0 | 0 | 0.00% | 0.00% |  |
| B | 149882 | 125700 | 0 | 0 | 0.00% | 0.00% |  |
| C | 149881 | 128047 | 0 | 0 | 0.00% | 0.00% | 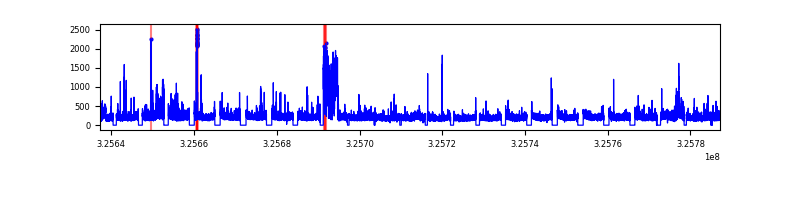 |
| D | 149882 | 128034 | 0 | 0 | 0.00% | 0.00% |  |
Top three noisy pixels from each quadrant. If the there are fewer than three noisy pixels in the level2.evt file, extra rows are filled as -1
| Pixel properties | Quadrant properties | ||||||
|---|---|---|---|---|---|---|---|
| Quadrant | DetID | PixID | Counts | Sigma | Mean | Median | Sigma |
| A | 0 | 29 | 7927 | 11.39 | 2157 | 2025 | 518.0 |
| A | 7 | 110 | 6577 | 8.79 | 2157 | 2025 | 518.0 |
| A | 0 | 30 | 6155 | 7.97 | 2157 | 2025 | 518.0 |
| B | 2 | 9 | 5999 | 10.57 | 1988 | 1895 | 388.3 |
| B | 2 | 8 | 5026 | 8.06 | 1988 | 1895 | 388.3 |
| B | 5 | 232 | 4924 | 7.8 | 1988 | 1895 | 388.3 |
| C | 1 | 81 | 5953 | 7.63 | 2079 | 1947 | 524.8 |
| C | 1 | 80 | 5866 | 7.47 | 2079 | 1947 | 524.8 |
| C | 3 | 126 | 5364 | 6.51 | 2079 | 1947 | 524.8 |
| D | 7 | 3 | 4975 | 6.12 | 1989 | 1817 | 515.8 |
| D | 15 | 46 | 4924 | 6.02 | 1989 | 1817 | 515.8 |
| D | 6 | 67 | 4823 | 5.83 | 1989 | 1817 | 515.8 |
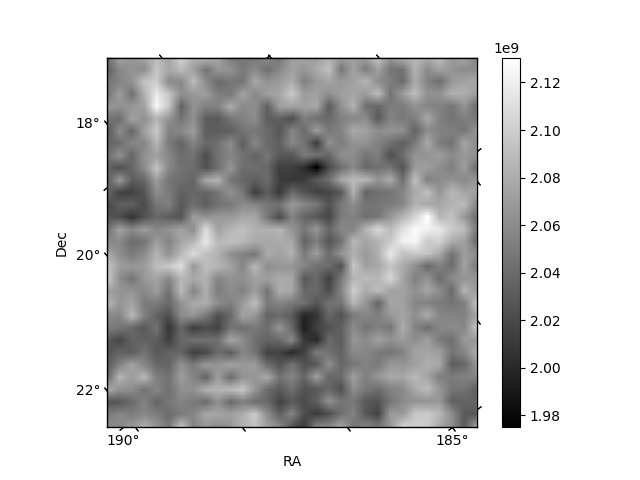
Histogram calculated using DETX and DETY for each event in the final _common_clean file
| Quadrant A |  |
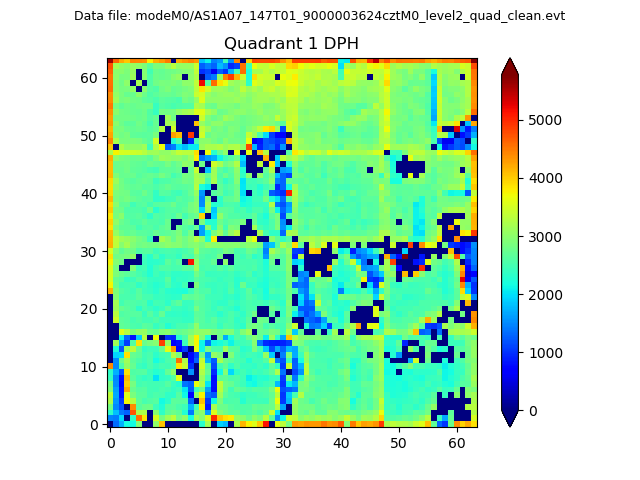 |
Quadrant B |
|---|---|---|---|
| Quadrant D |  |
 |
Quadrant C |
| Plot type | Count rate plots | Images |
|---|---|---|
| Comparison with Poisson distribution Blue bars denote a histogram of data divided into 1 sec bins. Red curve is a Poisson curve with rate = median count rate of data. |
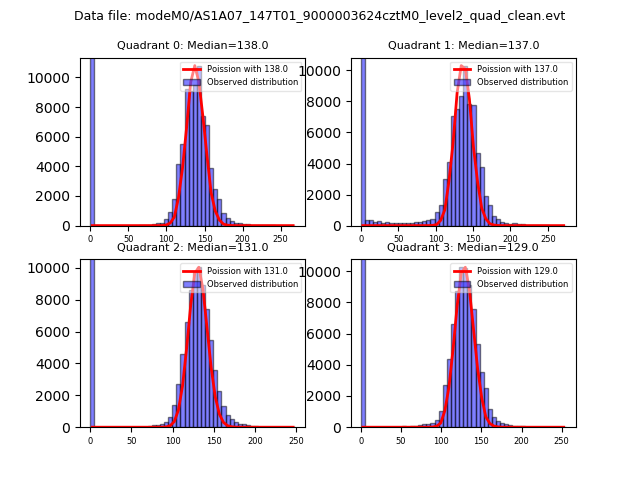 |
 |
| Quadrant-wise count rates Data is divided into 100 sec bins |
 |
|
| Module-wise count rates for Quadrant A Data is divided into 100 sec bins |
 |
 |
| Module-wise count rates for Quadrant B Data is divided into 100 sec bins |
 |
 |
| Module-wise count rates for Quadrant C Data is divided into 100 sec bins |
 |
 |
| Module-wise count rates for Quadrant D Data is divided into 100 sec bins |
 |
 |
| Parameter | Plot |
|---|---|
| CZT HV Monitor |  |
| D_VDD |  |
| Temperature 1 | 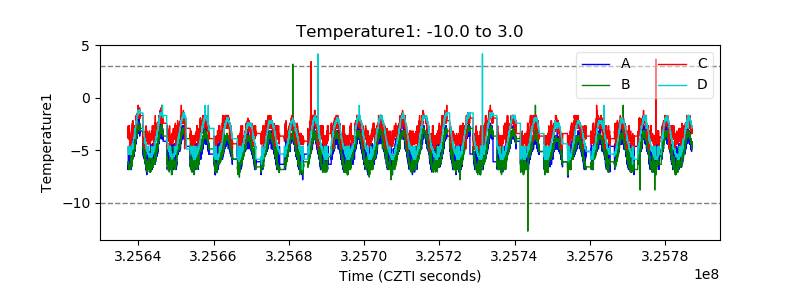 |
| Veto HV Monitor |  |
| Veto LLD |  |
| Alpha Counter |  |
| _CPM_Rate | 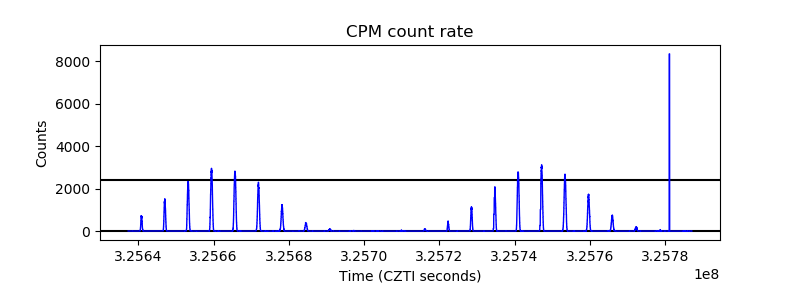 |
| CZT Counter | 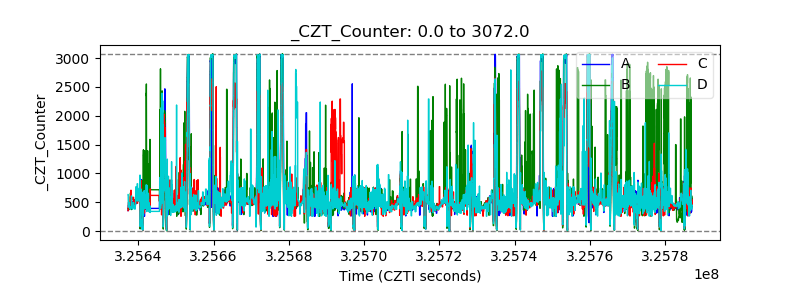 |
| +2.5 Volts monitor |  |
| +5 Volts monitor | 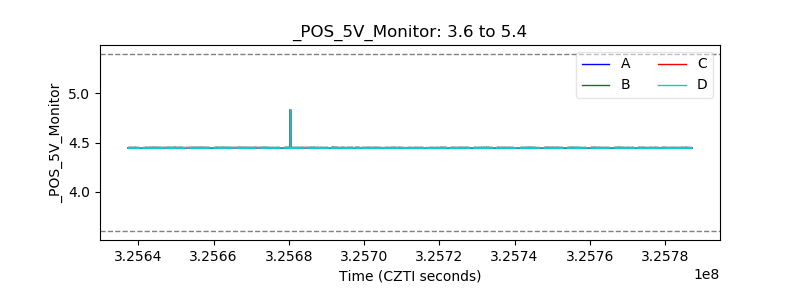 |
| _ROLL_ROT | 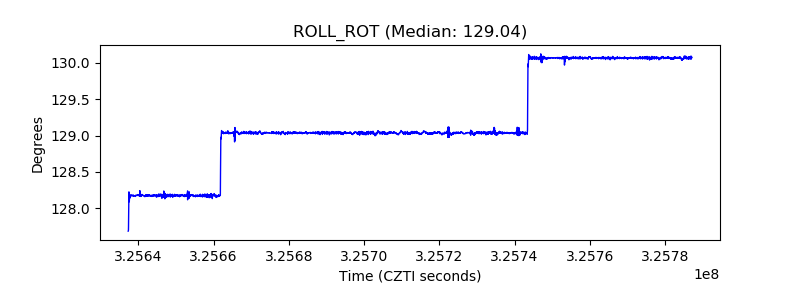 |
| _Roll_DEC |  |
| _Roll_RA | 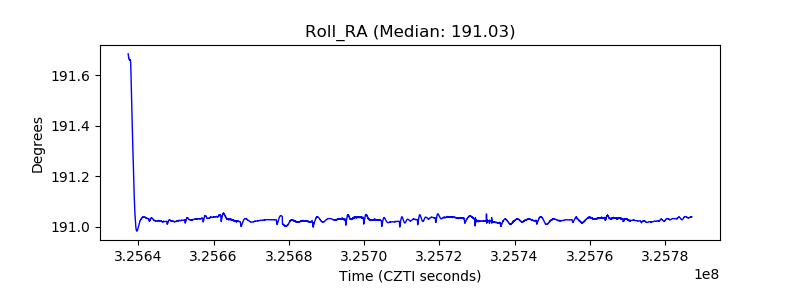 |
| Veto Counter |  |