| Param | Original file | Final file |
|---|---|---|
| Filename | modeM0/AS1A07_147T01_9000003624_24760cztM0_level2.evt | modeM0/AS1A07_147T01_9000003624_24760cztM0_level2_quad_clean.evt |
| Size (bytes) | 338,391,360 | 57,038,400 |
| Size | 322.7 MB | 54.4 MB |
| Events in quadrant A | 2,257,063 | 357,915 |
| Events in quadrant B | 2,923,081 | 350,999 |
| Events in quadrant C | 2,442,626 | 345,941 |
| Events in quadrant D | 2,304,461 | 341,305 |
| Mode M0 | |||
|---|---|---|---|
| Quadrant | BADHDUFLAG | Total packets | Discarded packets |
| A | 0 | 9674 | 1 |
| B | 0 | 11793 | 1 |
| C | 0 | 10238 | 1 |
| D | 0 | 9979 | 1 |
| Mode SS | |||
|---|---|---|---|
| Quadrant | BADHDUFLAG | Total packets | Discarded packets |
| A | 0 | 96 | 0 |
| B | 0 | 96 | 0 |
| C | 0 | 96 | 0 |
| D | 0 | 96 | 0 |
| Mode M9 | |||
|---|---|---|---|
| Quadrant | BADHDUFLAG | Total packets | Discarded packets |
| A | 0 | 8 | 0 |
| B | 0 | 8 | 0 |
| C | 0 | 8 | 0 |
| D | 0 | 8 | 0 |
| Quadrant | Total seconds | Saturated seconds | Saturation percentage |
|---|---|---|---|
| A | 4709 | 18 | 0.382247% |
| B | 4709 | 176 | 3.737524% |
| C | 4709 | 56 | 1.189212% |
| D | 4709 | 17 | 0.361011% |
Noise dominated data is calculated using 1-second bins in cleaned event files. If a bin has >2000 counts, and if more than 50% of those come from <1% of pixels, then it is considered to be noise-dominated and hence unusable.
| Quadrant | # 1 sec bins | Bins with >0 counts | Bins with >2000 counts | High rate bins dominated by noise | Noise dominated (total time) | Noise dominated (detector-on time) | Marked lightcurve |
|---|---|---|---|---|---|---|---|
| A | 5504 | 4710 | 0 | 0 | 0.00% | 0.00% | 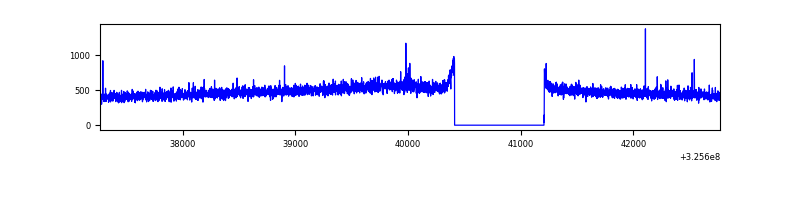 |
| B | 5504 | 4710 | 101 | 101 | 1.84% | 2.14% | 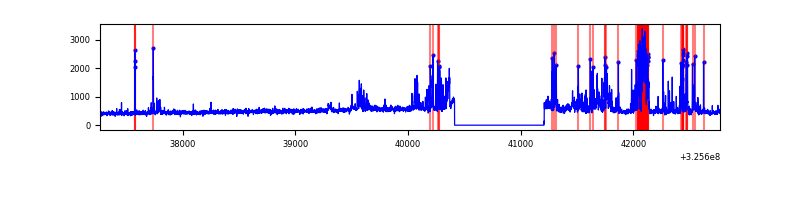 |
| C | 5504 | 4710 | 0 | 0 | 0.00% | 0.00% | 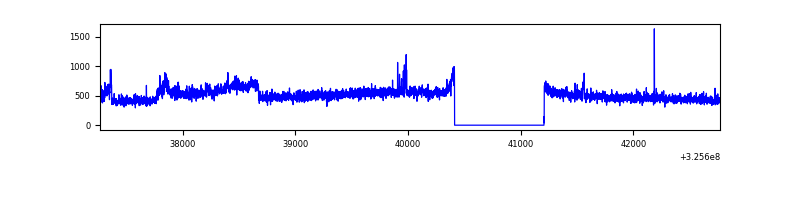 |
| D | 5504 | 4710 | 3 | 3 | 0.05% | 0.06% |  |
Top three noisy pixels from each quadrant. If the there are fewer than three noisy pixels in the level2.evt file, extra rows are filled as -1
| Pixel properties | Quadrant properties | ||||||
|---|---|---|---|---|---|---|---|
| Quadrant | DetID | PixID | Counts | Sigma | Mean | Median | Sigma |
| A | 10 | 255 | 7669 | 59.35 | 582 | 568 | 119.6 |
| A | 13 | 254 | 6960 | 53.42 | 582 | 568 | 119.6 |
| A | 3 | 137 | 5533 | 41.5 | 582 | 568 | 119.6 |
| B | 3 | 64 | 612805 | 5491.97 | 569 | 553 | 111.5 |
| B | 0 | 189 | 34631 | 305.68 | 569 | 553 | 111.5 |
| B | 12 | 111 | 13807 | 118.89 | 569 | 553 | 111.5 |
| C | 7 | 247 | 172856 | 1302.24 | 555 | 558 | 132.3 |
| C | 14 | 238 | 86303 | 648.06 | 555 | 558 | 132.3 |
| C | 2 | 16 | 16077 | 117.29 | 555 | 558 | 132.3 |
| D | 8 | 195 | 104387 | 754.02 | 562 | 545 | 137.7 |
| D | 1 | 52 | 29274 | 208.61 | 562 | 545 | 137.7 |
| D | 12 | 233 | 22904 | 162.35 | 562 | 545 | 137.7 |
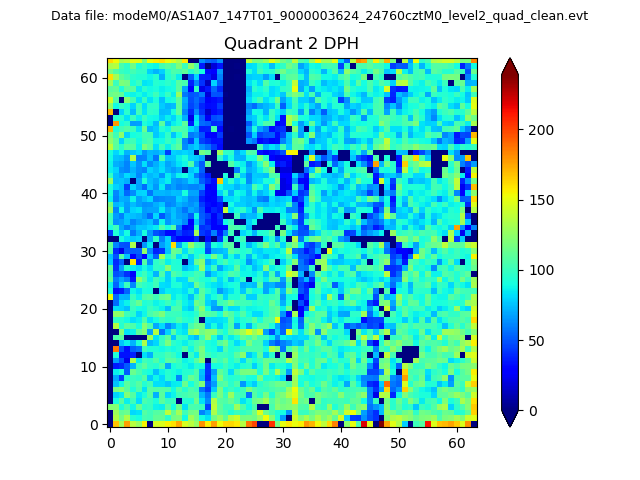
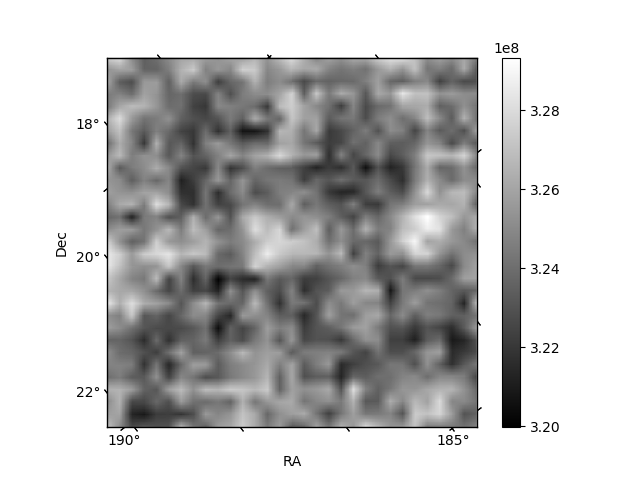
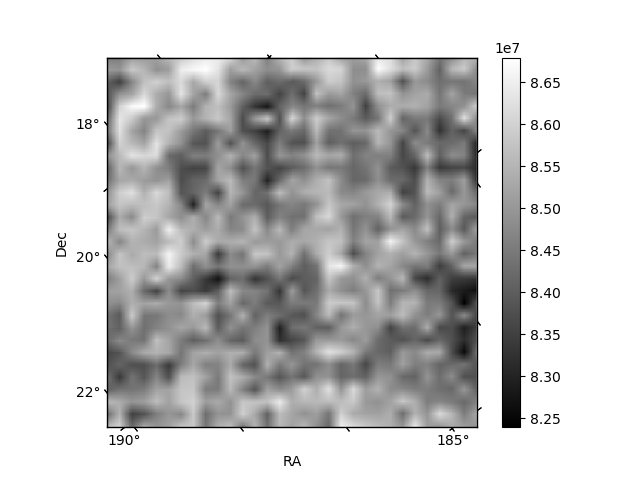
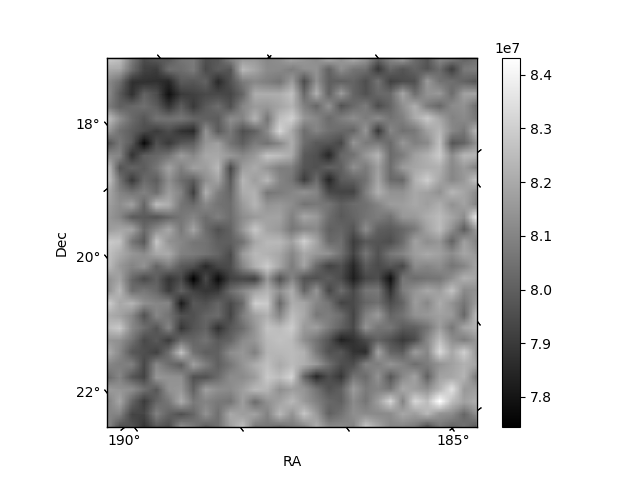
Histogram calculated using DETX and DETY for each event in the final _common_clean file
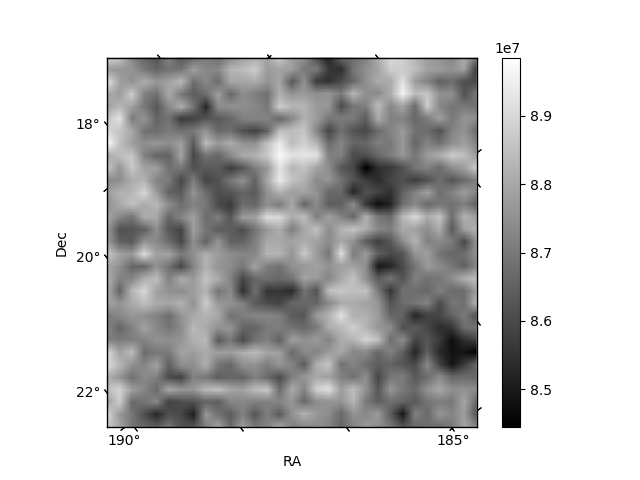
| Quadrant A | 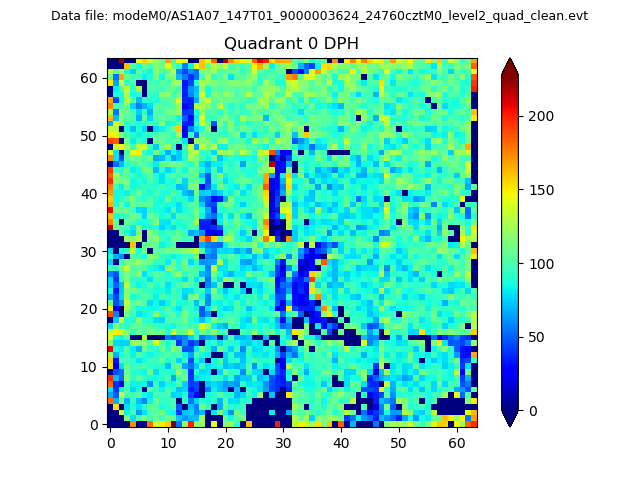 |
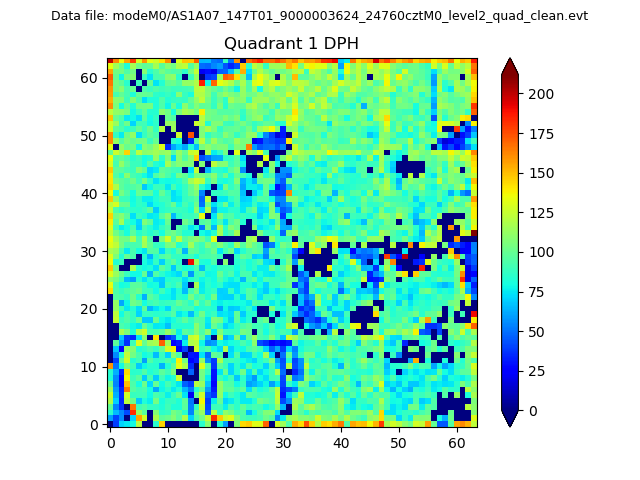 |
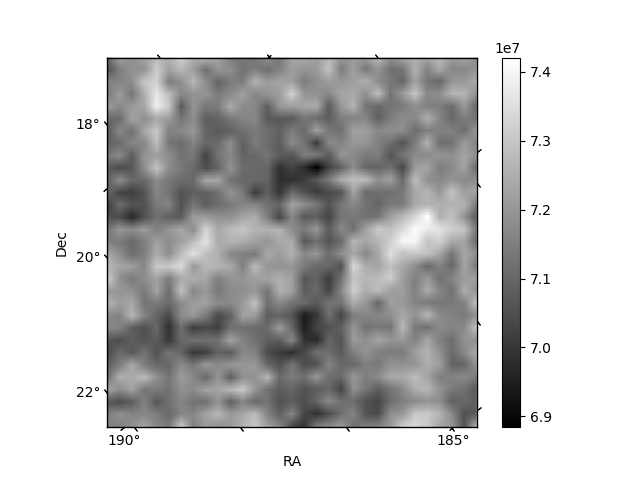
Quadrant B |
|---|---|---|---|
| Quadrant D | 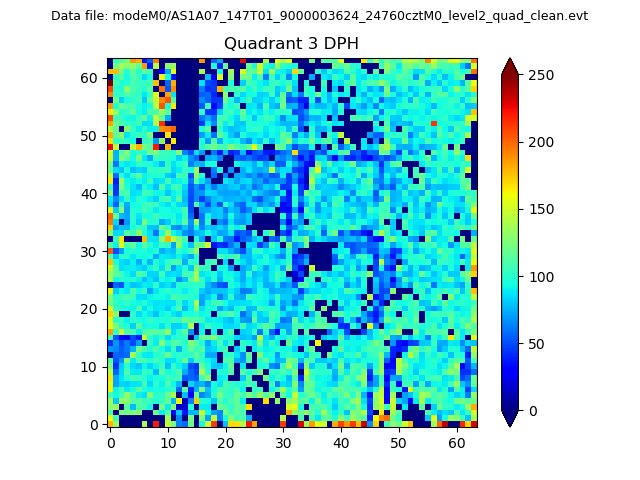 |
 |
Quadrant C |
| Plot type | Count rate plots | Images |
|---|---|---|
| Comparison with Poisson distribution Blue bars denote a histogram of data divided into 1 sec bins. Red curve is a Poisson curve with rate = median count rate of data. |
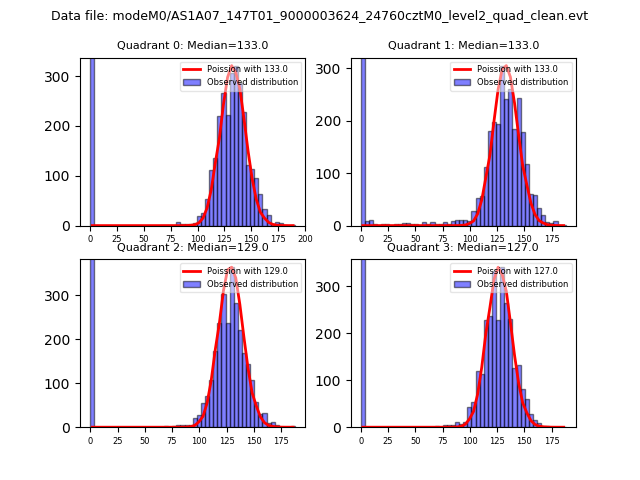 |
 |
| Quadrant-wise count rates Data is divided into 100 sec bins |
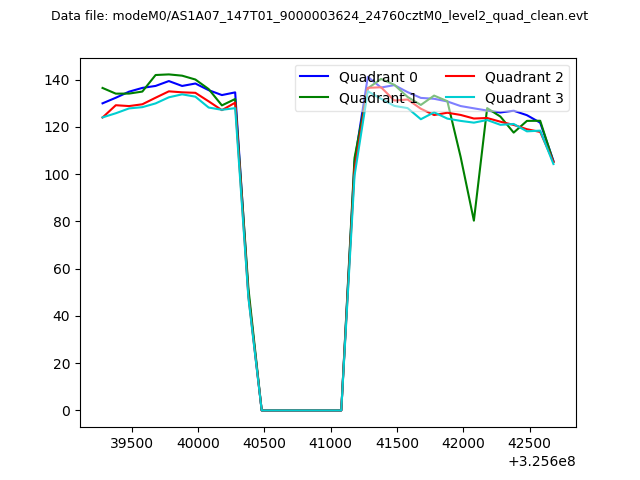 |
|
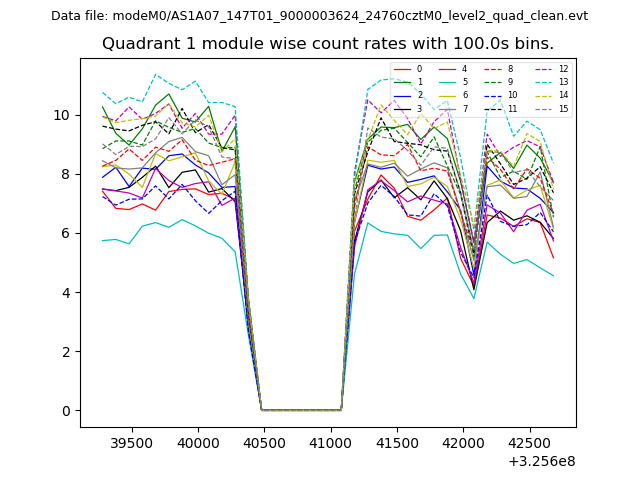
| Module-wise count rates for Quadrant A Data is divided into 100 sec bins |
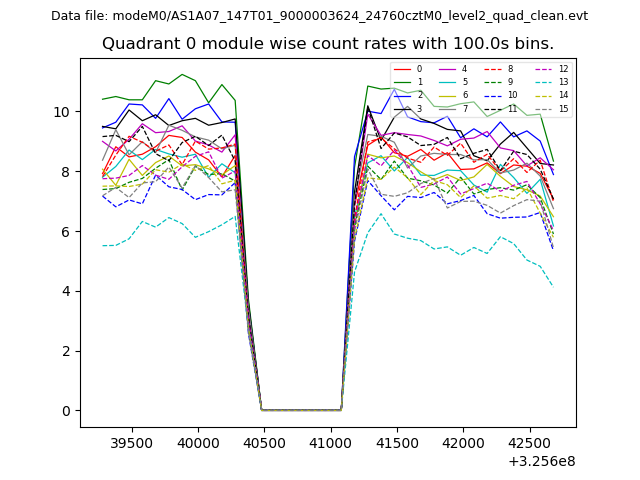 |
 |
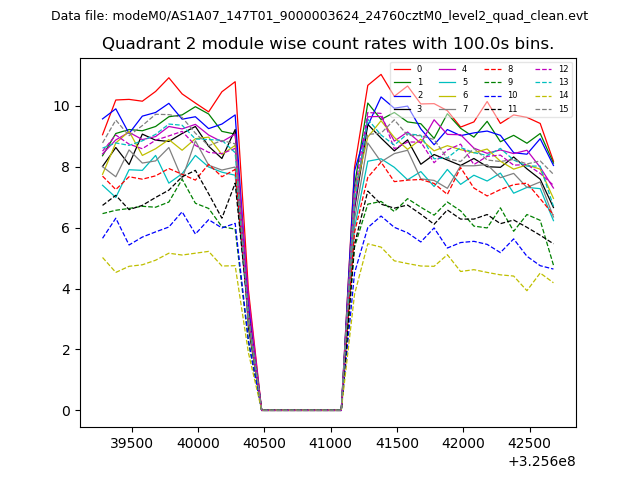
| Module-wise count rates for Quadrant B Data is divided into 100 sec bins |
 |
 |
| Module-wise count rates for Quadrant C Data is divided into 100 sec bins |
 |
 |
| Module-wise count rates for Quadrant D Data is divided into 100 sec bins |
 |
 |
| Parameter | Plot |
|---|---|
| CZT HV Monitor | 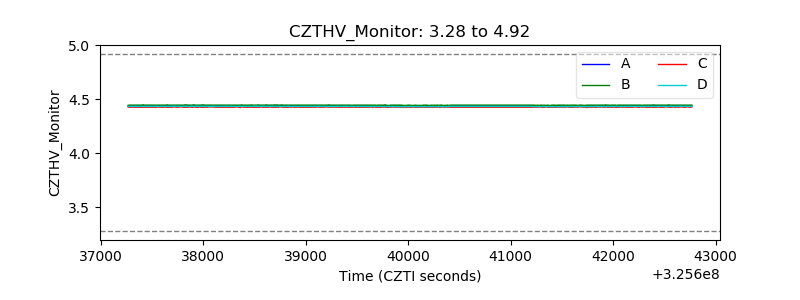 |
| D_VDD |  |
| Temperature 1 | 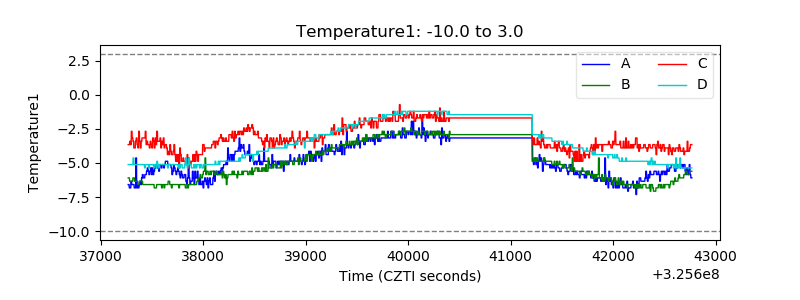 |
| Veto HV Monitor | 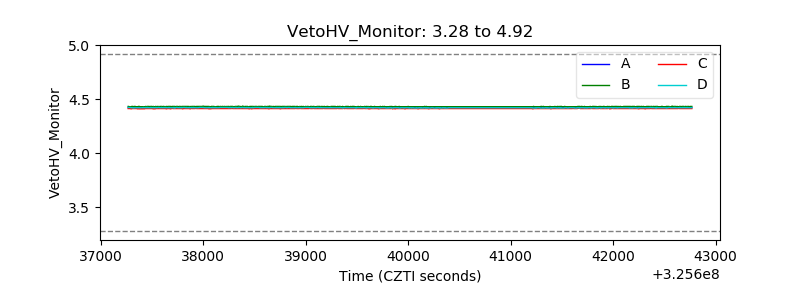 |
| Veto LLD |  |
| Alpha Counter | 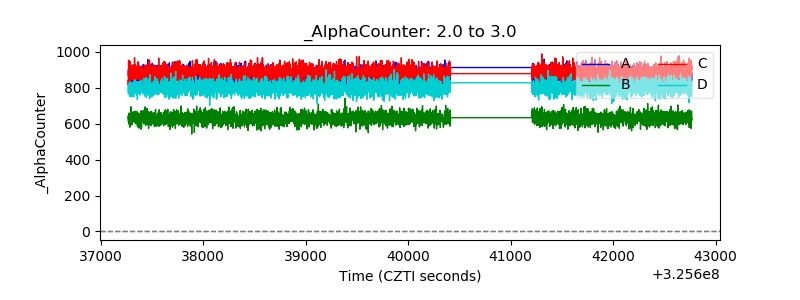 |
| _CPM_Rate | 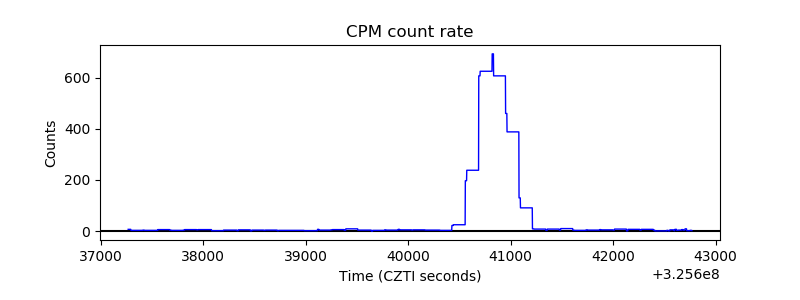 |
| CZT Counter | 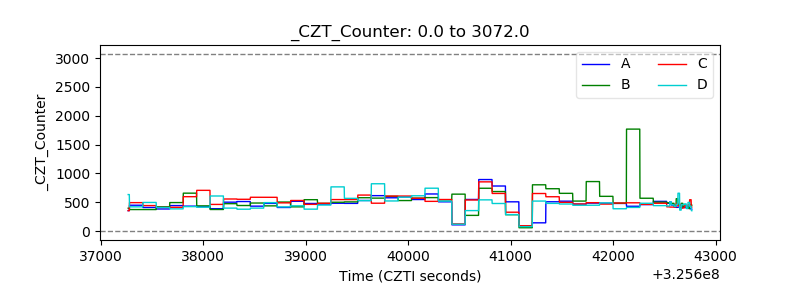 |
| +2.5 Volts monitor |  |
| +5 Volts monitor |  |
| _ROLL_ROT | 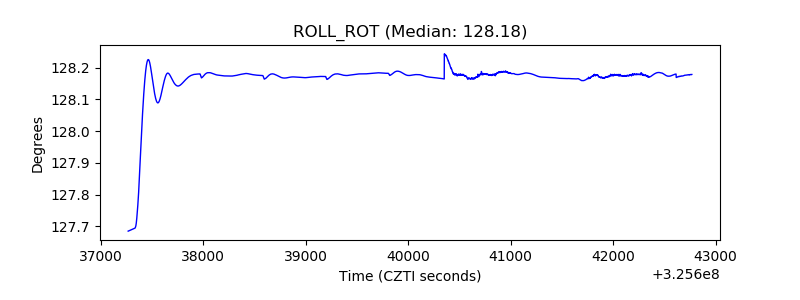 |
| _Roll_DEC | 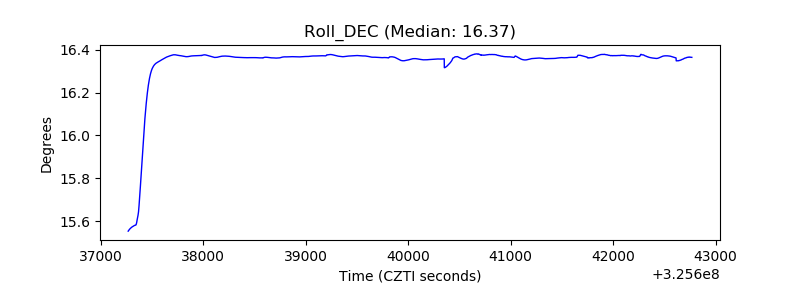 |
| _Roll_RA | 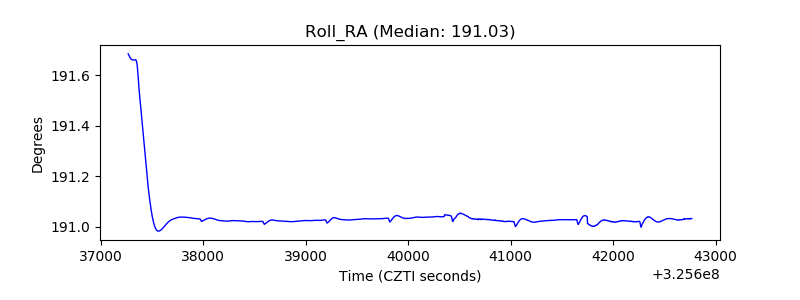 |
| Veto Counter |  |