| Param | Original file | Final file |
|---|---|---|
| Filename | modeM0/AS1A07_147T01_9000003624_24761cztM0_level2.evt | modeM0/AS1A07_147T01_9000003624_24761cztM0_level2_quad_clean.evt |
| Size (bytes) | 501,955,200 | 90,377,280 |
| Size | 478.7 MB | 86.2 MB |
| Events in quadrant A | 3,191,644 | 585,415 |
| Events in quadrant B | 4,653,053 | 569,610 |
| Events in quadrant C | 3,362,003 | 562,792 |
| Events in quadrant D | 3,537,775 | 549,599 |
| Mode M0 | |||
|---|---|---|---|
| Quadrant | BADHDUFLAG | Total packets | Discarded packets |
| A | 0 | 13760 | 2 |
| B | 0 | 18153 | 2 |
| C | 0 | 14136 | 2 |
| D | 0 | 15041 | 2 |
| Mode SS | |||
|---|---|---|---|
| Quadrant | BADHDUFLAG | Total packets | Discarded packets |
| A | 0 | 136 | 0 |
| B | 0 | 136 | 0 |
| C | 0 | 136 | 0 |
| D | 0 | 136 | 0 |
| Mode M9 | |||
|---|---|---|---|
| Quadrant | BADHDUFLAG | Total packets | Discarded packets |
| A | 0 | 12 | 0 |
| B | 0 | 13 | 0 |
| C | 0 | 13 | 0 |
| D | 0 | 13 | 0 |
| Quadrant | Total seconds | Saturated seconds | Saturation percentage |
|---|---|---|---|
| A | 6738 | 23 | 0.341348% |
| B | 6738 | 392 | 5.817750% |
| C | 6738 | 55 | 0.816266% |
| D | 6738 | 80 | 1.187296% |
Noise dominated data is calculated using 1-second bins in cleaned event files. If a bin has >2000 counts, and if more than 50% of those come from <1% of pixels, then it is considered to be noise-dominated and hence unusable.
| Quadrant | # 1 sec bins | Bins with >0 counts | Bins with >2000 counts | High rate bins dominated by noise | Noise dominated (total time) | Noise dominated (detector-on time) | Marked lightcurve |
|---|---|---|---|---|---|---|---|
| A | 7678 | 6739 | 0 | 0 | 0.00% | 0.00% | 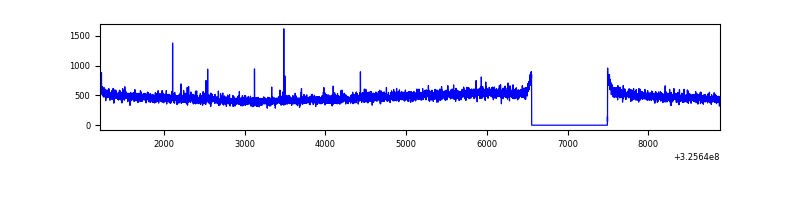 |
| B | 7678 | 6739 | 252 | 252 | 3.28% | 3.74% | 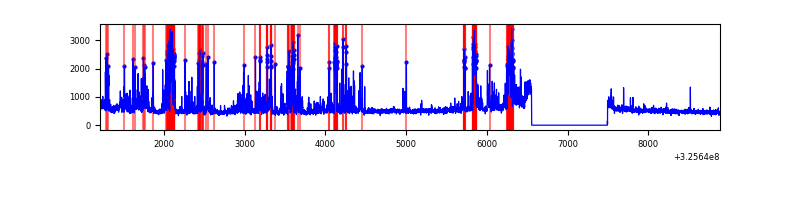 |
| C | 7678 | 6739 | 0 | 0 | 0.00% | 0.00% | 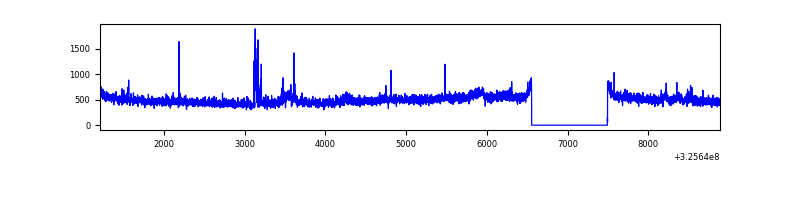 |
| D | 7678 | 6739 | 58 | 58 | 0.76% | 0.86% | 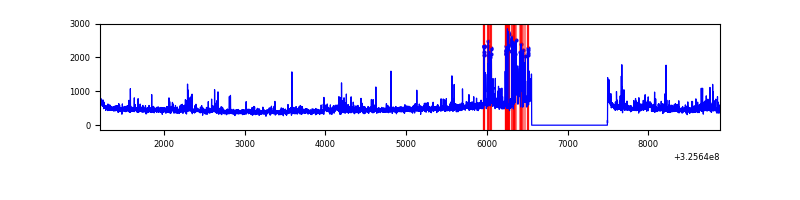 |
Top three noisy pixels from each quadrant. If the there are fewer than three noisy pixels in the level2.evt file, extra rows are filled as -1
| Pixel properties | Quadrant properties | ||||||
|---|---|---|---|---|---|---|---|
| Quadrant | DetID | PixID | Counts | Sigma | Mean | Median | Sigma |
| A | 13 | 254 | 10102 | 55.92 | 824 | 805 | 166.3 |
| A | 4 | 2 | 8826 | 48.24 | 824 | 805 | 166.3 |
| A | 3 | 137 | 7571 | 40.7 | 824 | 805 | 166.3 |
| B | 3 | 64 | 1431440 | 9219.27 | 798 | 777 | 155.2 |
| B | 0 | 189 | 67611 | 430.68 | 798 | 777 | 155.2 |
| B | 12 | 111 | 19070 | 117.88 | 798 | 777 | 155.2 |
| C | 14 | 238 | 123149 | 656.74 | 787 | 793 | 186.3 |
| C | 7 | 247 | 95336 | 507.45 | 787 | 793 | 186.3 |
| C | 5 | 112 | 40441 | 212.81 | 787 | 793 | 186.3 |
| D | 7 | 238 | 235852 | 1222.52 | 792 | 768 | 192.3 |
| D | 8 | 195 | 159465 | 825.28 | 792 | 768 | 192.3 |
| D | 1 | 52 | 79120 | 407.46 | 792 | 768 | 192.3 |
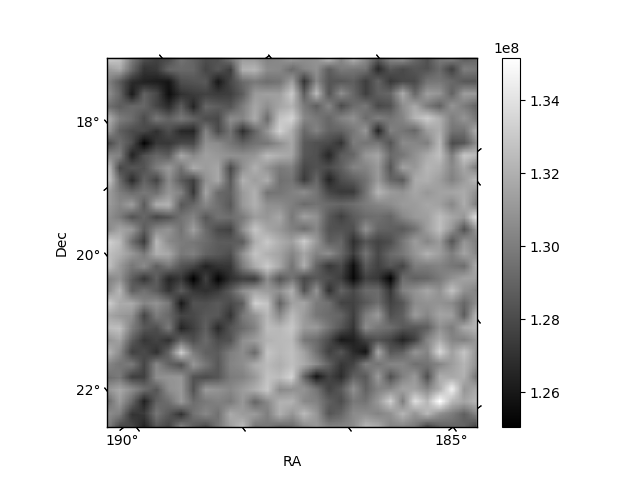
Histogram calculated using DETX and DETY for each event in the final _common_clean file
| Quadrant A |  |
 |
Quadrant B |
|---|---|---|---|
| Quadrant D | 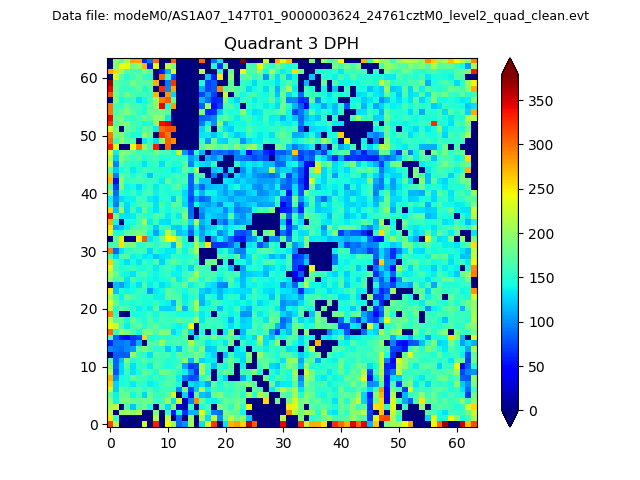 |
 |
Quadrant C |
| Plot type | Count rate plots | Images |
|---|---|---|
| Comparison with Poisson distribution Blue bars denote a histogram of data divided into 1 sec bins. Red curve is a Poisson curve with rate = median count rate of data. |
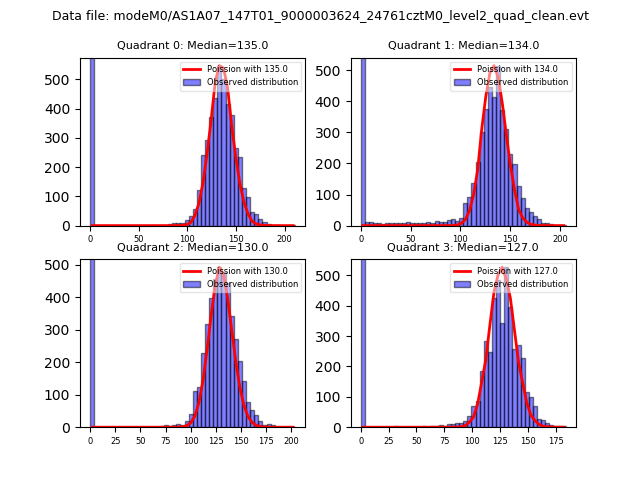 |
 |
| Quadrant-wise count rates Data is divided into 100 sec bins |
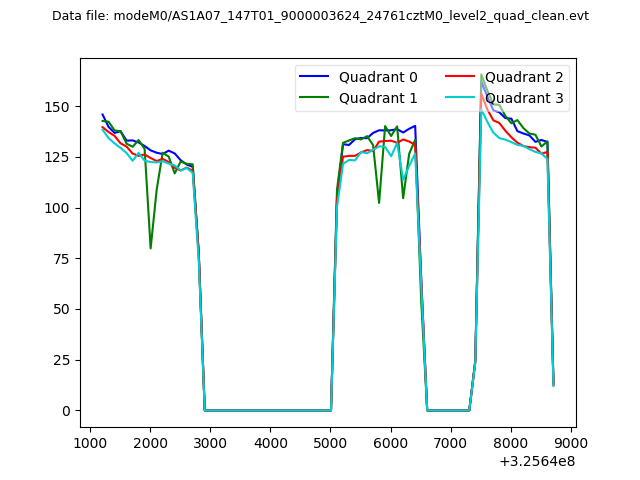 |
|
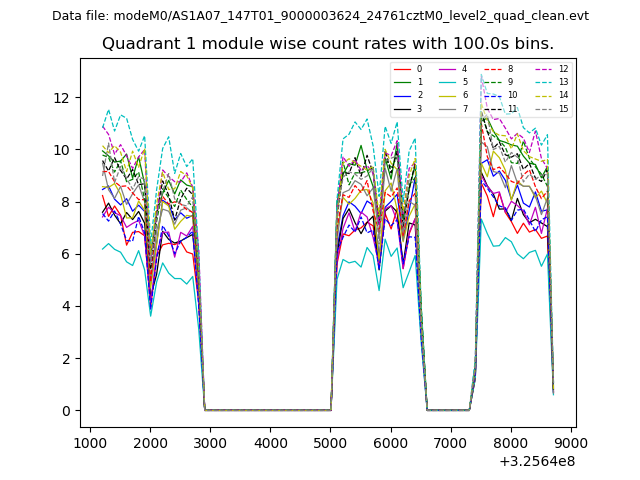
| Module-wise count rates for Quadrant A Data is divided into 100 sec bins |
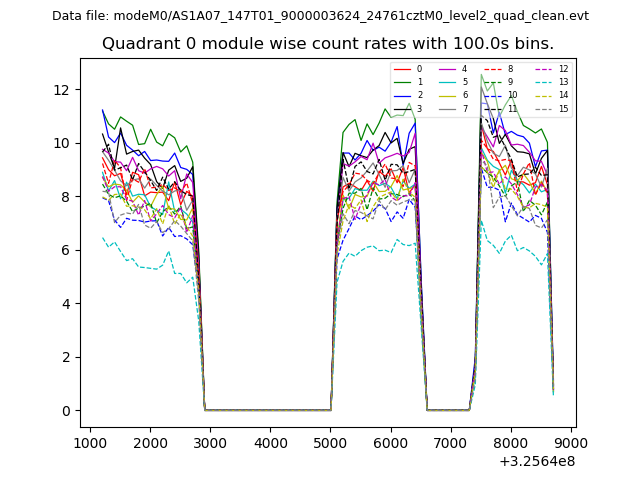 |
 |
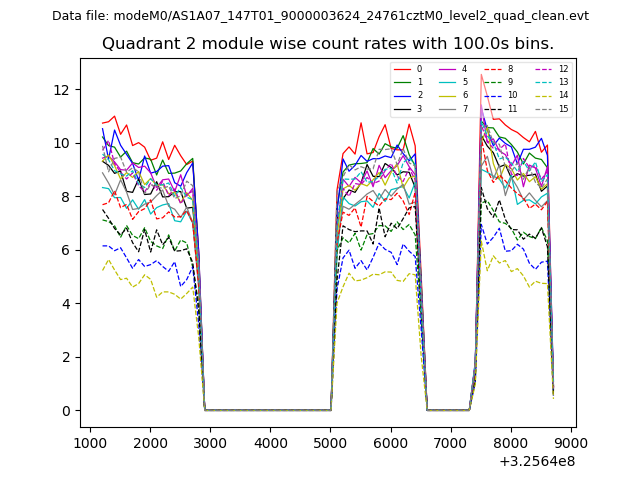
| Module-wise count rates for Quadrant B Data is divided into 100 sec bins |
 |
 |
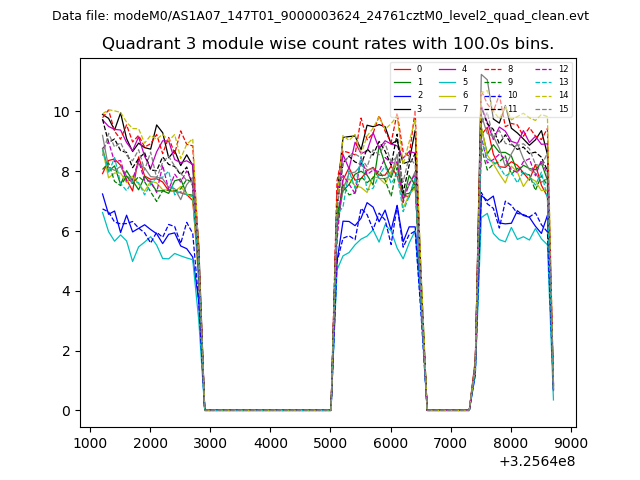
| Module-wise count rates for Quadrant C Data is divided into 100 sec bins |
 |
 |
| Module-wise count rates for Quadrant D Data is divided into 100 sec bins |
 |
 |
| Parameter | Plot |
|---|---|
| CZT HV Monitor | 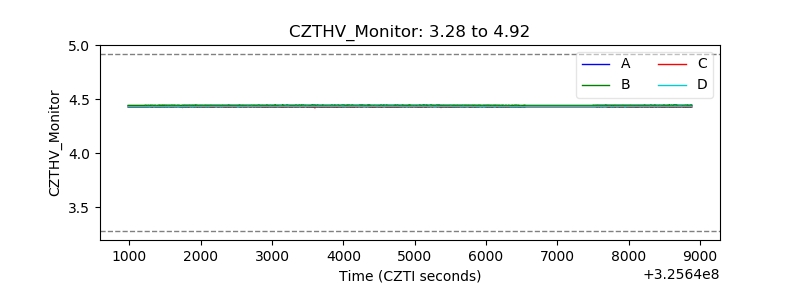 |
| D_VDD | 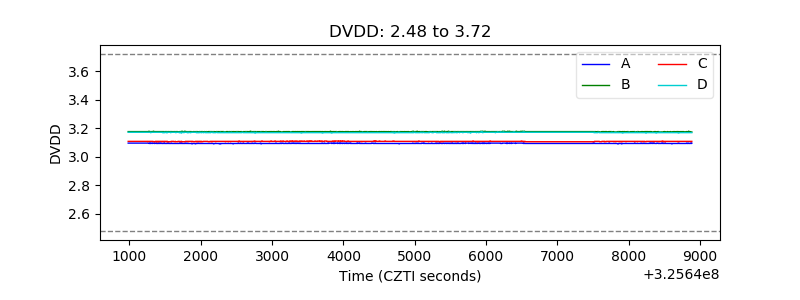 |
| Temperature 1 | 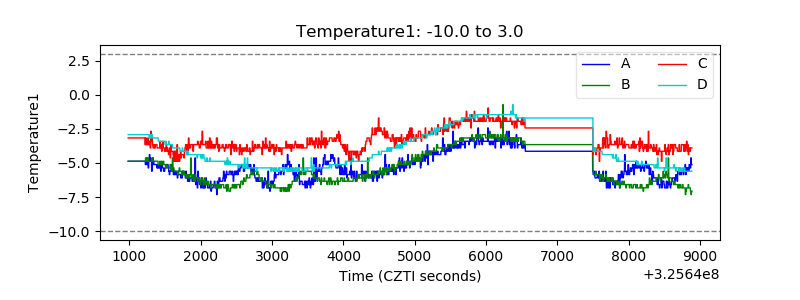 |
| Veto HV Monitor | 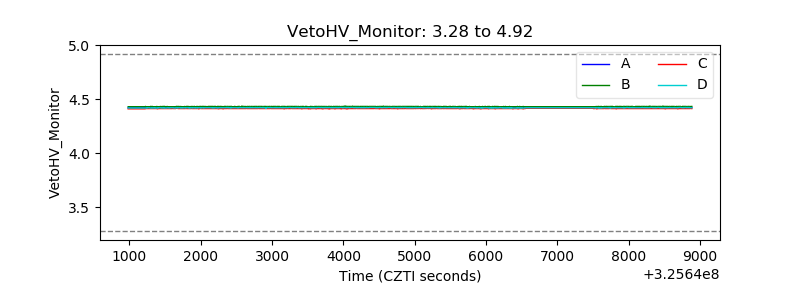 |
| Veto LLD | 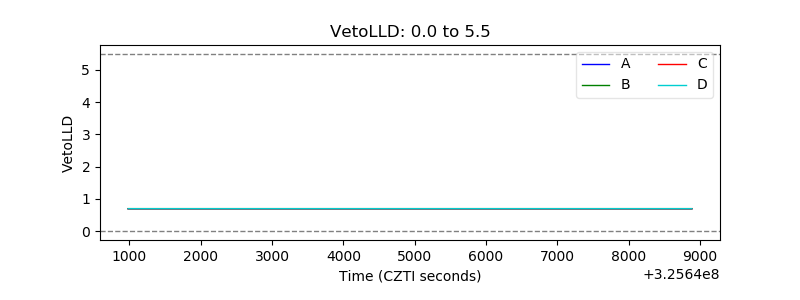 |
| Alpha Counter | 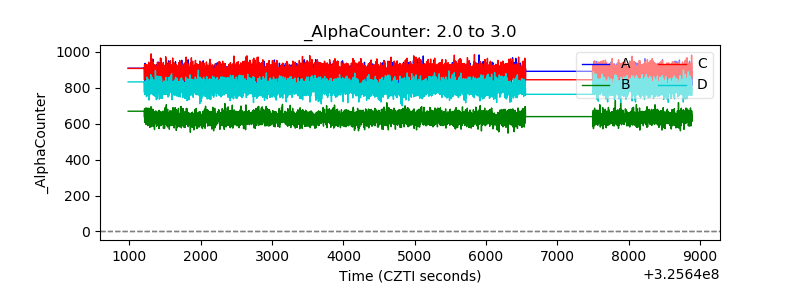 |
| _CPM_Rate | 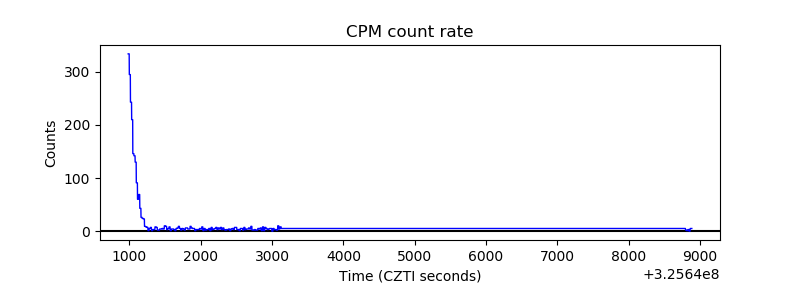 |
| CZT Counter |  |
| +2.5 Volts monitor |  |
| +5 Volts monitor | 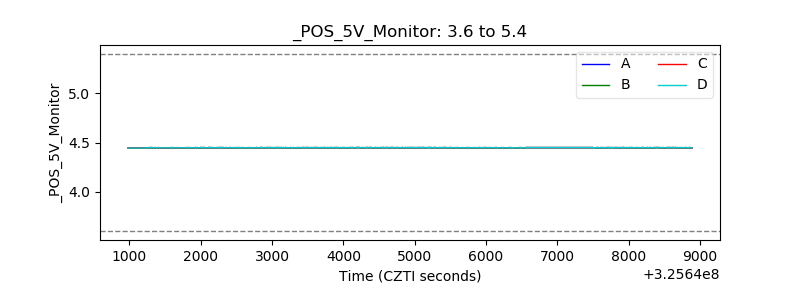 |
| _ROLL_ROT | 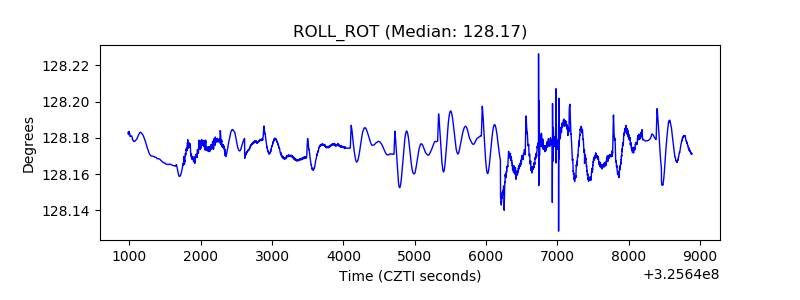 |
| _Roll_DEC | 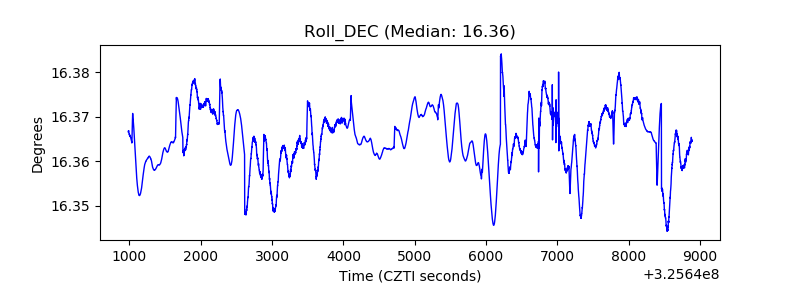 |
| _Roll_RA | 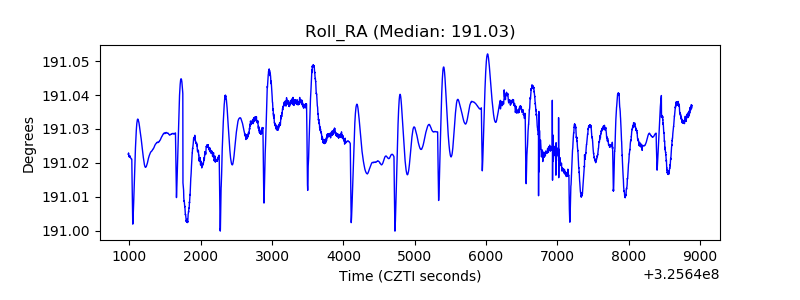 |
| Veto Counter | 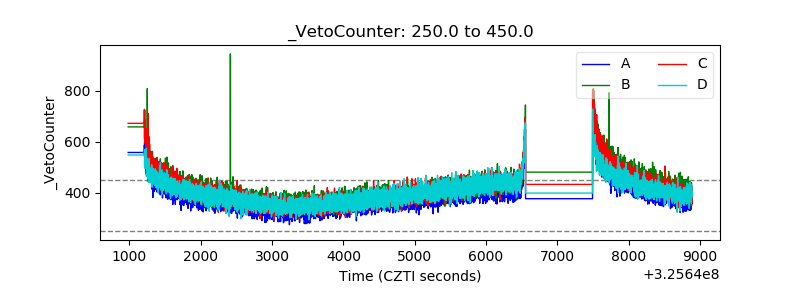 |