| Param | Original file | Final file |
|---|---|---|
| Filename | modeM0/AS1A07_147T01_9000003624_24763cztM0_level2.evt | modeM0/AS1A07_147T01_9000003624_24763cztM0_level2_quad_clean.evt |
| Size (bytes) | 515,016,000 | 92,076,480 |
| Size | 491.2 MB | 87.8 MB |
| Events in quadrant A | 3,437,927 | 592,934 |
| Events in quadrant B | 3,979,723 | 593,368 |
| Events in quadrant C | 4,066,323 | 562,290 |
| Events in quadrant D | 3,639,927 | 553,575 |
| Mode M0 | |||
|---|---|---|---|
| Quadrant | BADHDUFLAG | Total packets | Discarded packets |
| A | 0 | 14434 | 2 |
| B | 0 | 16149 | 2 |
| C | 0 | 16569 | 2 |
| D | 0 | 15396 | 2 |
| Mode SS | |||
|---|---|---|---|
| Quadrant | BADHDUFLAG | Total packets | Discarded packets |
| A | 0 | 142 | 0 |
| B | 0 | 142 | 0 |
| C | 0 | 142 | 0 |
| D | 0 | 142 | 0 |
| Mode M9 | |||
|---|---|---|---|
| Quadrant | BADHDUFLAG | Total packets | Discarded packets |
| A | 0 | 20 | 0 |
| B | 0 | 20 | 0 |
| C | 0 | 20 | 0 |
| D | 0 | 20 | 0 |
| Quadrant | Total seconds | Saturated seconds | Saturation percentage |
|---|---|---|---|
| A | 6982 | 39 | 0.558579% |
| B | 6983 | 185 | 2.649291% |
| C | 6983 | 97 | 1.389088% |
| D | 6983 | 70 | 1.002434% |
Noise dominated data is calculated using 1-second bins in cleaned event files. If a bin has >2000 counts, and if more than 50% of those come from <1% of pixels, then it is considered to be noise-dominated and hence unusable.
| Quadrant | # 1 sec bins | Bins with >0 counts | Bins with >2000 counts | High rate bins dominated by noise | Noise dominated (total time) | Noise dominated (detector-on time) | Marked lightcurve |
|---|---|---|---|---|---|---|---|
| A | 8992 | 6984 | 0 | 0 | 0.00% | 0.00% | 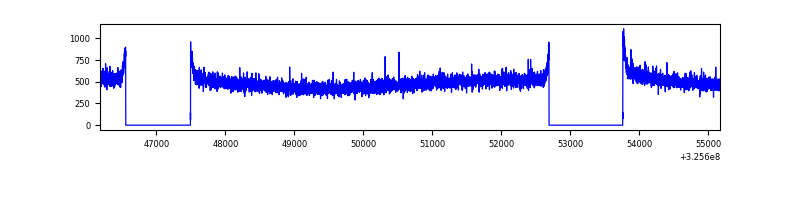 |
| B | 8993 | 6985 | 62 | 62 | 0.69% | 0.89% | 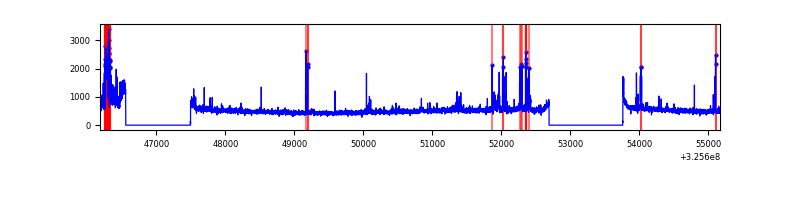 |
| C | 8993 | 6985 | 2 | 2 | 0.02% | 0.03% | 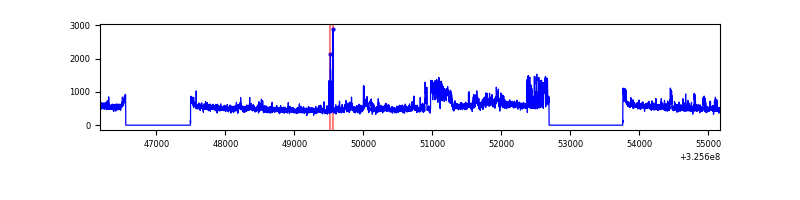 |
| D | 8993 | 6985 | 47 | 47 | 0.52% | 0.67% | 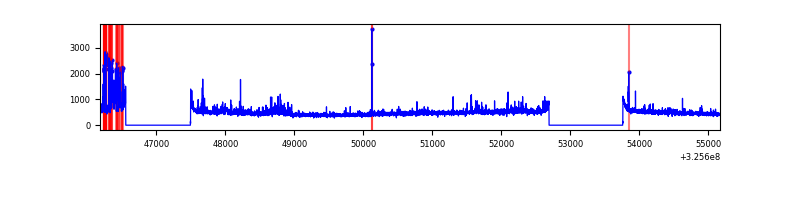 |
Top three noisy pixels from each quadrant. If the there are fewer than three noisy pixels in the level2.evt file, extra rows are filled as -1
| Pixel properties | Quadrant properties | ||||||
|---|---|---|---|---|---|---|---|
| Quadrant | DetID | PixID | Counts | Sigma | Mean | Median | Sigma |
| A | 13 | 254 | 9692 | 49.35 | 891 | 872 | 178.7 |
| A | 3 | 137 | 8053 | 40.18 | 891 | 872 | 178.7 |
| A | 0 | 226 | 7681 | 38.1 | 891 | 872 | 178.7 |
| B | 3 | 64 | 433626 | 2573.84 | 878 | 857 | 168.1 |
| B | 0 | 189 | 63164 | 370.56 | 878 | 857 | 168.1 |
| B | 4 | 52 | 24415 | 140.11 | 878 | 857 | 168.1 |
| C | 7 | 247 | 521968 | 2628.37 | 845 | 853 | 198.3 |
| C | 14 | 238 | 135628 | 679.77 | 845 | 853 | 198.3 |
| C | 10 | 91 | 94756 | 473.62 | 845 | 853 | 198.3 |
| D | 7 | 238 | 165008 | 800.39 | 851 | 827 | 205.1 |
| D | 8 | 195 | 159914 | 775.56 | 851 | 827 | 205.1 |
| D | 12 | 233 | 43739 | 209.2 | 851 | 827 | 205.1 |
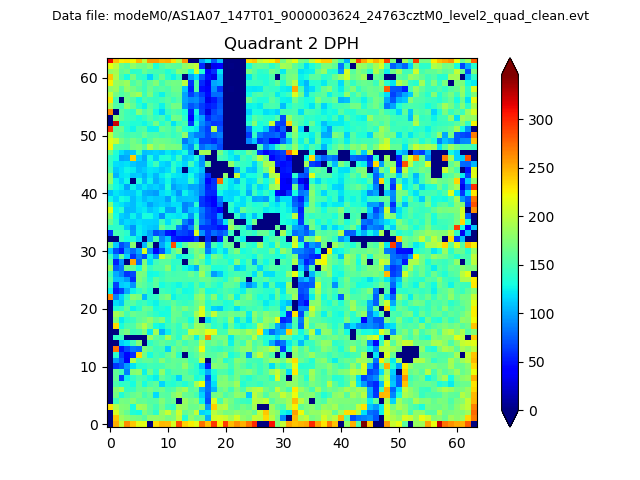
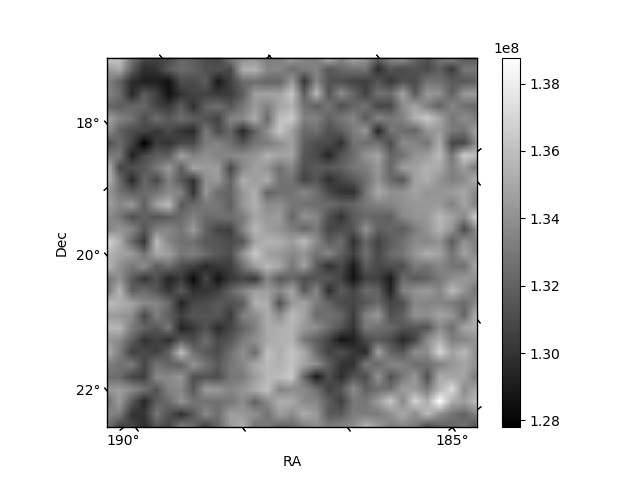
Histogram calculated using DETX and DETY for each event in the final _common_clean file
| Quadrant A | 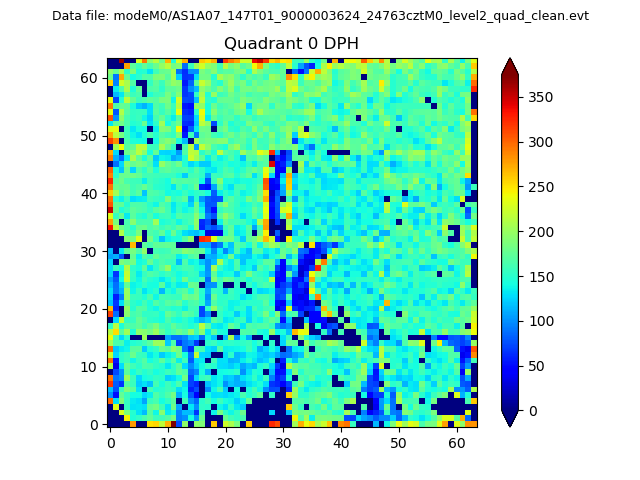 |
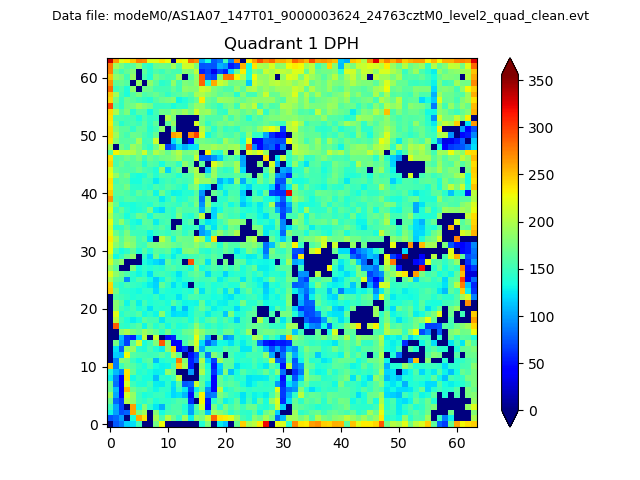 |
Quadrant B |
|---|---|---|---|
| Quadrant D | 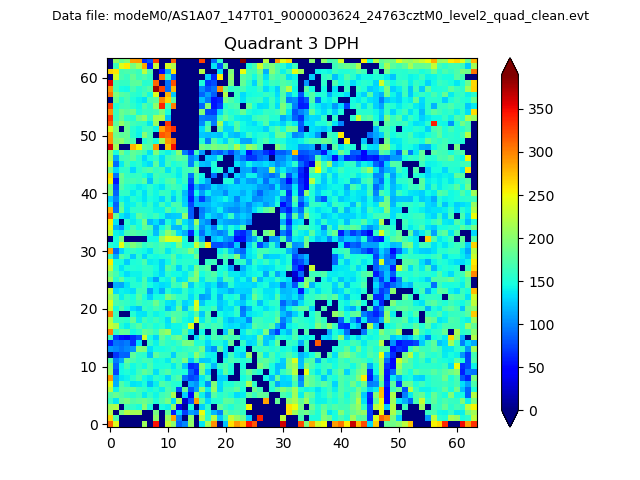 |
 |
Quadrant C |
| Plot type | Count rate plots | Images |
|---|---|---|
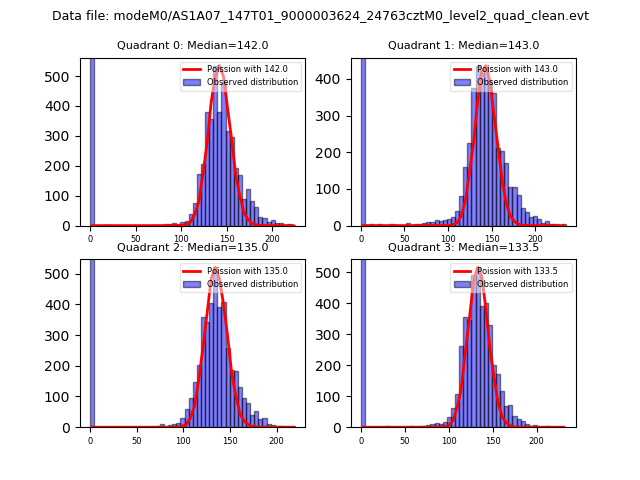
| Comparison with Poisson distribution Blue bars denote a histogram of data divided into 1 sec bins. Red curve is a Poisson curve with rate = median count rate of data. |
 |
 |
| Quadrant-wise count rates Data is divided into 100 sec bins |
 |
|
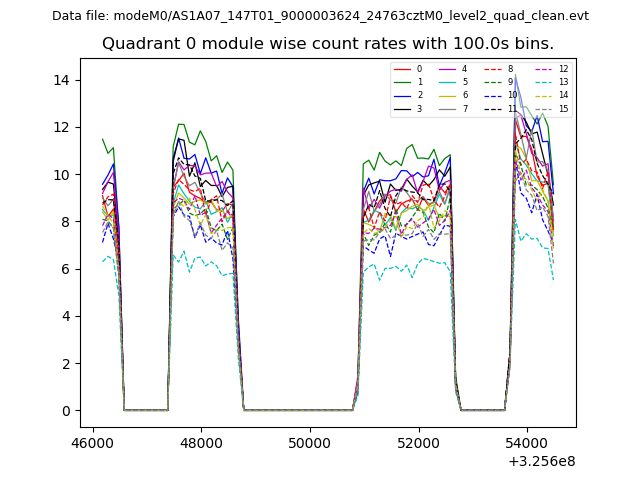
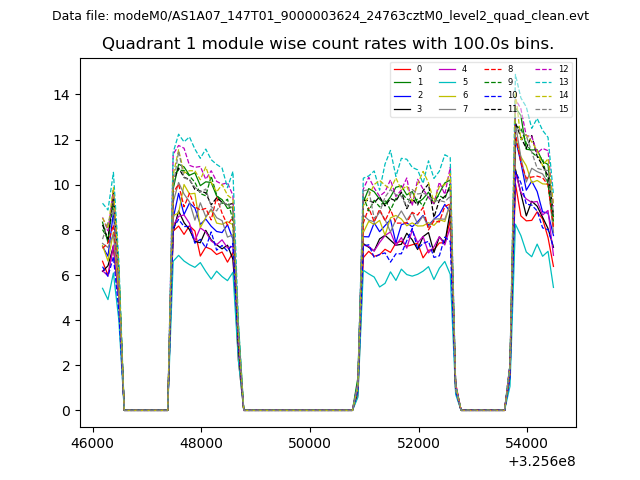
| Module-wise count rates for Quadrant A Data is divided into 100 sec bins |
 |
 |
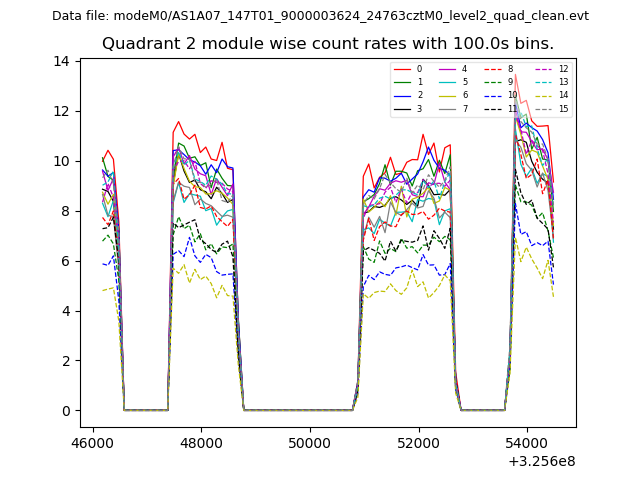
| Module-wise count rates for Quadrant B Data is divided into 100 sec bins |
 |
 |
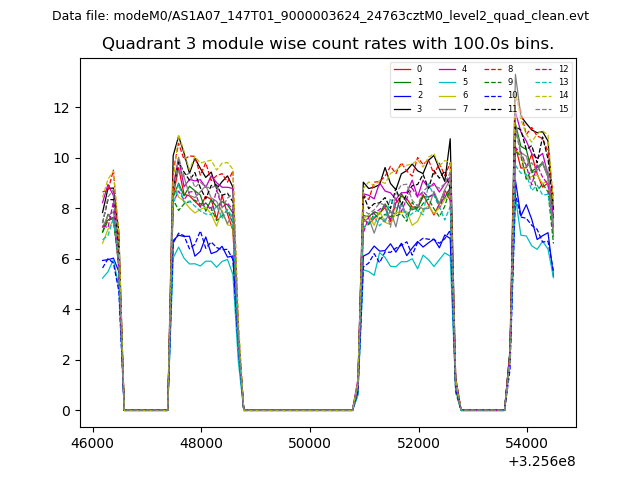
| Module-wise count rates for Quadrant C Data is divided into 100 sec bins |
 |
 |
| Module-wise count rates for Quadrant D Data is divided into 100 sec bins |
 |
 |
| Parameter | Plot |
|---|---|
| CZT HV Monitor | 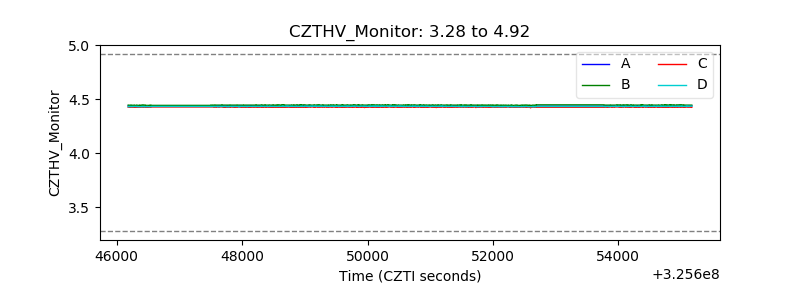 |
| D_VDD | 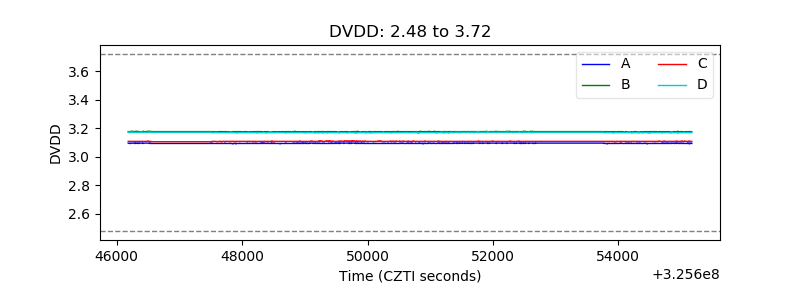 |
| Temperature 1 | 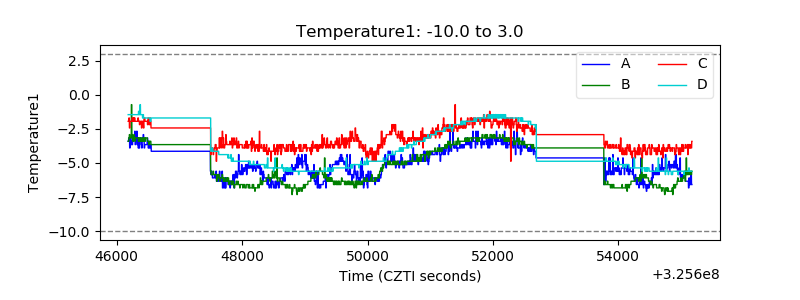 |
| Veto HV Monitor | 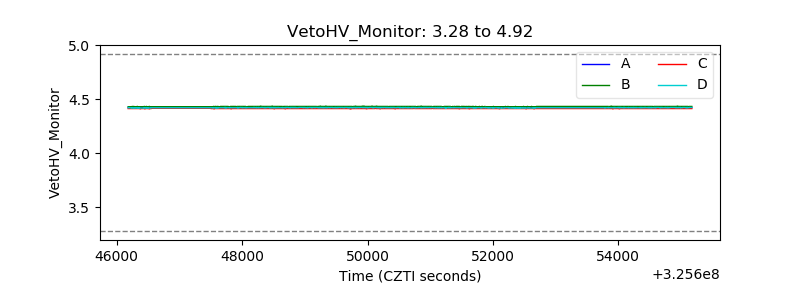 |
| Veto LLD | 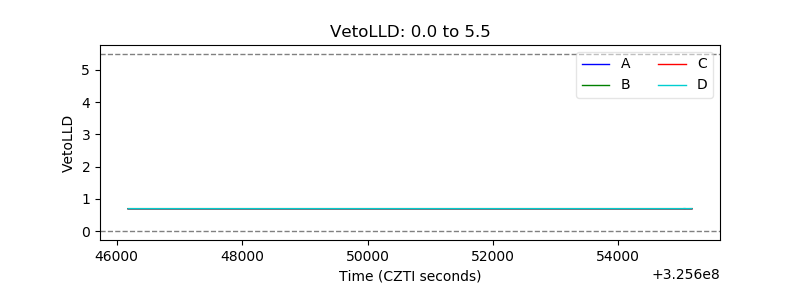 |
| Alpha Counter | 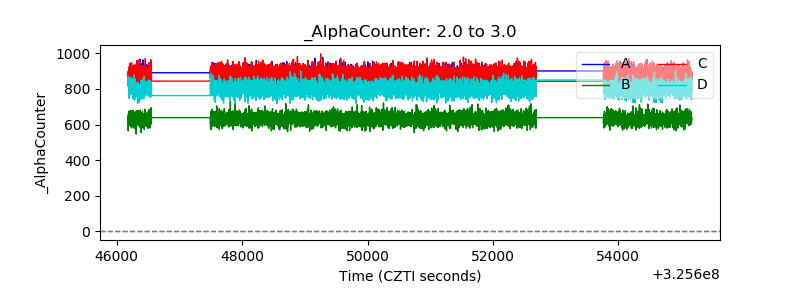 |
| _CPM_Rate | 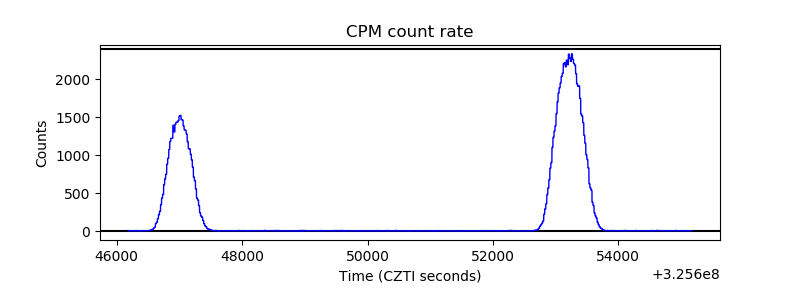 |
| CZT Counter | 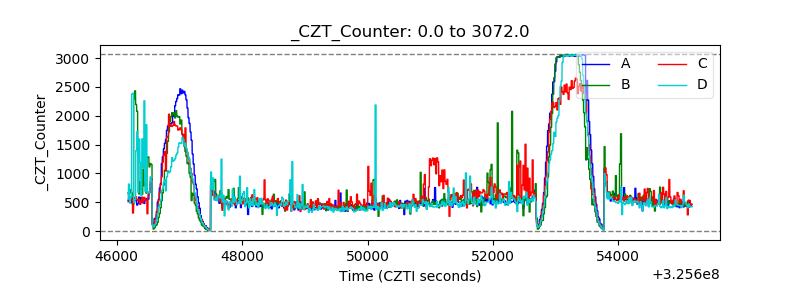 |
| +2.5 Volts monitor |  |
| +5 Volts monitor |  |
| _ROLL_ROT | 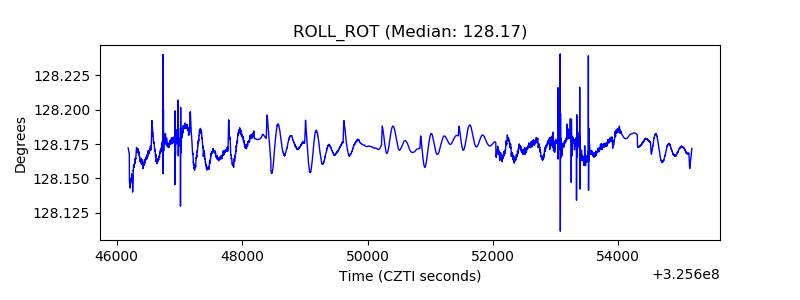 |
| _Roll_DEC | 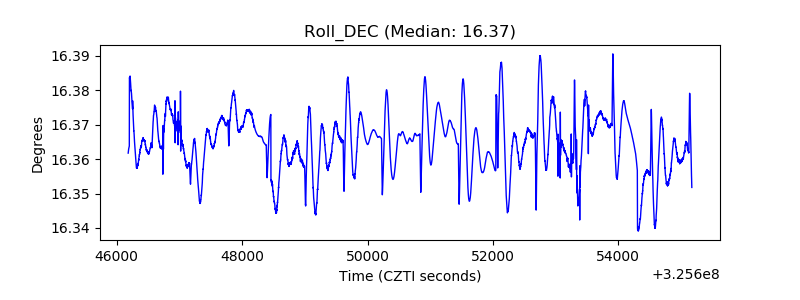 |
| _Roll_RA |  |
| Veto Counter | 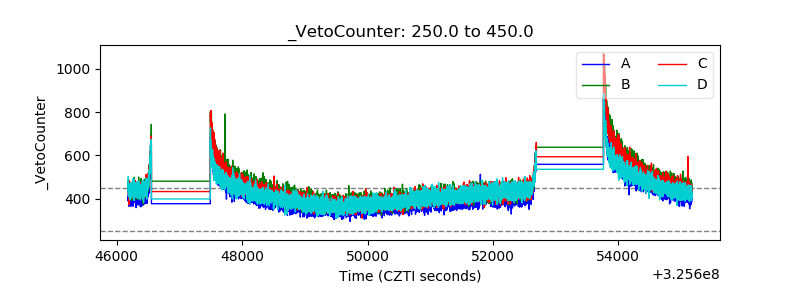 |