| Param | Original file | Final file |
|---|---|---|
| Filename | modeM0/AS1A07_147T01_9000003624_24764cztM0_level2.evt | modeM0/AS1A07_147T01_9000003624_24764cztM0_level2_quad_clean.evt |
| Size (bytes) | 468,383,040 | 79,050,240 |
| Size | 446.7 MB | 75.4 MB |
| Events in quadrant A | 3,314,161 | 497,947 |
| Events in quadrant B | 3,511,879 | 508,506 |
| Events in quadrant C | 3,584,611 | 474,022 |
| Events in quadrant D | 3,339,157 | 466,145 |
| Mode M0 | |||
|---|---|---|---|
| Quadrant | BADHDUFLAG | Total packets | Discarded packets |
| A | 0 | 13626 | 2 |
| B | 0 | 14220 | 2 |
| C | 0 | 14509 | 3 |
| D | 0 | 13928 | 2 |
| Mode SS | |||
|---|---|---|---|
| Quadrant | BADHDUFLAG | Total packets | Discarded packets |
| A | 0 | 134 | 0 |
| B | 0 | 134 | 0 |
| C | 0 | 132 | 0 |
| D | 0 | 132 | 0 |
| Mode M9 | |||
|---|---|---|---|
| Quadrant | BADHDUFLAG | Total packets | Discarded packets |
| A | 0 | 22 | 0 |
| B | 0 | 22 | 0 |
| C | 0 | 22 | 0 |
| D | 0 | 22 | 0 |
| Quadrant | Total seconds | Saturated seconds | Saturation percentage |
|---|---|---|---|
| A | 6406 | 53 | 0.827349% |
| B | 6406 | 89 | 1.389323% |
| C | 6405 | 123 | 1.920375% |
| D | 6405 | 35 | 0.546448% |
Noise dominated data is calculated using 1-second bins in cleaned event files. If a bin has >2000 counts, and if more than 50% of those come from <1% of pixels, then it is considered to be noise-dominated and hence unusable.
| Quadrant | # 1 sec bins | Bins with >0 counts | Bins with >2000 counts | High rate bins dominated by noise | Noise dominated (total time) | Noise dominated (detector-on time) | Marked lightcurve |
|---|---|---|---|---|---|---|---|
| A | 8671 | 6408 | 0 | 0 | 0.00% | 0.00% | 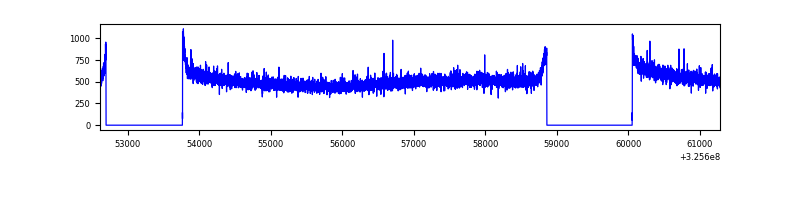 |
| B | 8671 | 6408 | 11 | 11 | 0.13% | 0.17% | 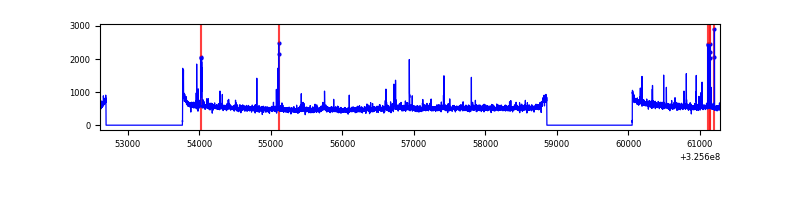 |
| C | 8670 | 6407 | 29 | 29 | 0.33% | 0.45% | 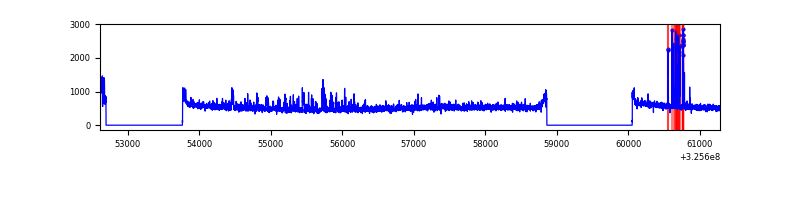 |
| D | 8670 | 6407 | 8 | 8 | 0.09% | 0.12% | 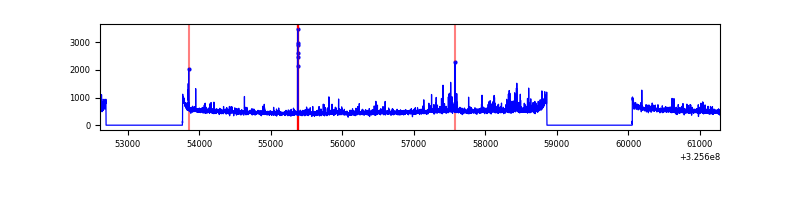 |
Top three noisy pixels from each quadrant. If the there are fewer than three noisy pixels in the level2.evt file, extra rows are filled as -1
| Pixel properties | Quadrant properties | ||||||
|---|---|---|---|---|---|---|---|
| Quadrant | DetID | PixID | Counts | Sigma | Mean | Median | Sigma |
| A | 13 | 254 | 9119 | 48.43 | 859 | 843 | 170.9 |
| A | 3 | 137 | 7563 | 39.32 | 859 | 843 | 170.9 |
| A | 0 | 226 | 7247 | 37.47 | 859 | 843 | 170.9 |
| B | 3 | 64 | 112388 | 689.58 | 852 | 832 | 161.8 |
| B | 10 | 246 | 30212 | 181.61 | 852 | 832 | 161.8 |
| B | 12 | 111 | 19649 | 116.32 | 852 | 832 | 161.8 |
| C | 7 | 247 | 186155 | 979.97 | 808 | 816 | 189.1 |
| C | 14 | 238 | 131325 | 690.06 | 808 | 816 | 189.1 |
| C | 2 | 16 | 90732 | 475.43 | 808 | 816 | 189.1 |
| D | 8 | 195 | 181914 | 929.49 | 816 | 796 | 194.9 |
| D | 2 | 120 | 22504 | 111.4 | 816 | 796 | 194.9 |
| D | 2 | 234 | 22265 | 110.18 | 816 | 796 | 194.9 |
Histogram calculated using DETX and DETY for each event in the final _common_clean file
| Quadrant A | 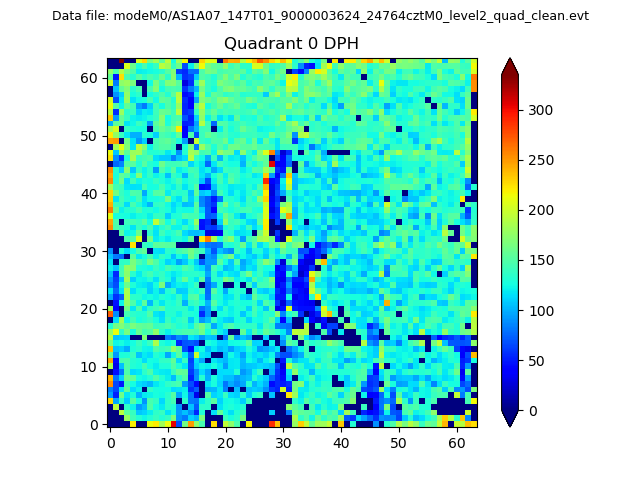 |
 |
Quadrant B |
|---|---|---|---|
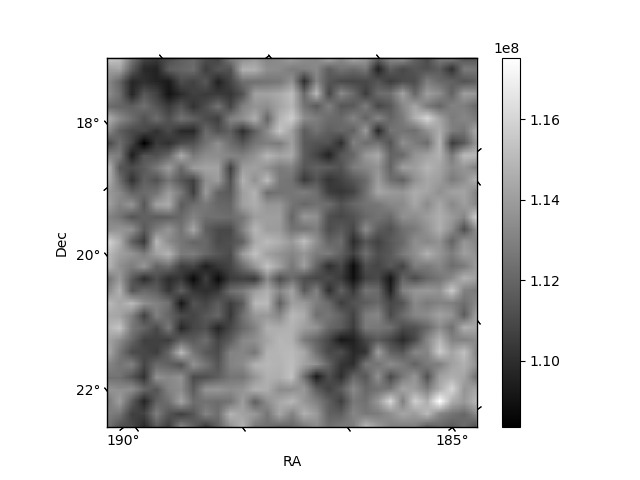
| Quadrant D | 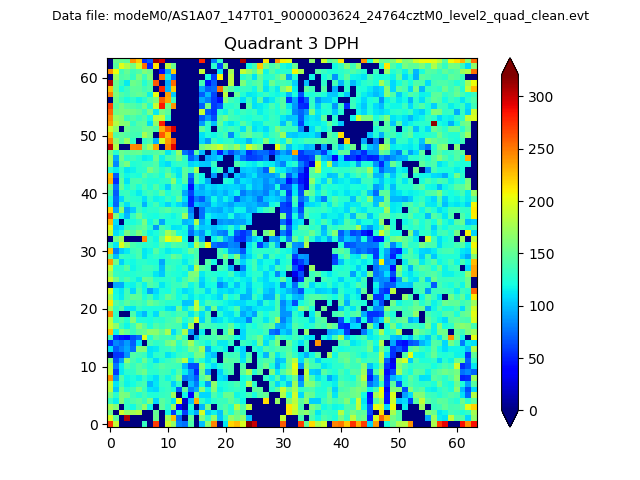 |
 |
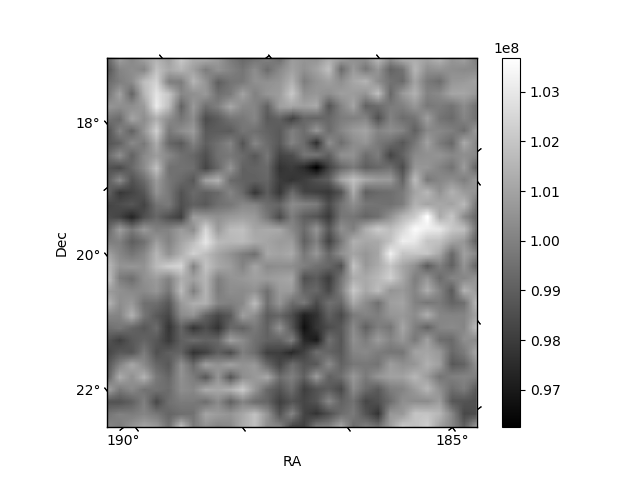
Quadrant C |
| Plot type | Count rate plots | Images |
|---|---|---|
| Comparison with Poisson distribution Blue bars denote a histogram of data divided into 1 sec bins. Red curve is a Poisson curve with rate = median count rate of data. |
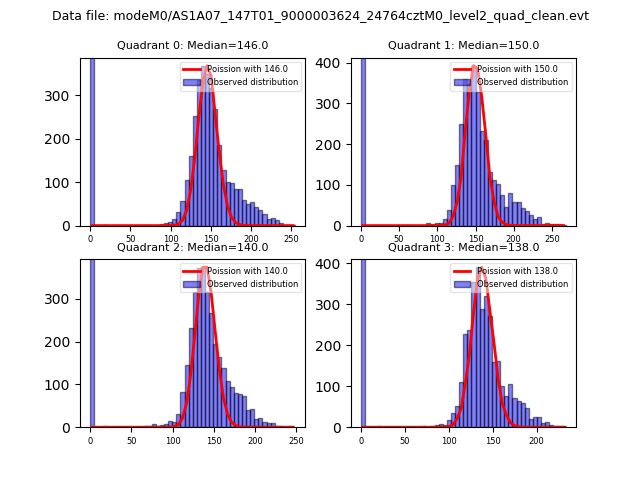 |
 |
| Quadrant-wise count rates Data is divided into 100 sec bins |
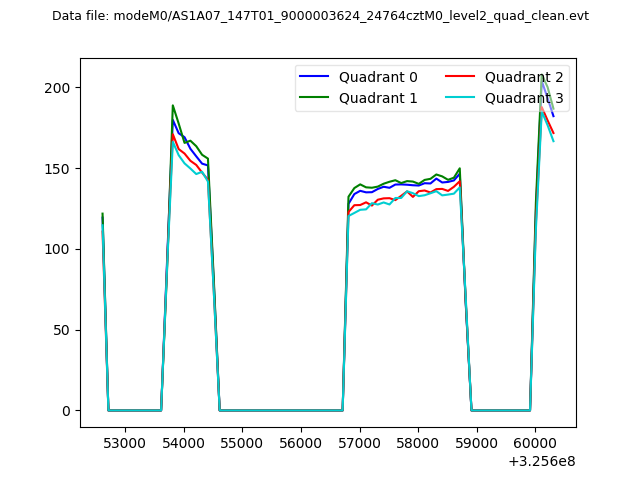 |
|
| Module-wise count rates for Quadrant A Data is divided into 100 sec bins |
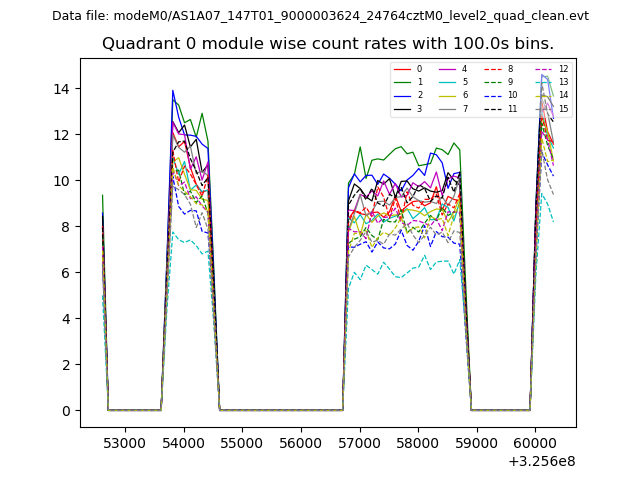 |
 |
| Module-wise count rates for Quadrant B Data is divided into 100 sec bins |
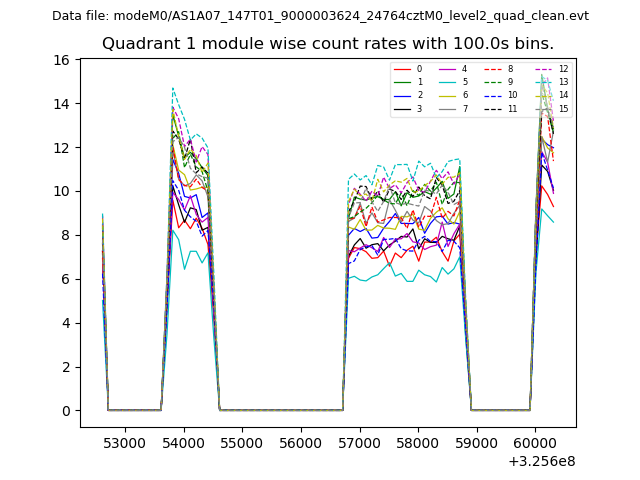 |
 |
| Module-wise count rates for Quadrant C Data is divided into 100 sec bins |
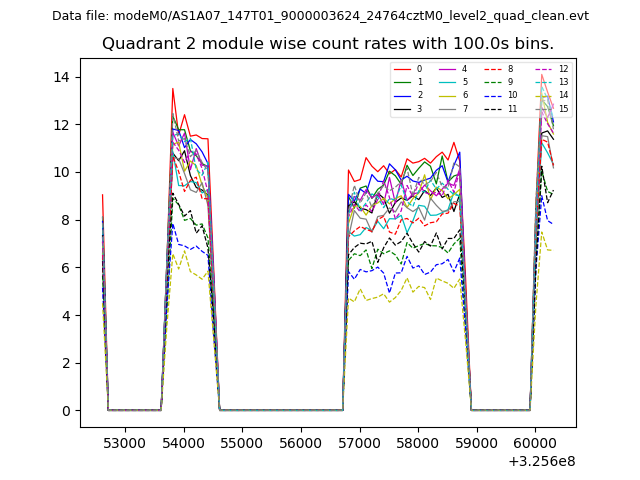 |
 |
| Module-wise count rates for Quadrant D Data is divided into 100 sec bins |
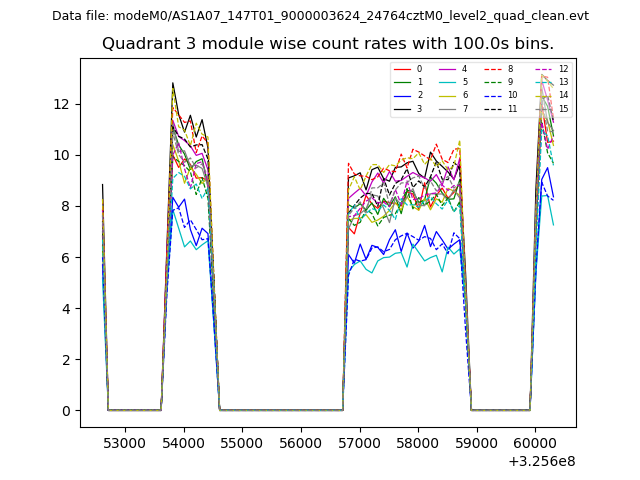 |
 |
| Parameter | Plot |
|---|---|
| CZT HV Monitor | 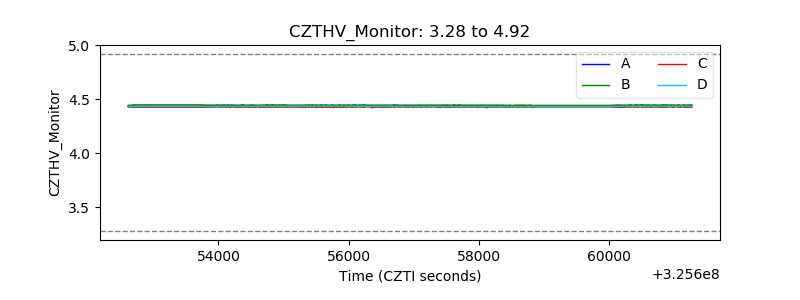 |
| D_VDD | 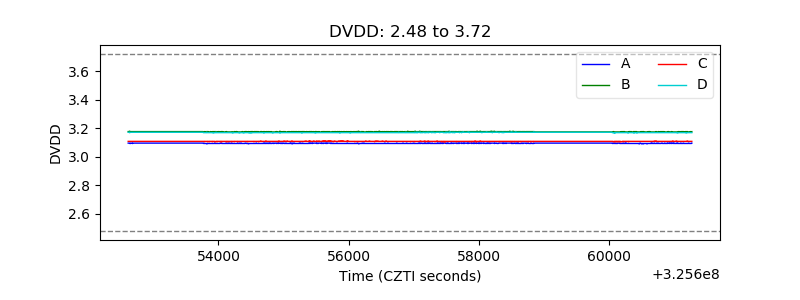 |
| Temperature 1 |  |
| Veto HV Monitor | 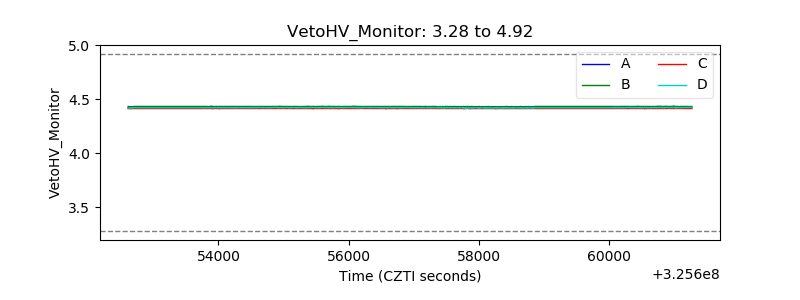 |
| Veto LLD | 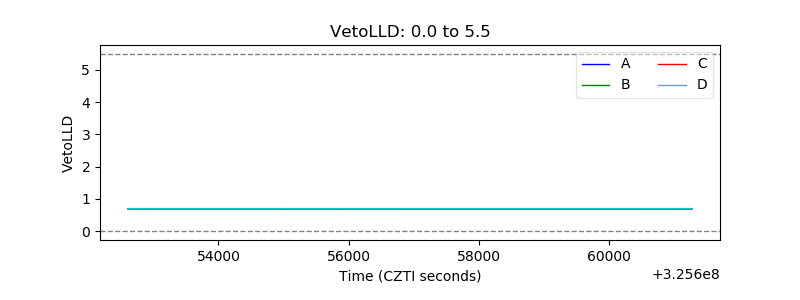 |
| Alpha Counter | 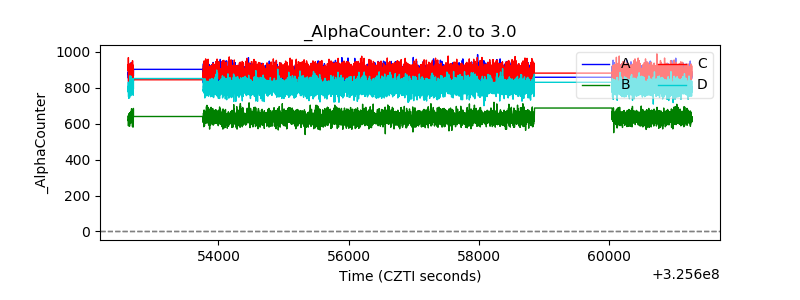 |
| _CPM_Rate | 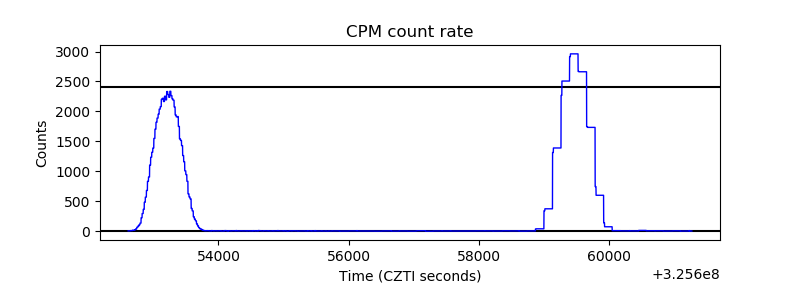 |
| CZT Counter | 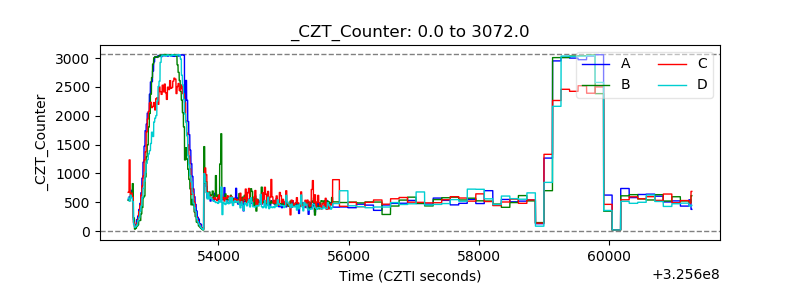 |
| +2.5 Volts monitor |  |
| +5 Volts monitor | 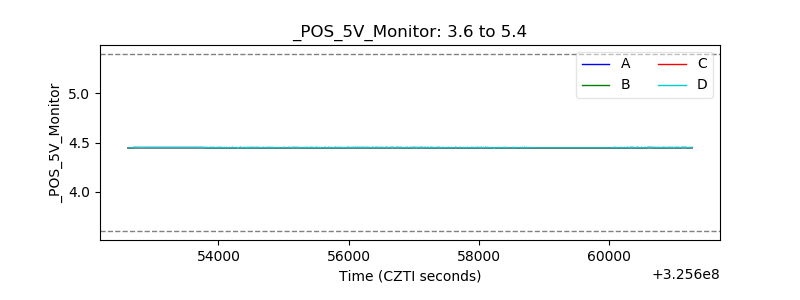 |
| _ROLL_ROT |  |
| _Roll_DEC | 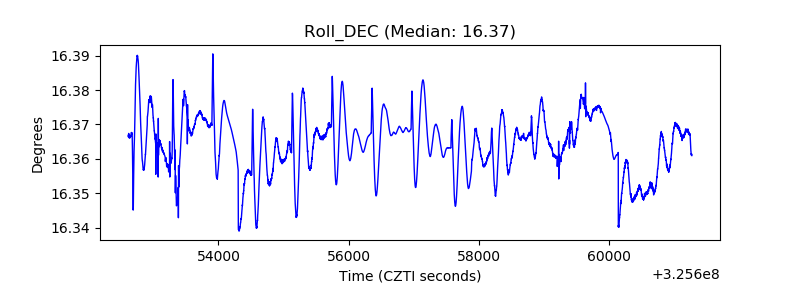 |
| _Roll_RA | 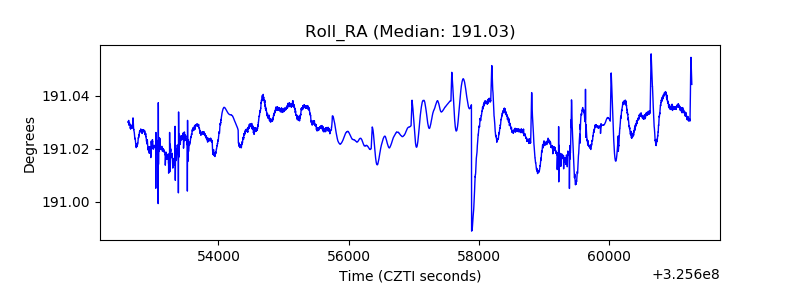 |
| Veto Counter | 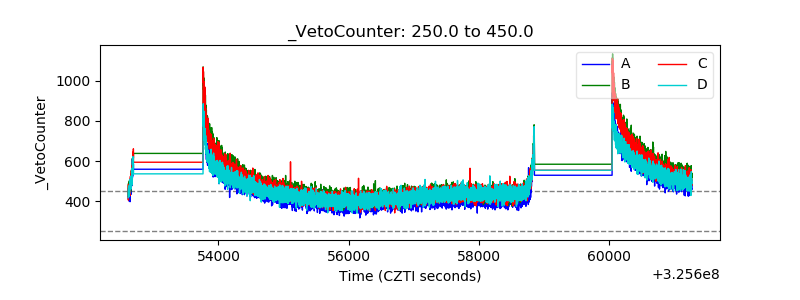 |