| Param | Original file | Final file |
|---|---|---|
| Filename | modeM0/AS1A07_147T01_9000003624_24765cztM0_level2.evt | modeM0/AS1A07_147T01_9000003624_24765cztM0_level2_quad_clean.evt |
| Size (bytes) | 478,437,120 | 67,204,800 |
| Size | 456.3 MB | 64.1 MB |
| Events in quadrant A | 3,379,521 | 412,074 |
| Events in quadrant B | 3,611,514 | 416,804 |
| Events in quadrant C | 3,551,239 | 389,317 |
| Events in quadrant D | 3,523,472 | 380,762 |
| Mode M0 | |||
|---|---|---|---|
| Quadrant | BADHDUFLAG | Total packets | Discarded packets |
| A | 0 | 13650 | 2 |
| B | 0 | 14528 | 2 |
| C | 0 | 14199 | 2 |
| D | 0 | 14255 | 3 |
| Mode SS | |||
|---|---|---|---|
| Quadrant | BADHDUFLAG | Total packets | Discarded packets |
| A | 0 | 128 | 0 |
| B | 0 | 128 | 0 |
| C | 0 | 128 | 0 |
| D | 0 | 128 | 0 |
| Mode M9 | |||
|---|---|---|---|
| Quadrant | BADHDUFLAG | Total packets | Discarded packets |
| A | 0 | 21 | 0 |
| B | 0 | 22 | 0 |
| C | 0 | 22 | 0 |
| D | 0 | 22 | 0 |
| Quadrant | Total seconds | Saturated seconds | Saturation percentage |
|---|---|---|---|
| A | 6241 | 22 | 0.352508% |
| B | 6241 | 76 | 1.217754% |
| C | 6241 | 78 | 1.249800% |
| D | 6240 | 16 | 0.256410% |
Noise dominated data is calculated using 1-second bins in cleaned event files. If a bin has >2000 counts, and if more than 50% of those come from <1% of pixels, then it is considered to be noise-dominated and hence unusable.
| Quadrant | # 1 sec bins | Bins with >0 counts | Bins with >2000 counts | High rate bins dominated by noise | Noise dominated (total time) | Noise dominated (detector-on time) | Marked lightcurve |
|---|---|---|---|---|---|---|---|
| A | 7546 | 6242 | 0 | 0 | 0.00% | 0.00% | 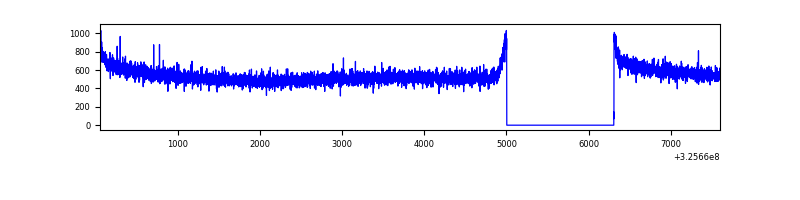 |
| B | 7546 | 6242 | 24 | 24 | 0.32% | 0.38% | 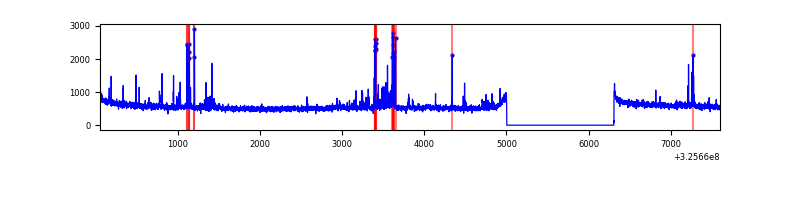 |
| C | 7546 | 6242 | 29 | 29 | 0.38% | 0.46% | 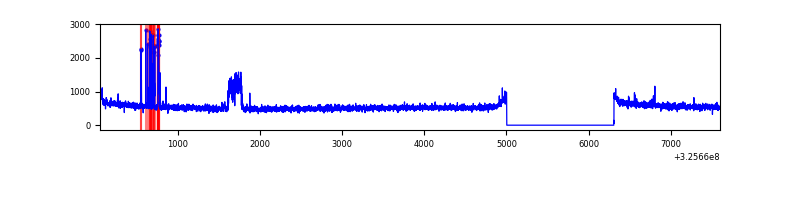 |
| D | 7545 | 6241 | 9 | 9 | 0.12% | 0.14% |  |
Top three noisy pixels from each quadrant. If the there are fewer than three noisy pixels in the level2.evt file, extra rows are filled as -1
| Pixel properties | Quadrant properties | ||||||
|---|---|---|---|---|---|---|---|
| Quadrant | DetID | PixID | Counts | Sigma | Mean | Median | Sigma |
| A | 13 | 254 | 8703 | 44.89 | 877 | 863 | 174.6 |
| A | 0 | 226 | 7468 | 37.82 | 877 | 863 | 174.6 |
| A | 3 | 137 | 7362 | 37.22 | 877 | 863 | 174.6 |
| B | 3 | 64 | 100592 | 607.81 | 867 | 849 | 164.1 |
| B | 10 | 246 | 70432 | 424.02 | 867 | 849 | 164.1 |
| B | 12 | 111 | 19346 | 112.72 | 867 | 849 | 164.1 |
| C | 7 | 247 | 133327 | 703.03 | 818 | 829 | 188.5 |
| C | 14 | 238 | 131421 | 692.92 | 818 | 829 | 188.5 |
| C | 2 | 16 | 95205 | 500.76 | 818 | 829 | 188.5 |
| D | 8 | 195 | 276081 | 1376.03 | 828 | 807 | 200.0 |
| D | 12 | 233 | 103196 | 511.82 | 828 | 807 | 200.0 |
| D | 1 | 52 | 24396 | 117.92 | 828 | 807 | 200.0 |
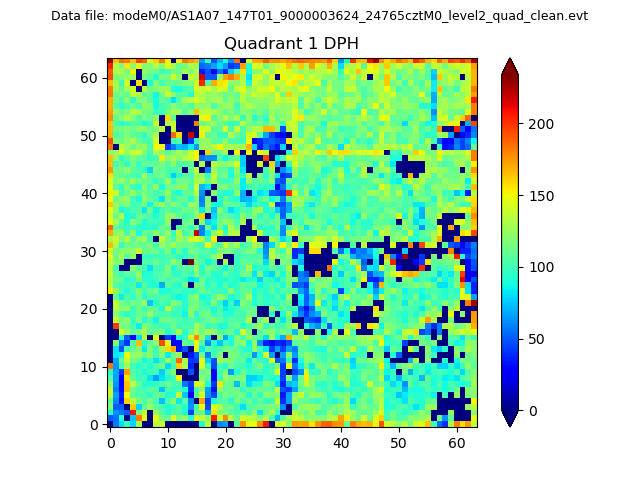
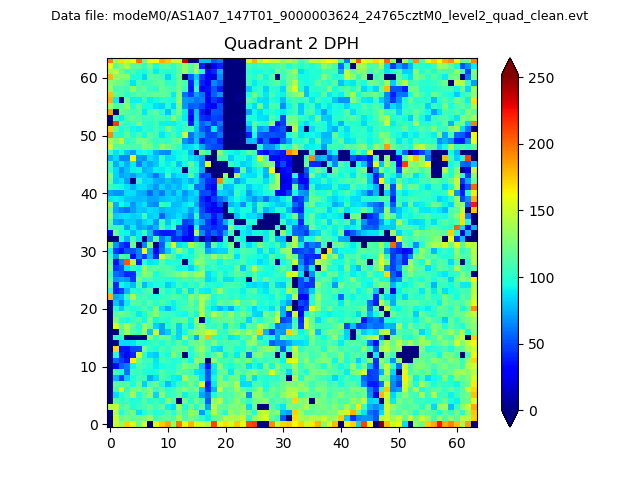
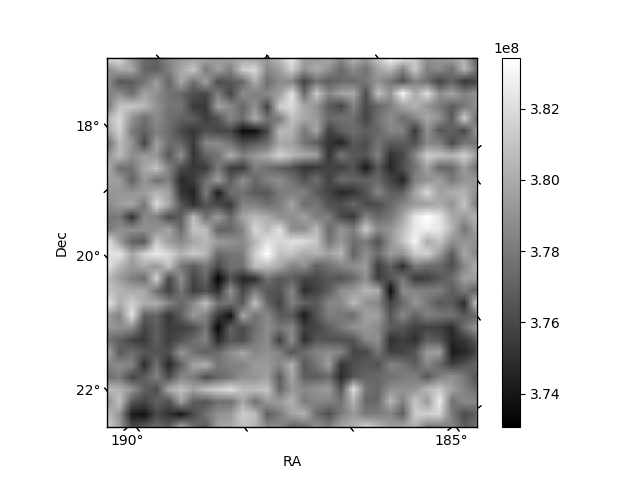
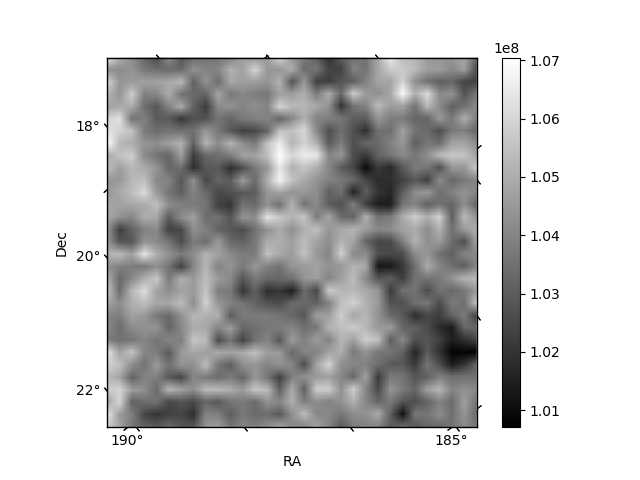
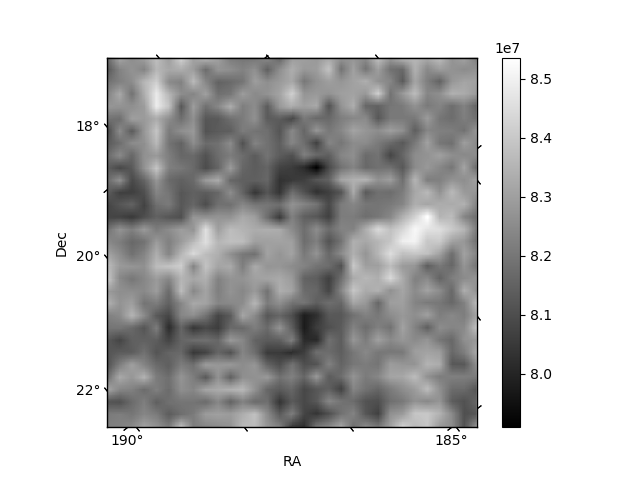
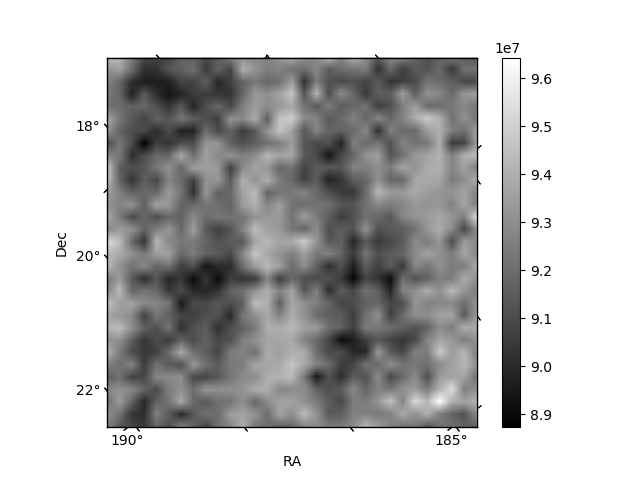
Histogram calculated using DETX and DETY for each event in the final _common_clean file
| Quadrant A | 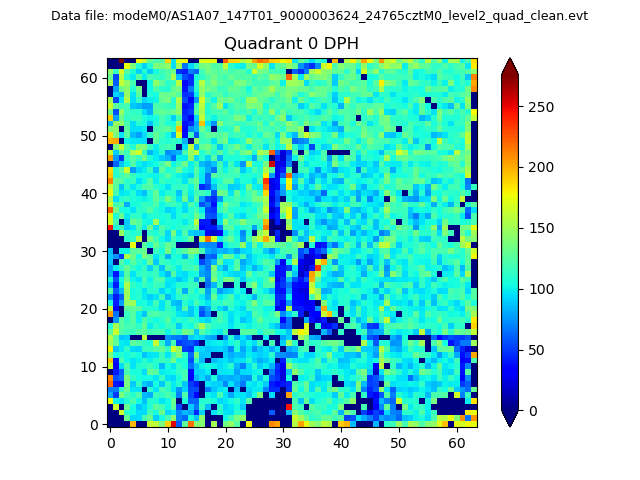 |
 |
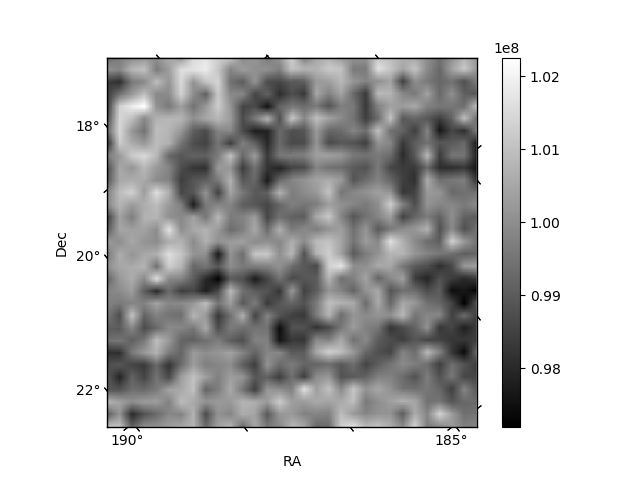
Quadrant B |
|---|---|---|---|
| Quadrant D | 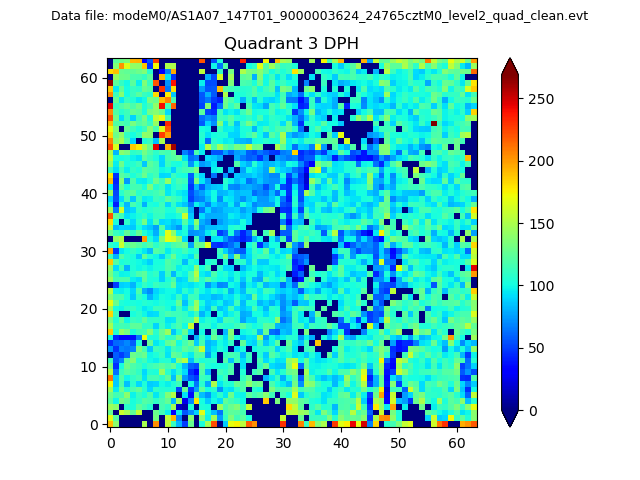 |
 |
Quadrant C |
| Plot type | Count rate plots | Images |
|---|---|---|
| Comparison with Poisson distribution Blue bars denote a histogram of data divided into 1 sec bins. Red curve is a Poisson curve with rate = median count rate of data. |
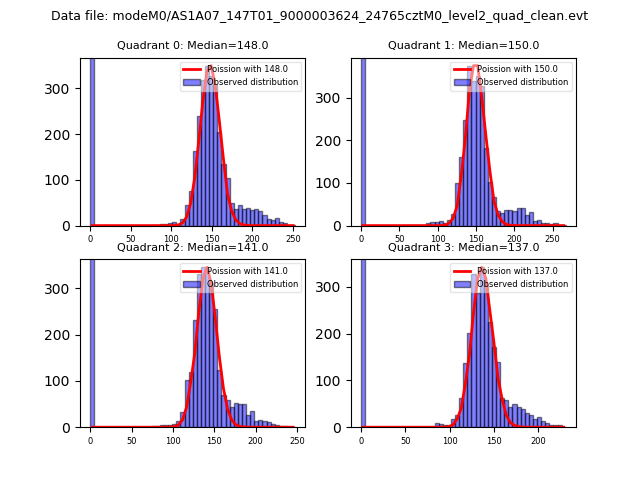 |
 |
| Quadrant-wise count rates Data is divided into 100 sec bins |
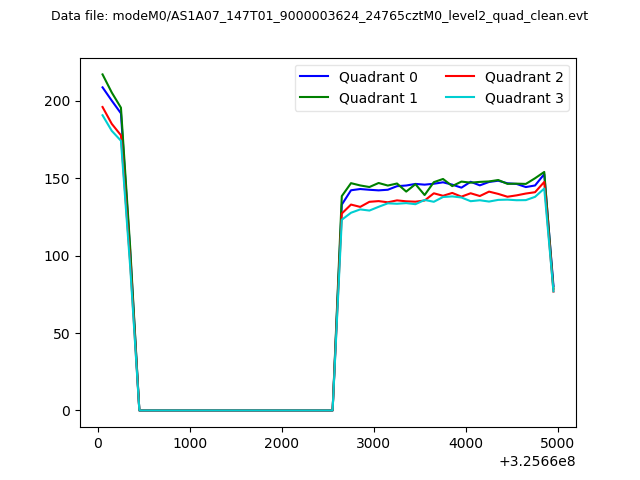 |
|
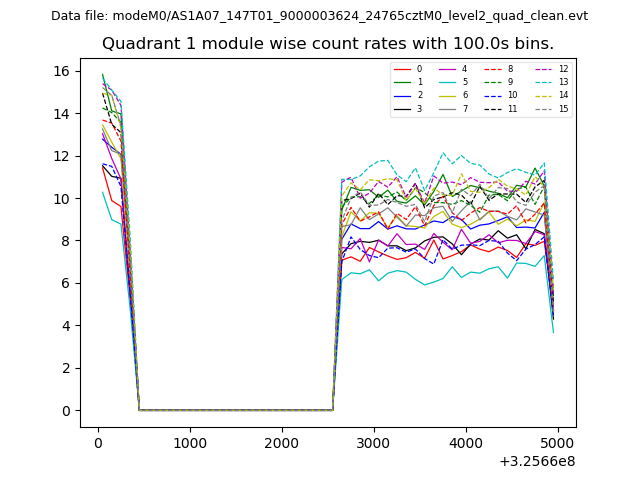
| Module-wise count rates for Quadrant A Data is divided into 100 sec bins |
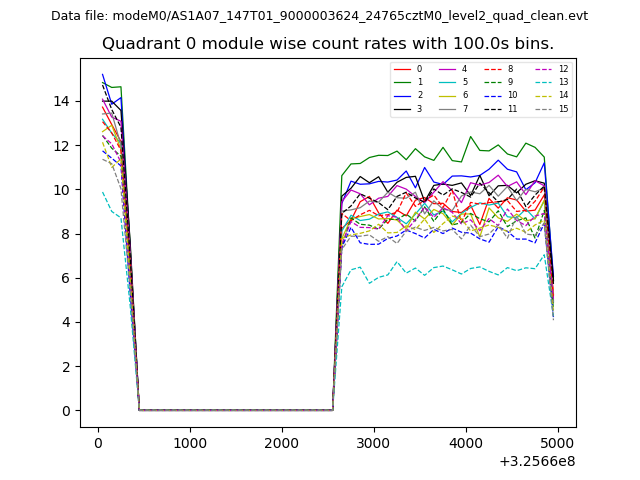 |
 |
| Module-wise count rates for Quadrant B Data is divided into 100 sec bins |
 |
 |
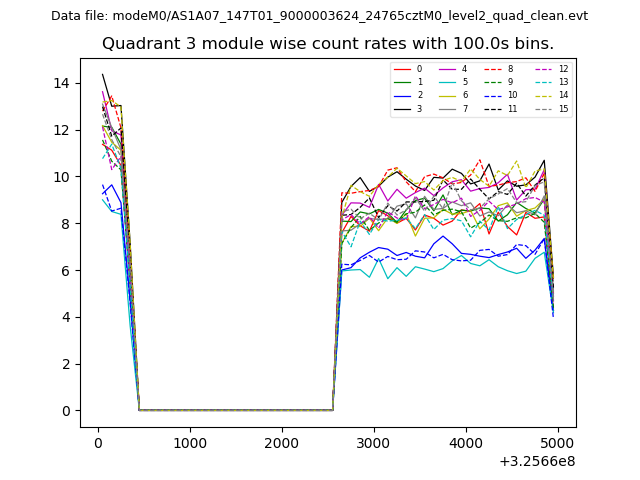
| Module-wise count rates for Quadrant C Data is divided into 100 sec bins |
 |
 |
| Module-wise count rates for Quadrant D Data is divided into 100 sec bins |
 |
 |
| Parameter | Plot |
|---|---|
| CZT HV Monitor | 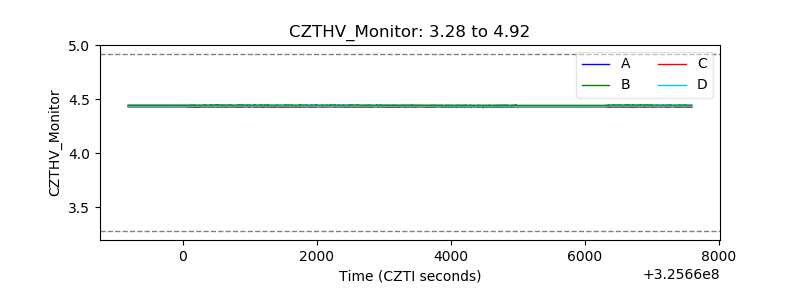 |
| D_VDD |  |
| Temperature 1 | 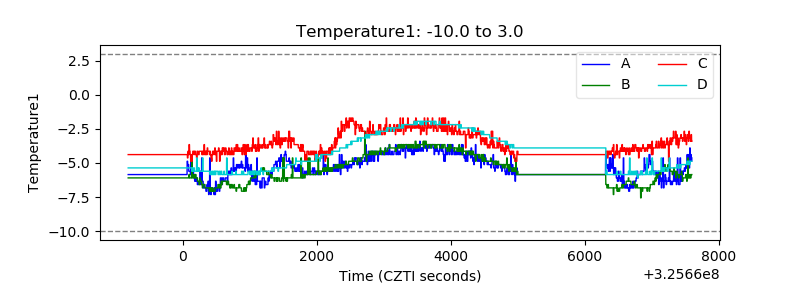 |
| Veto HV Monitor | 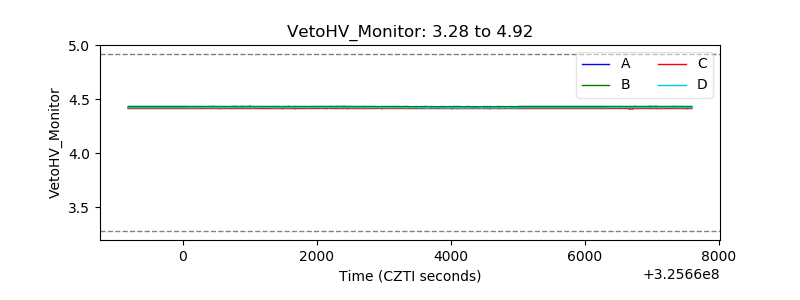 |
| Veto LLD |  |
| Alpha Counter | 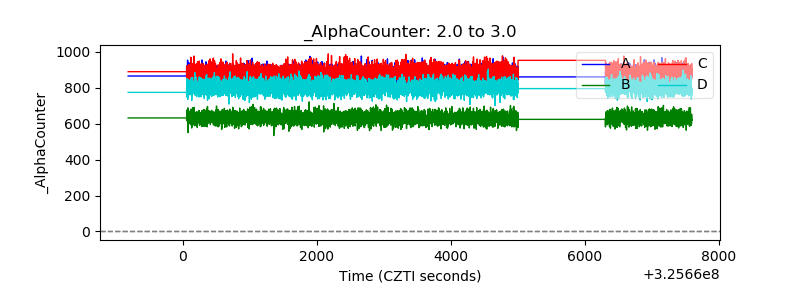 |
| _CPM_Rate | 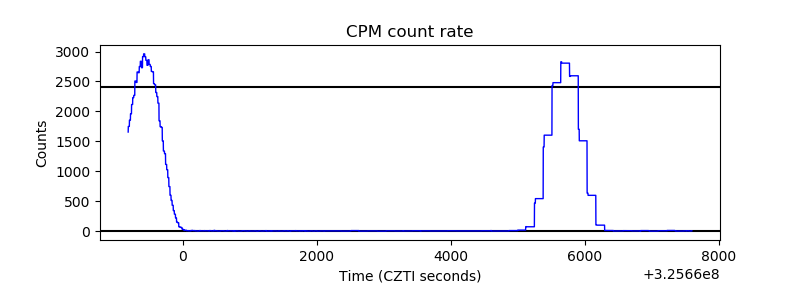 |
| CZT Counter | 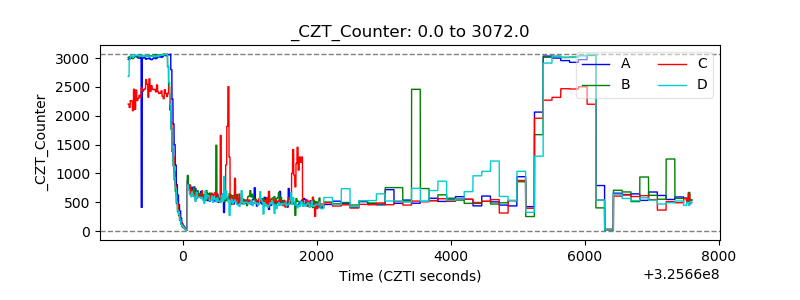 |
| +2.5 Volts monitor |  |
| +5 Volts monitor |  |
| _ROLL_ROT | 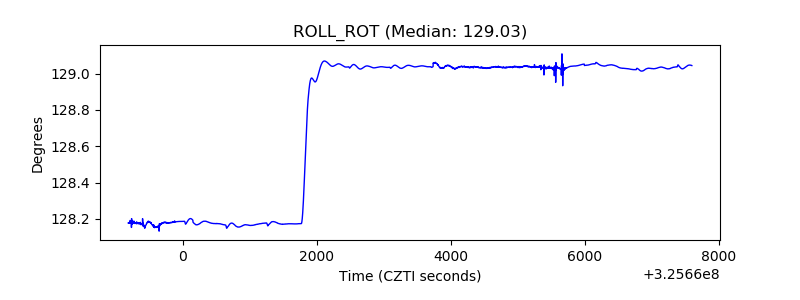 |
| _Roll_DEC | 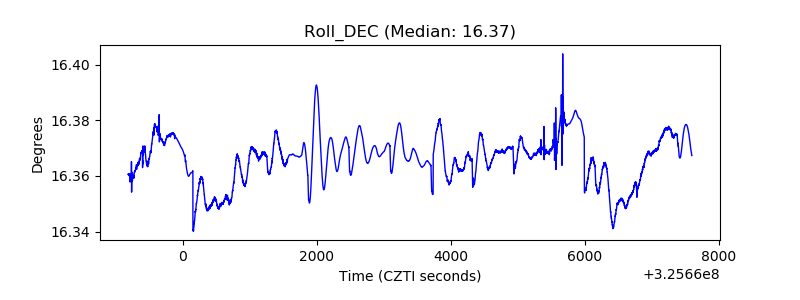 |
| _Roll_RA | 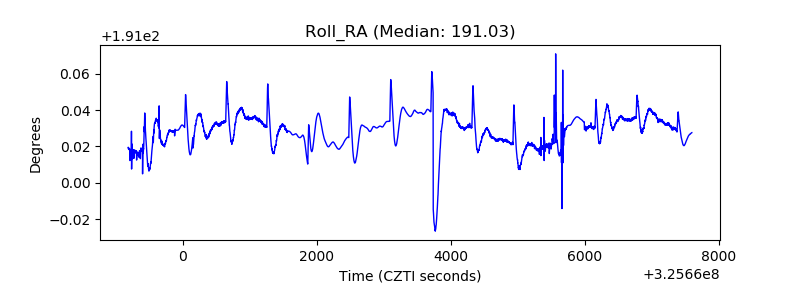 |
| Veto Counter | 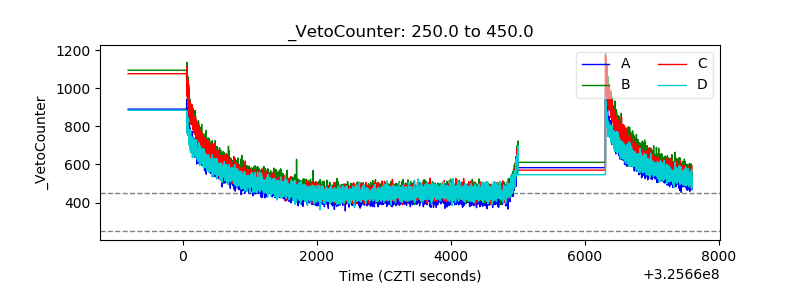 |