| Param | Original file | Final file |
|---|---|---|
| Filename | modeM0/AS1A07_147T01_9000003624_24766cztM0_level2.evt | modeM0/AS1A07_147T01_9000003624_24766cztM0_level2_quad_clean.evt |
| Size (bytes) | 473,086,080 | 66,234,240 |
| Size | 451.2 MB | 63.2 MB |
| Events in quadrant A | 3,400,801 | 407,106 |
| Events in quadrant B | 3,547,758 | 411,358 |
| Events in quadrant C | 3,355,698 | 384,022 |
| Events in quadrant D | 3,609,713 | 377,348 |
| Mode M0 | |||
|---|---|---|---|
| Quadrant | BADHDUFLAG | Total packets | Discarded packets |
| A | 0 | 13641 | 2 |
| B | 0 | 14254 | 2 |
| C | 0 | 13475 | 2 |
| D | 0 | 14346 | 3 |
| Mode SS | |||
|---|---|---|---|
| Quadrant | BADHDUFLAG | Total packets | Discarded packets |
| A | 0 | 124 | 0 |
| B | 0 | 124 | 0 |
| C | 0 | 124 | 0 |
| D | 0 | 124 | 0 |
| Mode M9 | |||
|---|---|---|---|
| Quadrant | BADHDUFLAG | Total packets | Discarded packets |
| A | 0 | 21 | 0 |
| B | 0 | 22 | 0 |
| C | 0 | 22 | 0 |
| D | 0 | 22 | 0 |
| Quadrant | Total seconds | Saturated seconds | Saturation percentage |
|---|---|---|---|
| A | 6094 | 42 | 0.689202% |
| B | 6094 | 80 | 1.312767% |
| C | 6094 | 69 | 1.132261% |
| D | 6093 | 35 | 0.574430% |
Noise dominated data is calculated using 1-second bins in cleaned event files. If a bin has >2000 counts, and if more than 50% of those come from <1% of pixels, then it is considered to be noise-dominated and hence unusable.
| Quadrant | # 1 sec bins | Bins with >0 counts | Bins with >2000 counts | High rate bins dominated by noise | Noise dominated (total time) | Noise dominated (detector-on time) | Marked lightcurve |
|---|---|---|---|---|---|---|---|
| A | 7449 | 6095 | 1 | 1 | 0.01% | 0.02% | 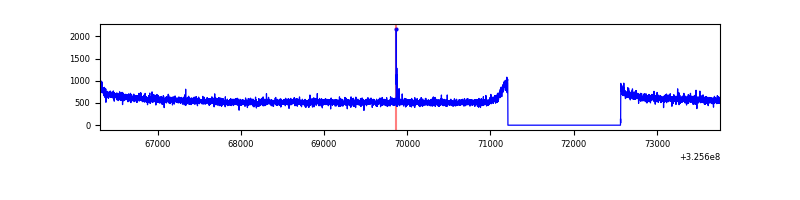 |
| B | 7449 | 6095 | 7 | 7 | 0.09% | 0.11% | 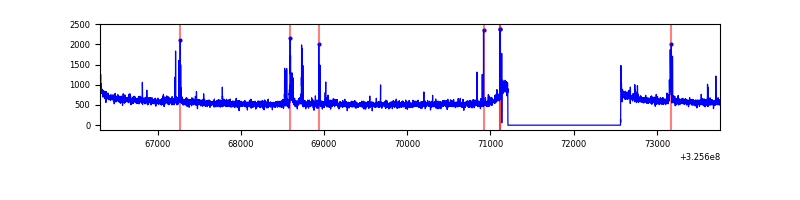 |
| C | 7449 | 6095 | 0 | 0 | 0.00% | 0.00% | 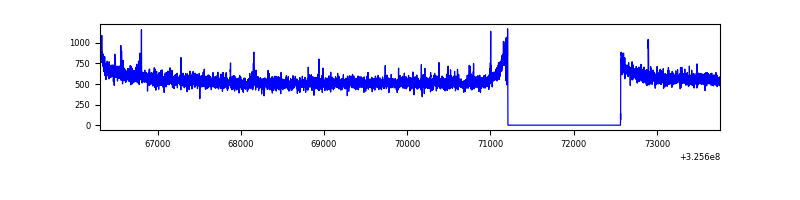 |
| D | 7448 | 6094 | 17 | 17 | 0.23% | 0.28% | 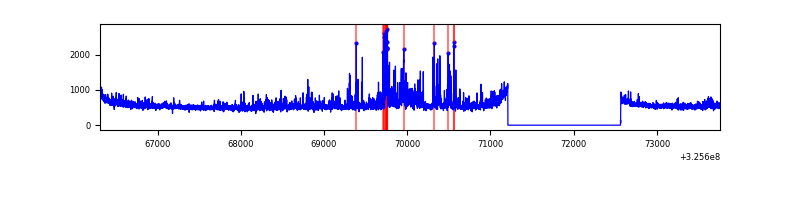 |
Top three noisy pixels from each quadrant. If the there are fewer than three noisy pixels in the level2.evt file, extra rows are filled as -1
| Pixel properties | Quadrant properties | ||||||
|---|---|---|---|---|---|---|---|
| Quadrant | DetID | PixID | Counts | Sigma | Mean | Median | Sigma |
| A | 12 | 96 | 9051 | 47.16 | 879 | 866 | 173.6 |
| A | 13 | 254 | 8067 | 41.49 | 879 | 866 | 173.6 |
| A | 0 | 226 | 7590 | 38.74 | 879 | 866 | 173.6 |
| B | 3 | 64 | 115129 | 707.64 | 867 | 850 | 161.5 |
| B | 12 | 111 | 19236 | 113.85 | 867 | 850 | 161.5 |
| B | 11 | 111 | 17450 | 102.79 | 867 | 850 | 161.5 |
| C | 14 | 238 | 133361 | 702.67 | 817 | 825 | 188.6 |
| C | 2 | 16 | 18708 | 94.81 | 817 | 825 | 188.6 |
| C | 7 | 247 | 16259 | 81.83 | 817 | 825 | 188.6 |
| D | 8 | 195 | 224384 | 1117.66 | 830 | 808 | 200.0 |
| D | 12 | 233 | 220807 | 1099.77 | 830 | 808 | 200.0 |
| D | 1 | 52 | 35465 | 173.25 | 830 | 808 | 200.0 |
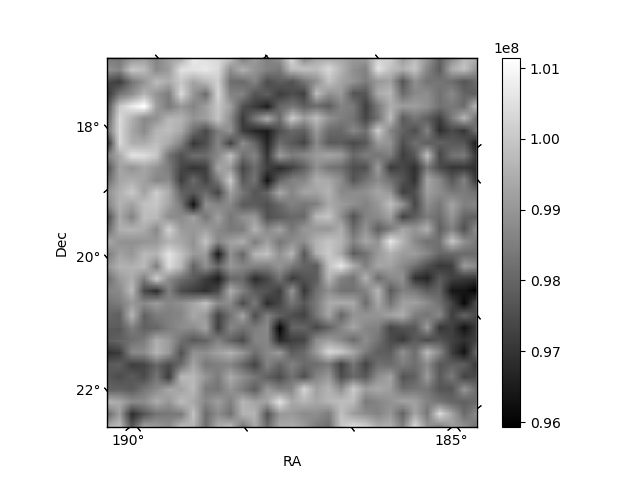
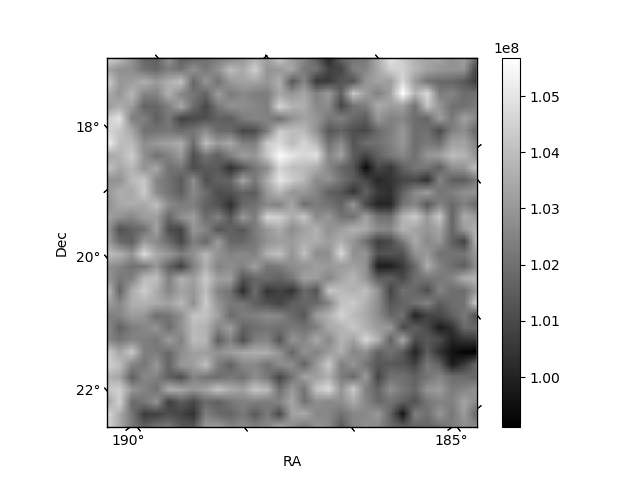
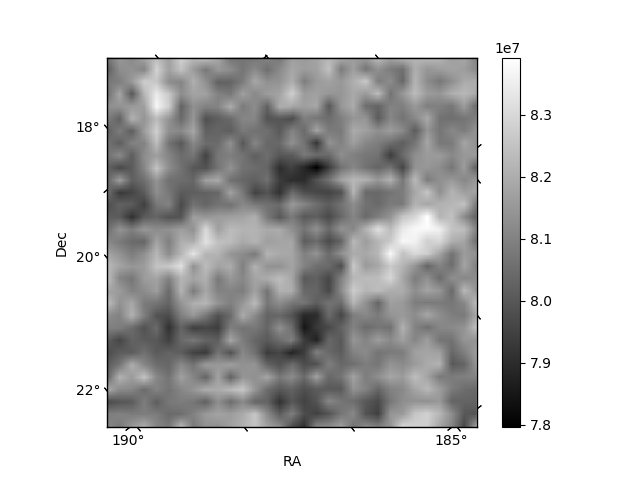
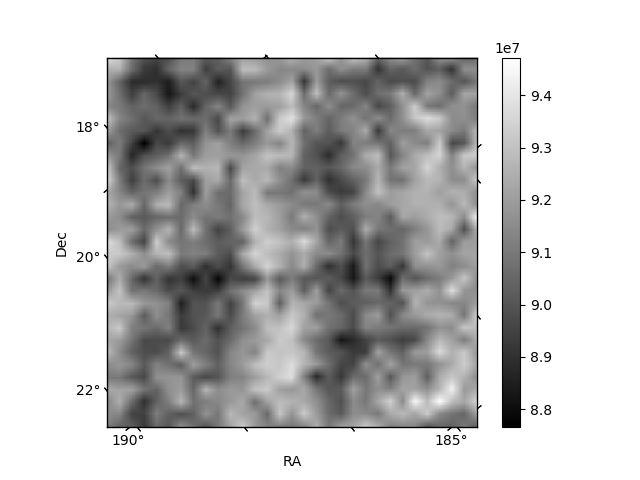
Histogram calculated using DETX and DETY for each event in the final _common_clean file
| Quadrant A |  |
 |
Quadrant B |
|---|---|---|---|
| Quadrant D |  |
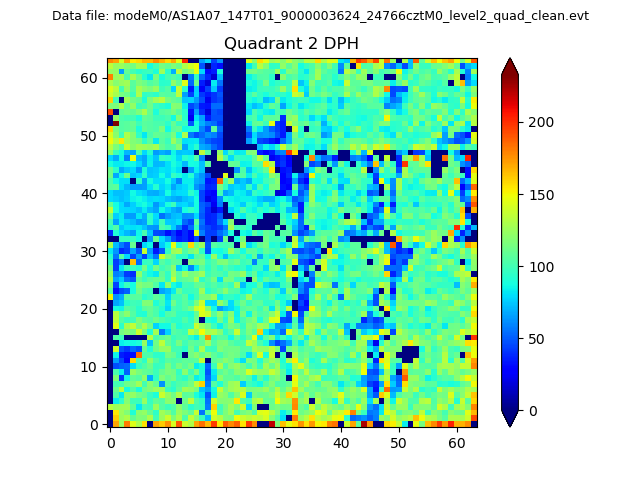 |
Quadrant C |
| Plot type | Count rate plots | Images |
|---|---|---|
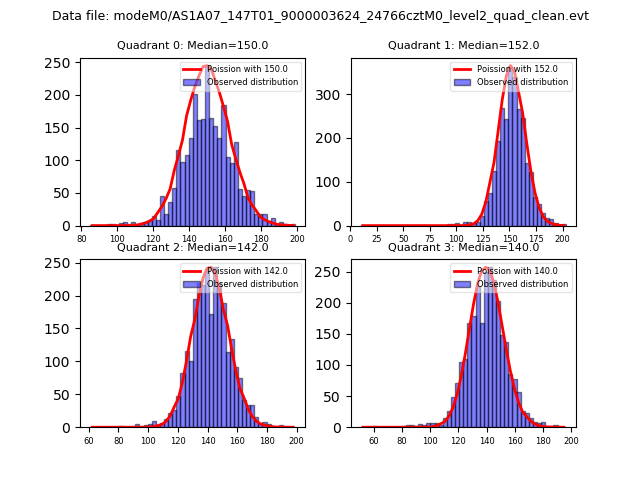
| Comparison with Poisson distribution Blue bars denote a histogram of data divided into 1 sec bins. Red curve is a Poisson curve with rate = median count rate of data. |
 |
 |
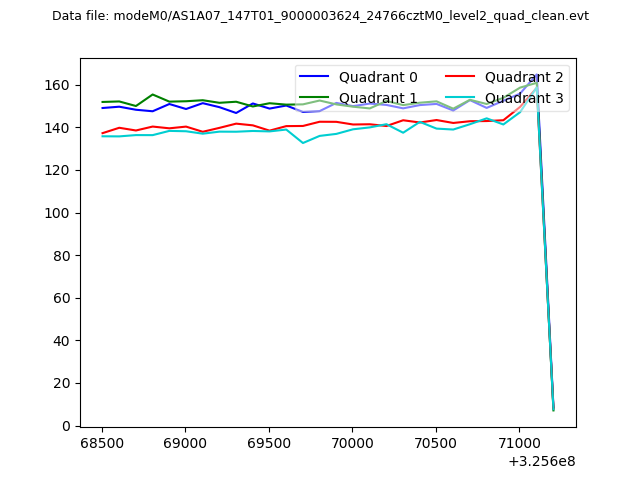
| Quadrant-wise count rates Data is divided into 100 sec bins |
 |
|
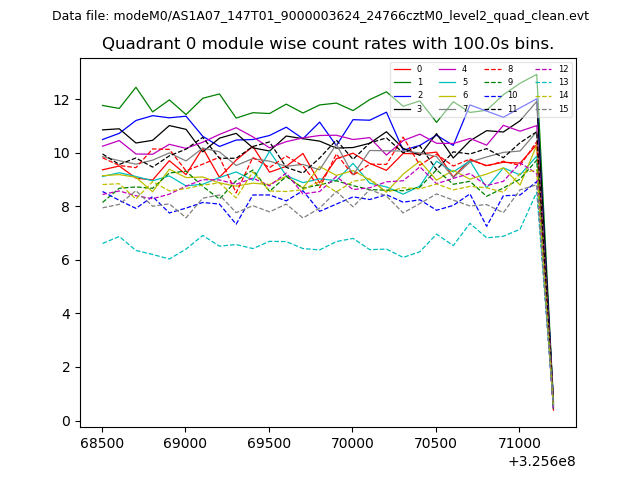
| Module-wise count rates for Quadrant A Data is divided into 100 sec bins |
 |
 |
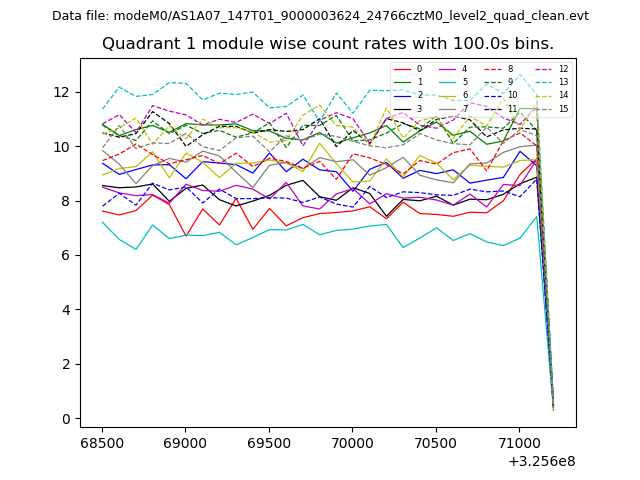
| Module-wise count rates for Quadrant B Data is divided into 100 sec bins |
 |
 |
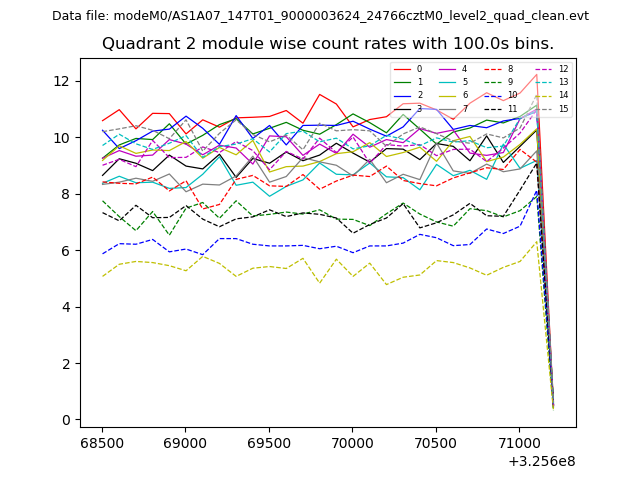
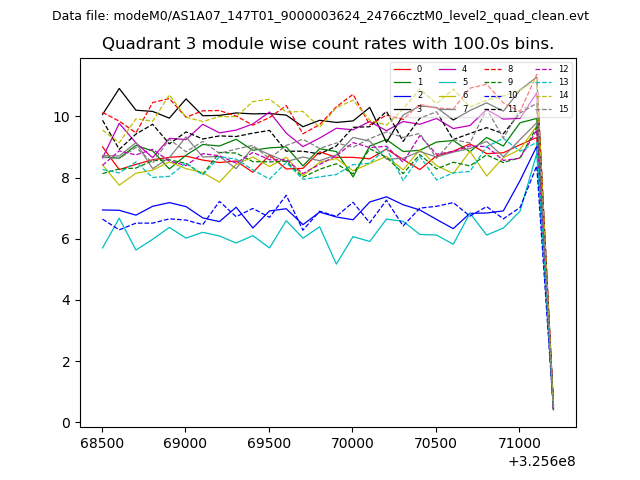
| Module-wise count rates for Quadrant C Data is divided into 100 sec bins |
 |
 |
| Module-wise count rates for Quadrant D Data is divided into 100 sec bins |
 |
 |
| Parameter | Plot |
|---|---|
| CZT HV Monitor | 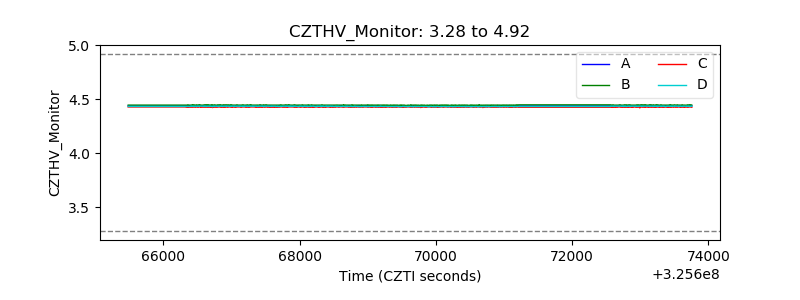 |
| D_VDD | 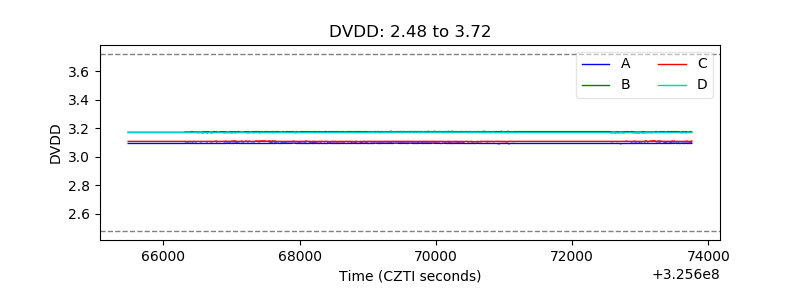 |
| Temperature 1 | 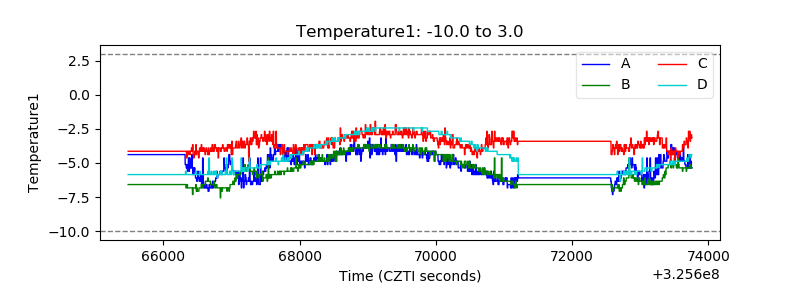 |
| Veto HV Monitor | 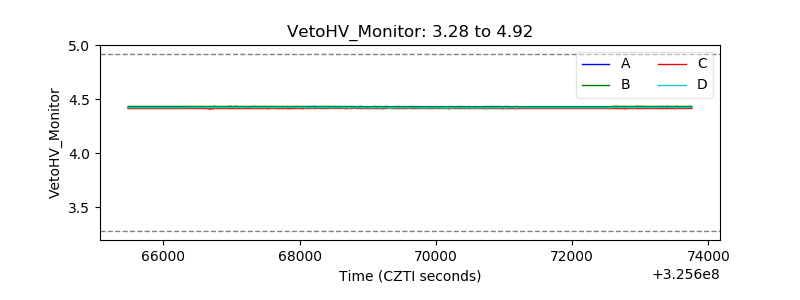 |
| Veto LLD | 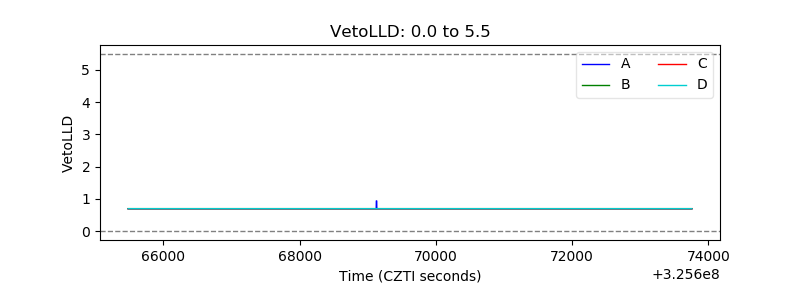 |
| Alpha Counter | 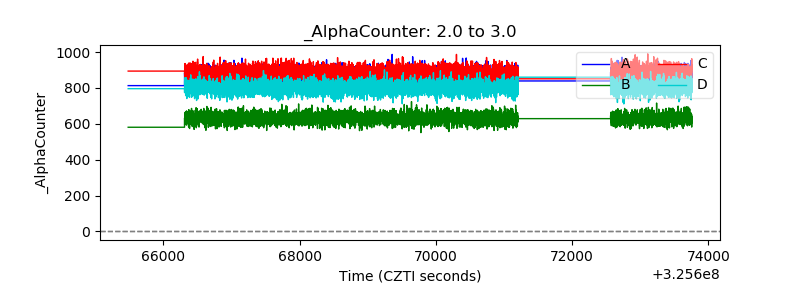 |
| _CPM_Rate | 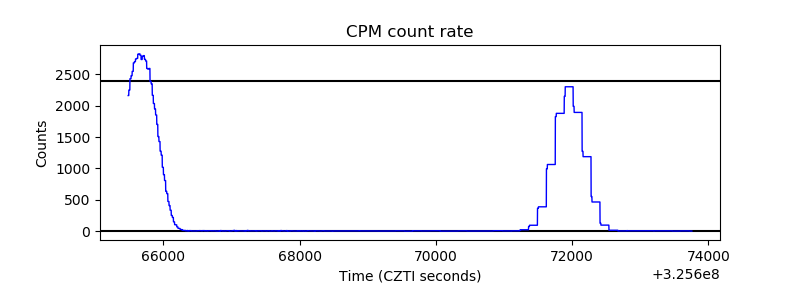 |
| CZT Counter | 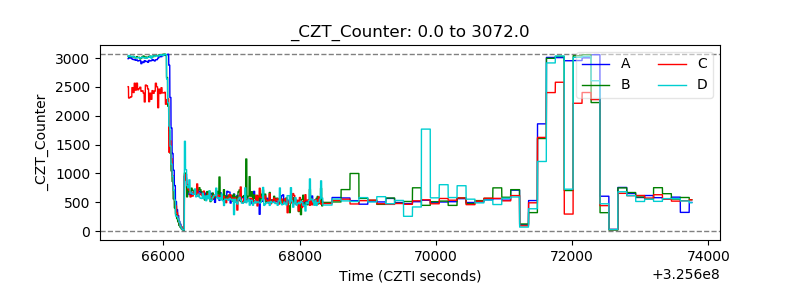 |
| +2.5 Volts monitor |  |
| +5 Volts monitor | 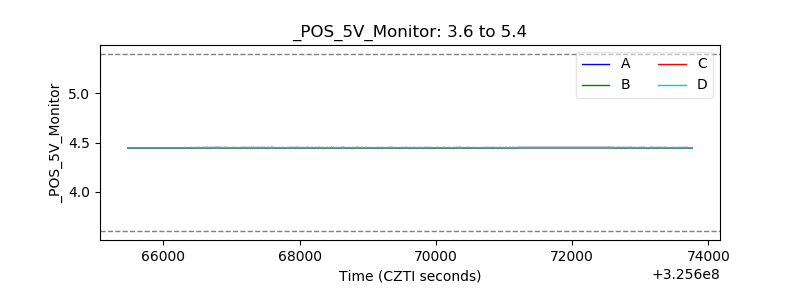 |
| _ROLL_ROT | 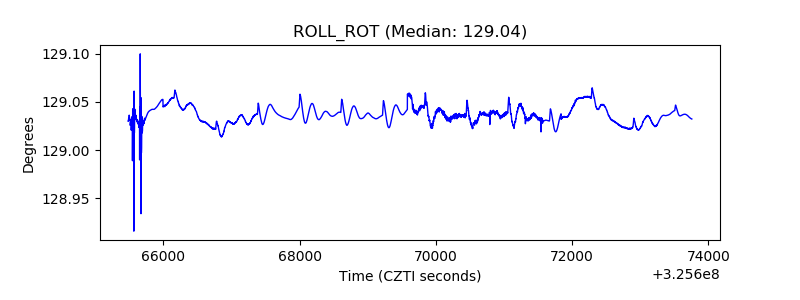 |
| _Roll_DEC | 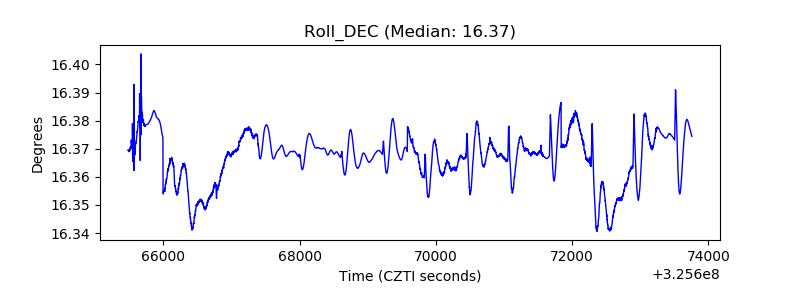 |
| _Roll_RA | 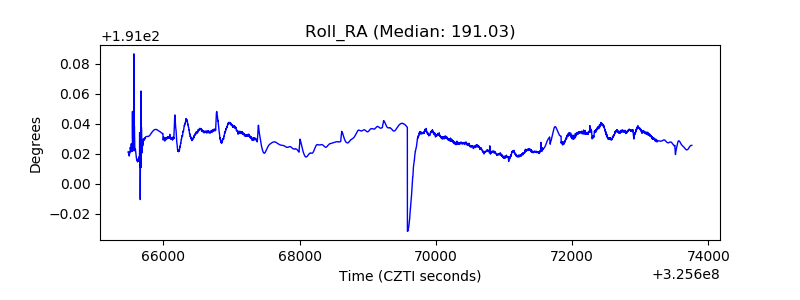 |
| Veto Counter | 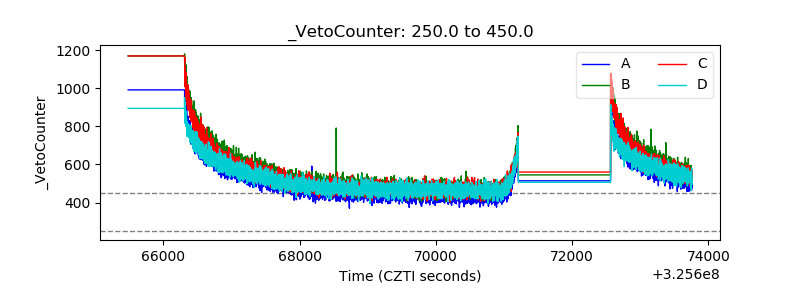 |