| Param | Original file | Final file |
|---|---|---|
| Filename | modeM0/AS1A07_147T01_9000003624_24767cztM0_level2.evt | modeM0/AS1A07_147T01_9000003624_24767cztM0_level2_quad_clean.evt |
| Size (bytes) | 524,327,040 | 79,159,680 |
| Size | 500.0 MB | 75.5 MB |
| Events in quadrant A | 3,611,962 | 502,209 |
| Events in quadrant B | 4,204,717 | 501,505 |
| Events in quadrant C | 3,619,039 | 471,748 |
| Events in quadrant D | 4,000,455 | 465,773 |
| Mode M0 | |||
|---|---|---|---|
| Quadrant | BADHDUFLAG | Total packets | Discarded packets |
| A | 0 | 14466 | 2 |
| B | 0 | 16474 | 2 |
| C | 0 | 14515 | 2 |
| D | 0 | 15889 | 2 |
| Mode SS | |||
|---|---|---|---|
| Quadrant | BADHDUFLAG | Total packets | Discarded packets |
| A | 0 | 132 | 0 |
| B | 0 | 132 | 0 |
| C | 0 | 132 | 0 |
| D | 0 | 132 | 0 |
| Mode M9 | |||
|---|---|---|---|
| Quadrant | BADHDUFLAG | Total packets | Discarded packets |
| A | 0 | 19 | 0 |
| B | 0 | 20 | 0 |
| C | 0 | 20 | 0 |
| D | 0 | 20 | 0 |
| Quadrant | Total seconds | Saturated seconds | Saturation percentage |
|---|---|---|---|
| A | 6536 | 94 | 1.438188% |
| B | 6536 | 218 | 3.335373% |
| C | 6536 | 127 | 1.943084% |
| D | 6536 | 69 | 1.055692% |
Noise dominated data is calculated using 1-second bins in cleaned event files. If a bin has >2000 counts, and if more than 50% of those come from <1% of pixels, then it is considered to be noise-dominated and hence unusable.
| Quadrant | # 1 sec bins | Bins with >0 counts | Bins with >2000 counts | High rate bins dominated by noise | Noise dominated (total time) | Noise dominated (detector-on time) | Marked lightcurve |
|---|---|---|---|---|---|---|---|
| A | 7816 | 6537 | 0 | 0 | 0.00% | 0.00% | 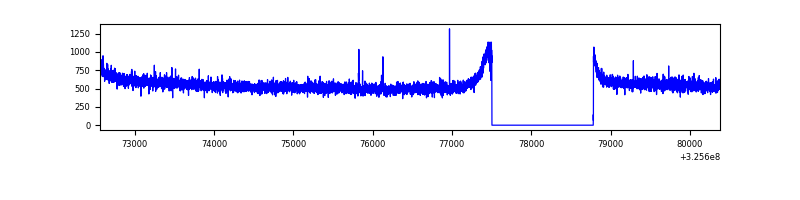 |
| B | 7816 | 6537 | 67 | 67 | 0.86% | 1.02% | 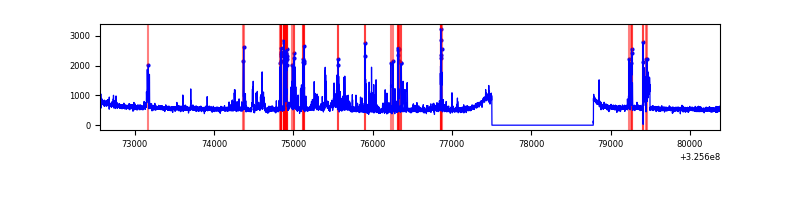 |
| C | 7816 | 6537 | 0 | 0 | 0.00% | 0.00% | 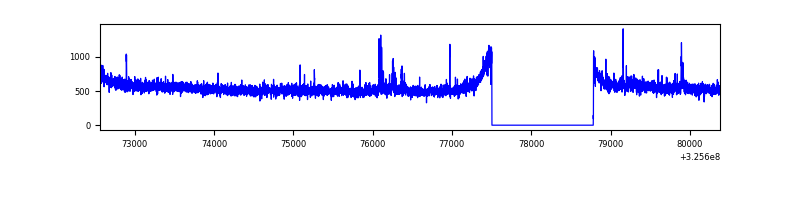 |
| D | 7816 | 6537 | 19 | 19 | 0.24% | 0.29% | 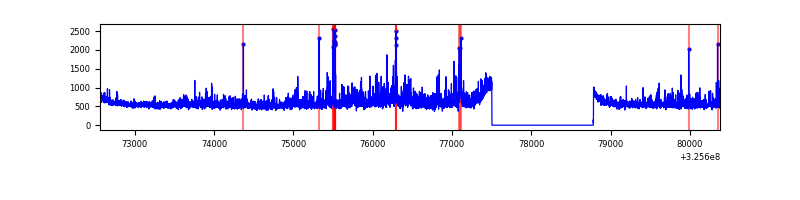 |
Top three noisy pixels from each quadrant. If the there are fewer than three noisy pixels in the level2.evt file, extra rows are filled as -1
| Pixel properties | Quadrant properties | ||||||
|---|---|---|---|---|---|---|---|
| Quadrant | DetID | PixID | Counts | Sigma | Mean | Median | Sigma |
| A | 13 | 254 | 8941 | 43.66 | 935 | 921 | 183.7 |
| A | 0 | 226 | 8004 | 38.56 | 935 | 921 | 183.7 |
| A | 3 | 137 | 7876 | 37.86 | 935 | 921 | 183.7 |
| B | 3 | 64 | 576791 | 3364.45 | 913 | 896 | 171.2 |
| B | 0 | 230 | 27324 | 154.4 | 913 | 896 | 171.2 |
| B | 12 | 111 | 20679 | 115.57 | 913 | 896 | 171.2 |
| C | 14 | 238 | 141691 | 700.47 | 872 | 880 | 201.0 |
| C | 7 | 247 | 71421 | 350.91 | 872 | 880 | 201.0 |
| C | 13 | 61 | 6090 | 25.92 | 872 | 880 | 201.0 |
| D | 8 | 195 | 503750 | 2377.12 | 887 | 866 | 211.6 |
| D | 12 | 233 | 113268 | 531.32 | 887 | 866 | 211.6 |
| D | 1 | 52 | 38653 | 178.62 | 887 | 866 | 211.6 |
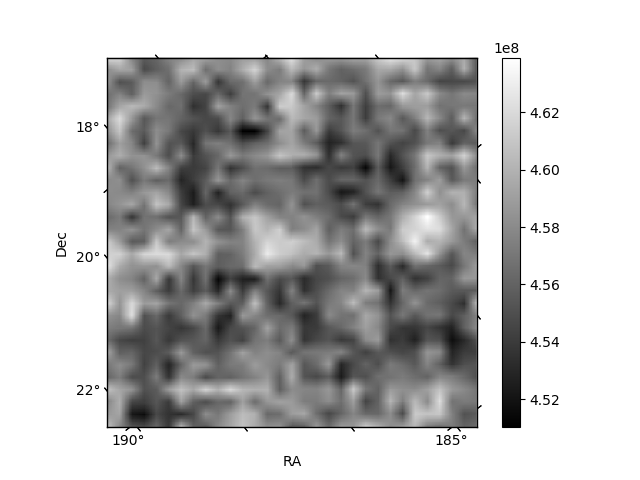
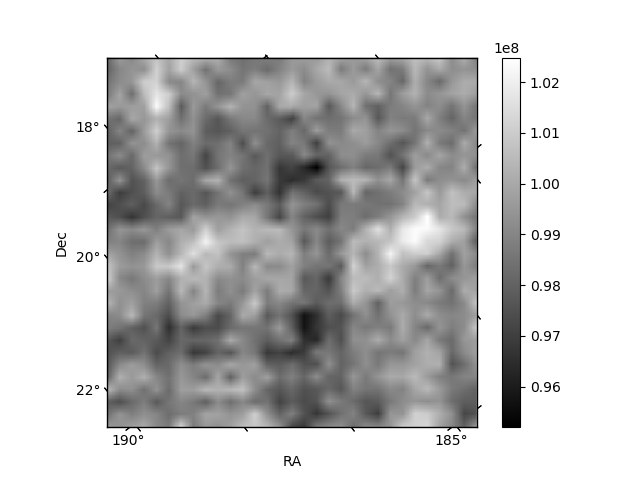
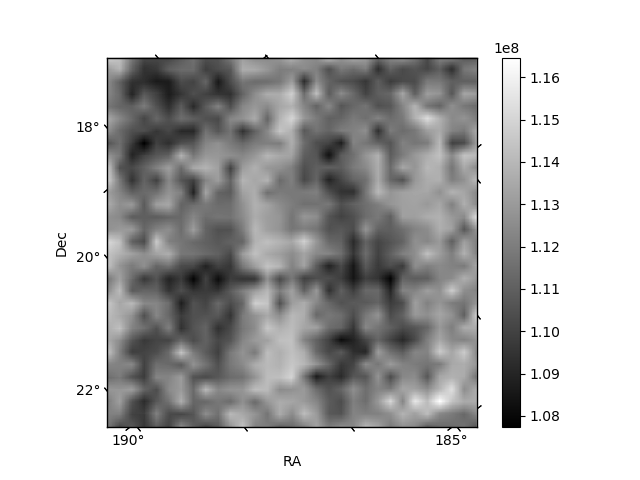
Histogram calculated using DETX and DETY for each event in the final _common_clean file
| Quadrant A | 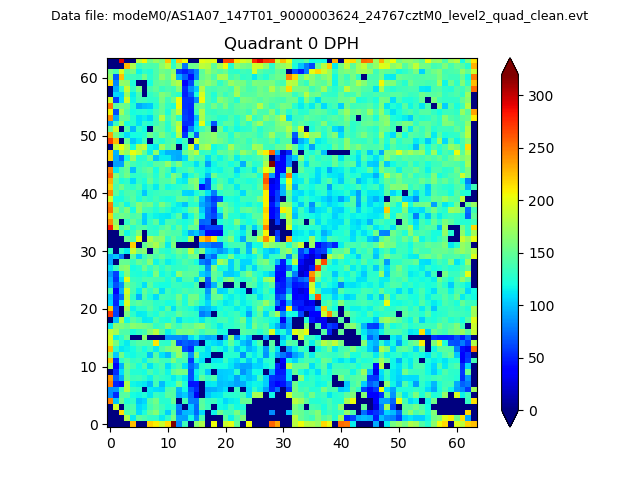 |
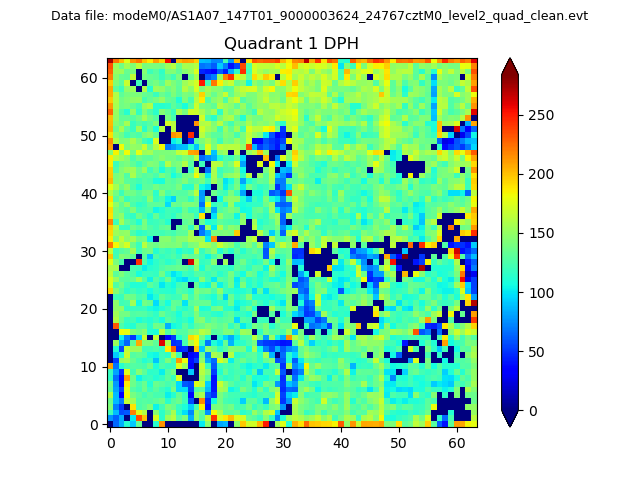 |
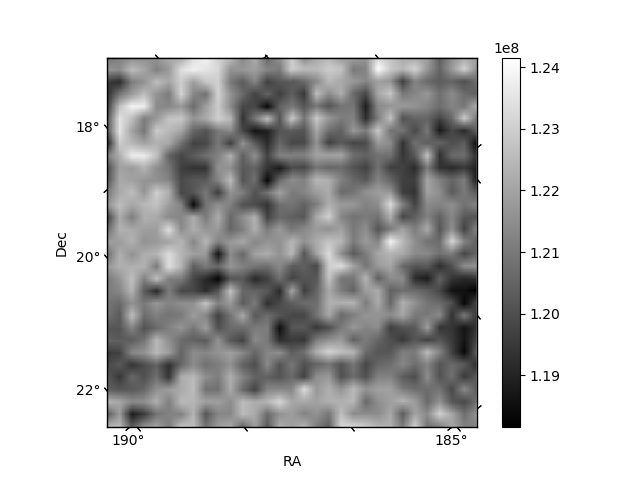
Quadrant B |
|---|---|---|---|
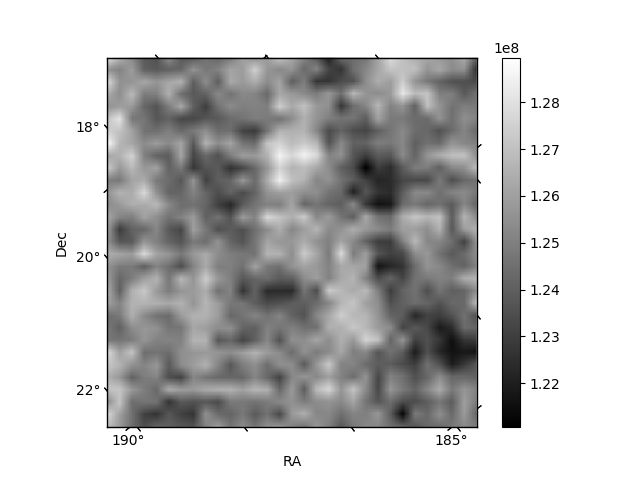
| Quadrant D |  |
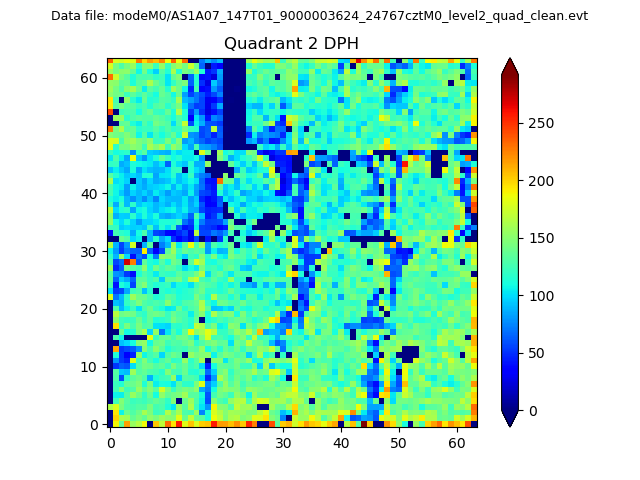 |
Quadrant C |
| Plot type | Count rate plots | Images |
|---|---|---|
| Comparison with Poisson distribution Blue bars denote a histogram of data divided into 1 sec bins. Red curve is a Poisson curve with rate = median count rate of data. |
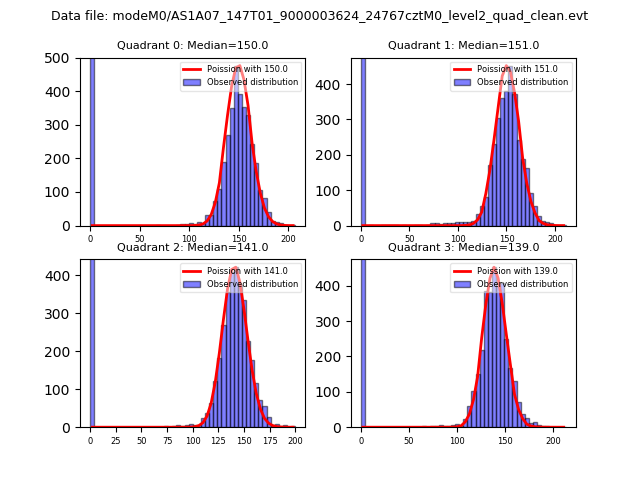 |
 |
| Quadrant-wise count rates Data is divided into 100 sec bins |
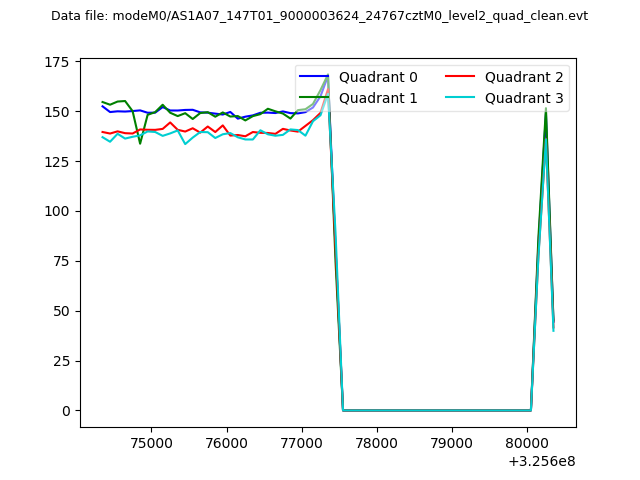 |
|
| Module-wise count rates for Quadrant A Data is divided into 100 sec bins |
 |
 |
| Module-wise count rates for Quadrant B Data is divided into 100 sec bins |
 |
 |
| Module-wise count rates for Quadrant C Data is divided into 100 sec bins |
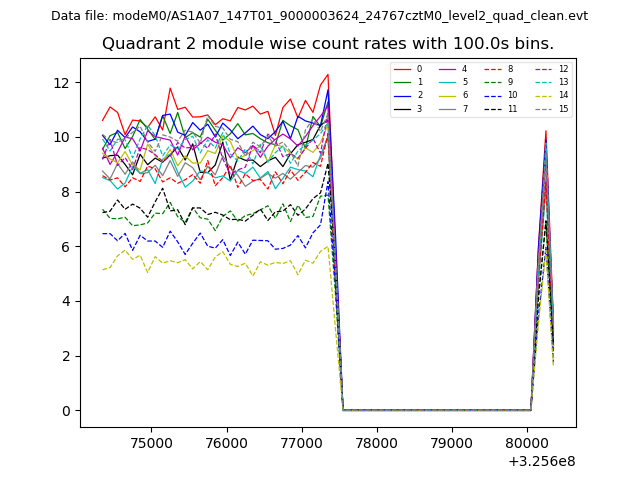 |
 |
| Module-wise count rates for Quadrant D Data is divided into 100 sec bins |
 |
 |
| Parameter | Plot |
|---|---|
| CZT HV Monitor | 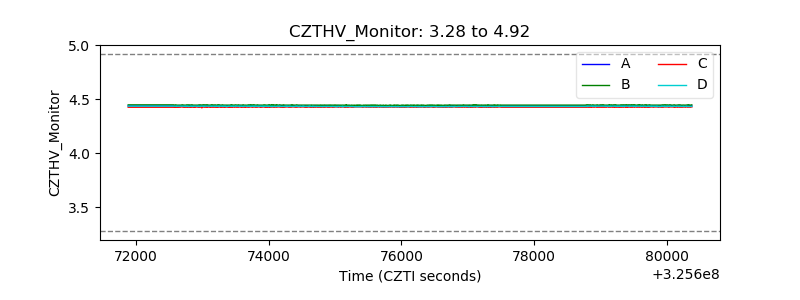 |
| D_VDD | 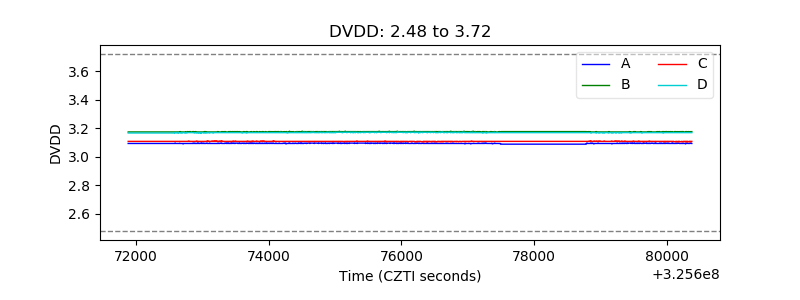 |
| Temperature 1 | 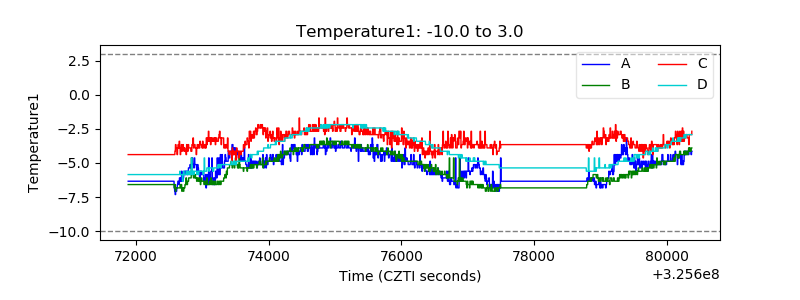 |
| Veto HV Monitor | 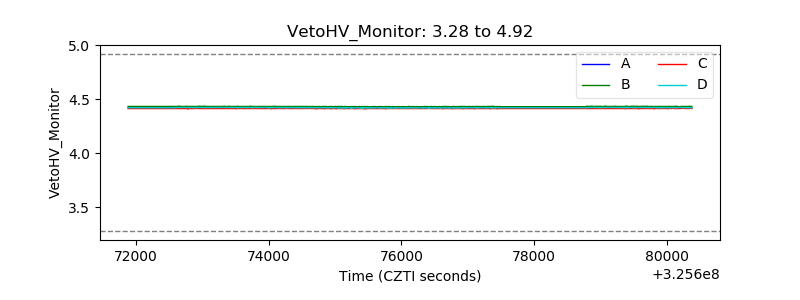 |
| Veto LLD | 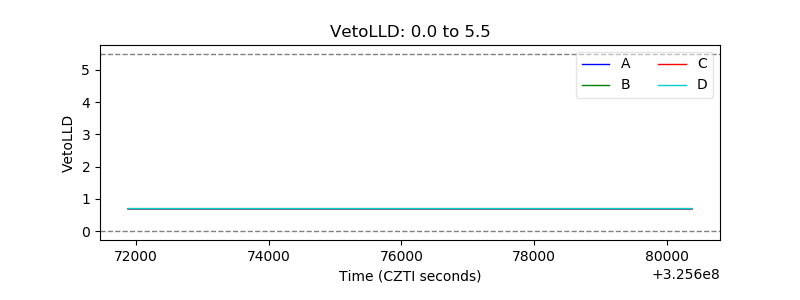 |
| Alpha Counter | 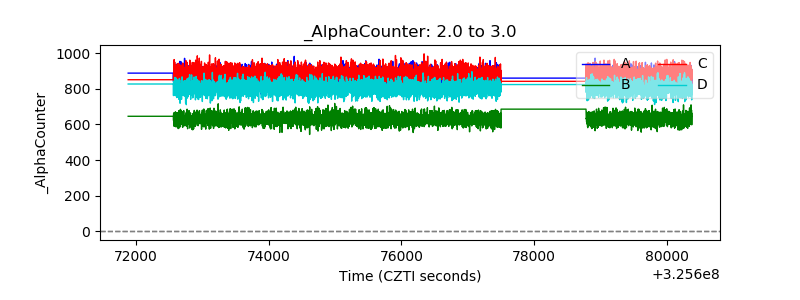 |
| _CPM_Rate | 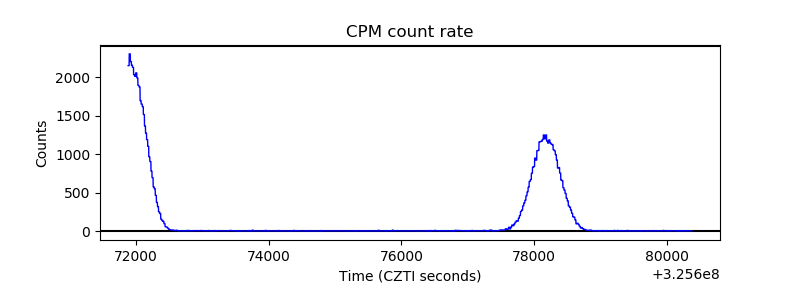 |
| CZT Counter | 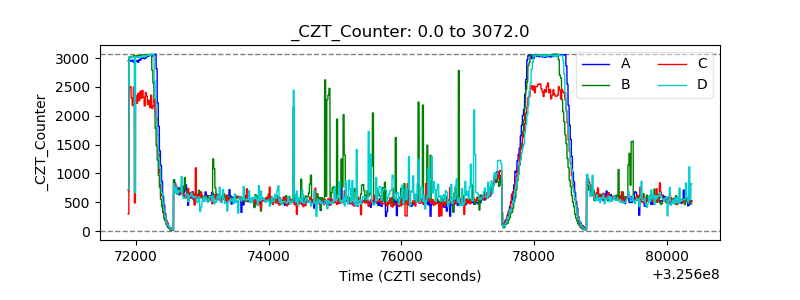 |
| +2.5 Volts monitor | 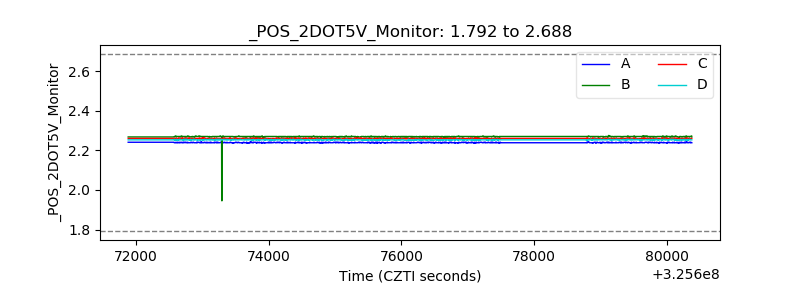 |
| +5 Volts monitor |  |
| _ROLL_ROT |  |
| _Roll_DEC | 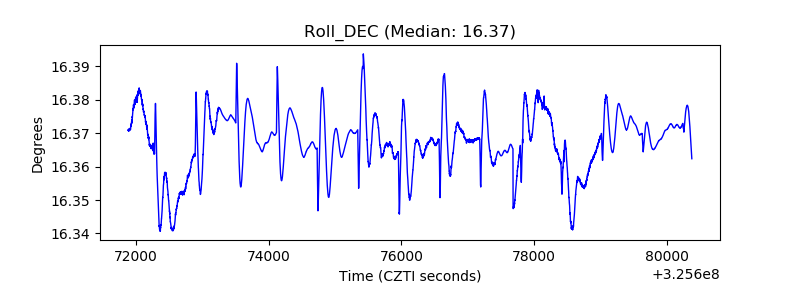 |
| _Roll_RA | 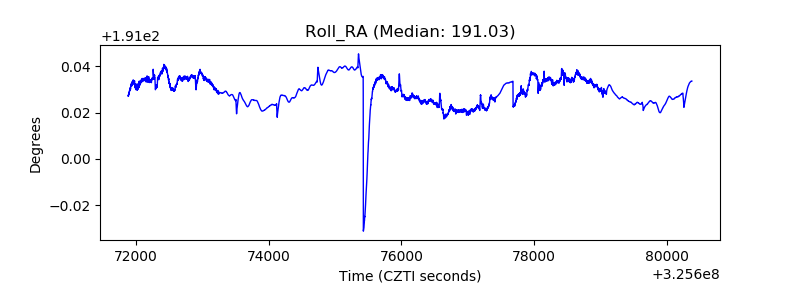 |
| Veto Counter |  |