| Param | Original file | Final file |
|---|---|---|
| Filename | modeM0/AS1A07_147T01_9000003624_24768cztM0_level2.evt | modeM0/AS1A07_147T01_9000003624_24768cztM0_level2_quad_clean.evt |
| Size (bytes) | 538,179,840 | 91,825,920 |
| Size | 513.2 MB | 87.6 MB |
| Events in quadrant A | 3,577,097 | 604,326 |
| Events in quadrant B | 4,001,025 | 607,277 |
| Events in quadrant C | 3,598,312 | 569,004 |
| Events in quadrant D | 4,667,458 | 532,628 |
| Mode M0 | |||
|---|---|---|---|
| Quadrant | BADHDUFLAG | Total packets | Discarded packets |
| A | 0 | 14469 | 2 |
| B | 0 | 15877 | 2 |
| C | 0 | 14542 | 2 |
| D | 0 | 17874 | 2 |
| Mode SS | |||
|---|---|---|---|
| Quadrant | BADHDUFLAG | Total packets | Discarded packets |
| A | 0 | 136 | 0 |
| B | 0 | 136 | 0 |
| C | 0 | 136 | 0 |
| D | 0 | 136 | 0 |
| Mode M9 | |||
|---|---|---|---|
| Quadrant | BADHDUFLAG | Total packets | Discarded packets |
| A | 0 | 11 | 0 |
| B | 0 | 11 | 0 |
| C | 0 | 11 | 0 |
| D | 0 | 11 | 0 |
| Quadrant | Total seconds | Saturated seconds | Saturation percentage |
|---|---|---|---|
| A | 6705 | 99 | 1.476510% |
| B | 6706 | 165 | 2.460483% |
| C | 6706 | 136 | 2.028035% |
| D | 6706 | 488 | 7.277065% |
Noise dominated data is calculated using 1-second bins in cleaned event files. If a bin has >2000 counts, and if more than 50% of those come from <1% of pixels, then it is considered to be noise-dominated and hence unusable.
| Quadrant | # 1 sec bins | Bins with >0 counts | Bins with >2000 counts | High rate bins dominated by noise | Noise dominated (total time) | Noise dominated (detector-on time) | Marked lightcurve |
|---|---|---|---|---|---|---|---|
| A | 7815 | 6706 | 0 | 0 | 0.00% | 0.00% | 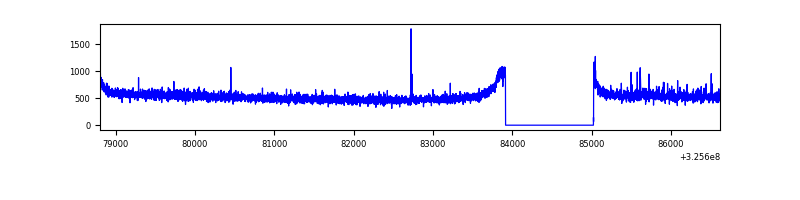 |
| B | 7816 | 6707 | 17 | 17 | 0.22% | 0.25% | 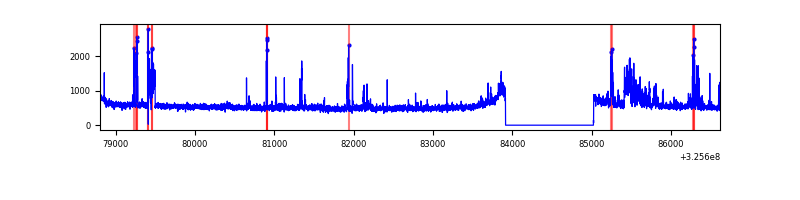 |
| C | 7816 | 6707 | 0 | 0 | 0.00% | 0.00% | 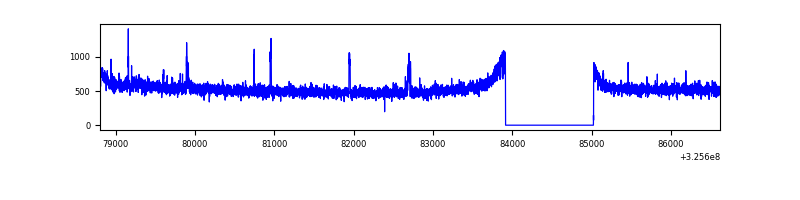 |
| D | 7816 | 6707 | 453 | 453 | 5.80% | 6.75% | 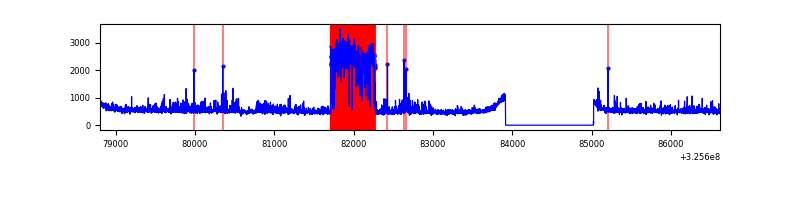 |
Top three noisy pixels from each quadrant. If the there are fewer than three noisy pixels in the level2.evt file, extra rows are filled as -1
| Pixel properties | Quadrant properties | ||||||
|---|---|---|---|---|---|---|---|
| Quadrant | DetID | PixID | Counts | Sigma | Mean | Median | Sigma |
| A | 4 | 2 | 29948 | 158.81 | 918 | 902 | 182.9 |
| A | 12 | 96 | 10812 | 54.18 | 918 | 902 | 182.9 |
| A | 13 | 254 | 9115 | 44.91 | 918 | 902 | 182.9 |
| B | 3 | 64 | 435874 | 2529.41 | 899 | 878 | 172.0 |
| B | 10 | 246 | 21449 | 119.62 | 899 | 878 | 172.0 |
| B | 12 | 111 | 20864 | 116.21 | 899 | 878 | 172.0 |
| C | 14 | 238 | 138864 | 689.93 | 863 | 872 | 200.0 |
| C | 7 | 247 | 67561 | 333.43 | 863 | 872 | 200.0 |
| C | 3 | 233 | 16868 | 79.98 | 863 | 872 | 200.0 |
| D | 12 | 233 | 1136448 | 5480.33 | 858 | 835 | 207.2 |
| D | 8 | 195 | 225370 | 1083.58 | 858 | 835 | 207.2 |
| D | 1 | 52 | 70579 | 336.58 | 858 | 835 | 207.2 |
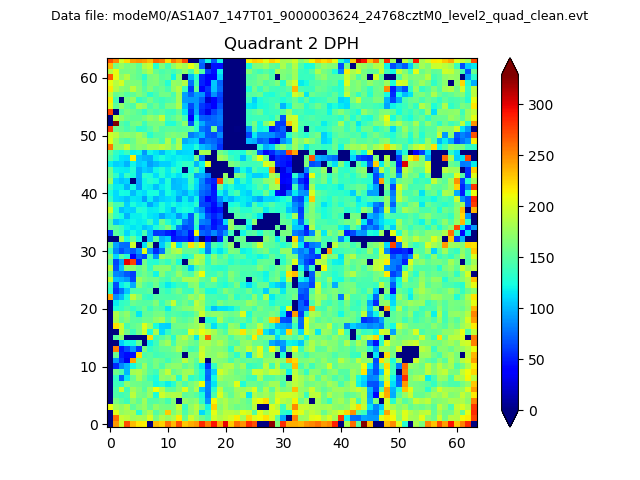
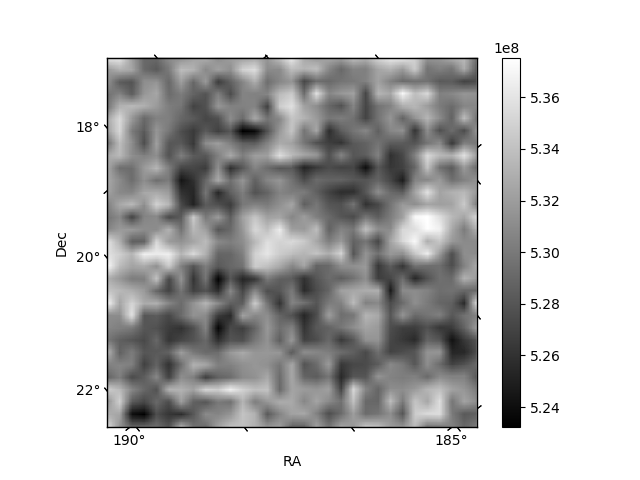
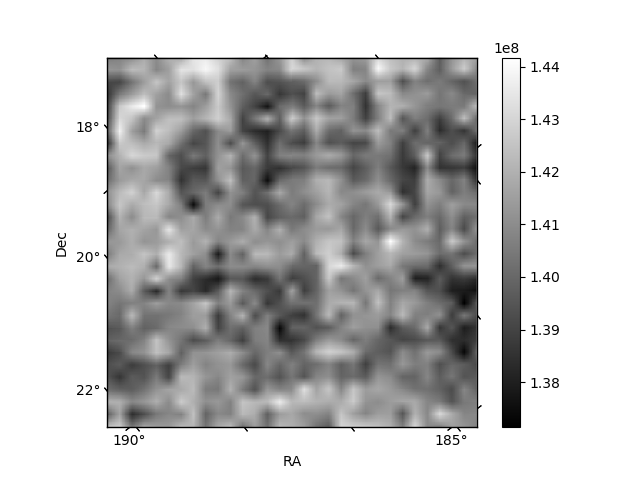
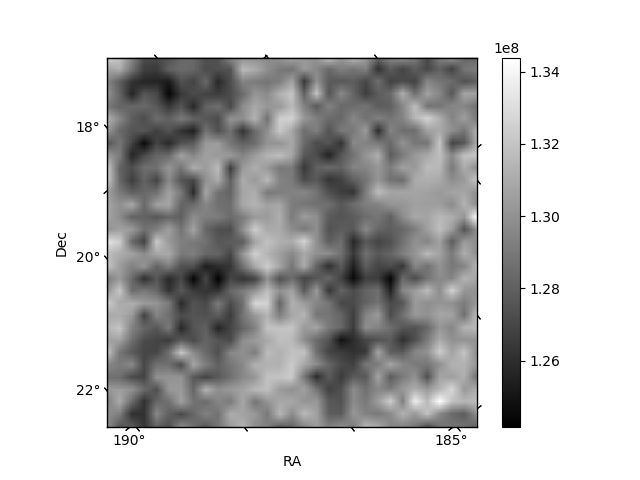
Histogram calculated using DETX and DETY for each event in the final _common_clean file
| Quadrant A | 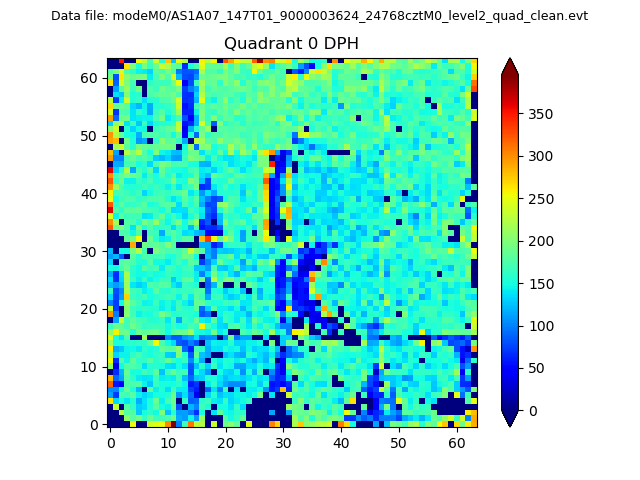 |
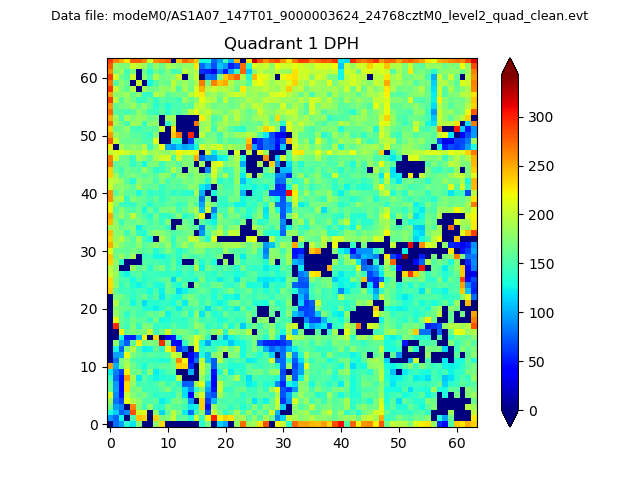 |
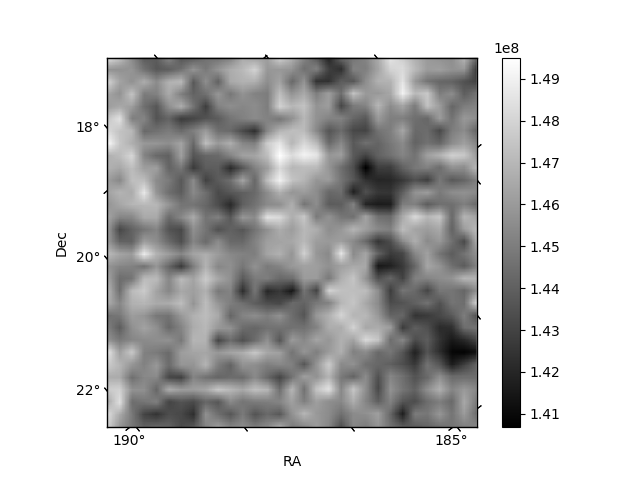
Quadrant B |
|---|---|---|---|
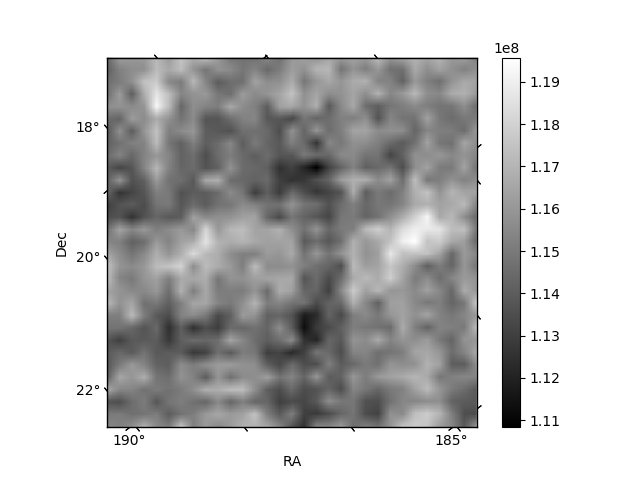
| Quadrant D | 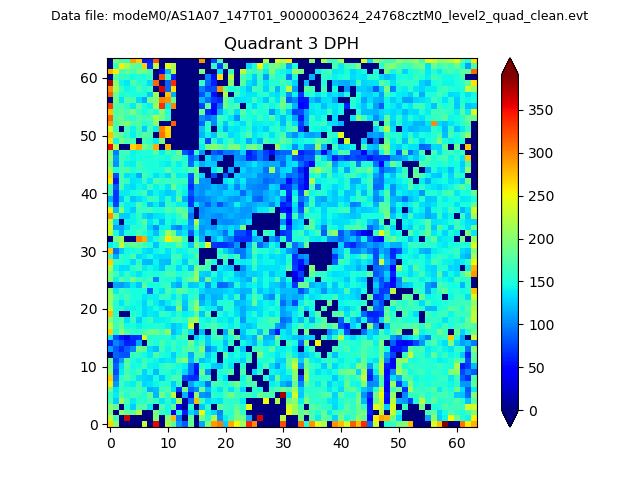 |
 |
Quadrant C |
| Plot type | Count rate plots | Images |
|---|---|---|
| Comparison with Poisson distribution Blue bars denote a histogram of data divided into 1 sec bins. Red curve is a Poisson curve with rate = median count rate of data. |
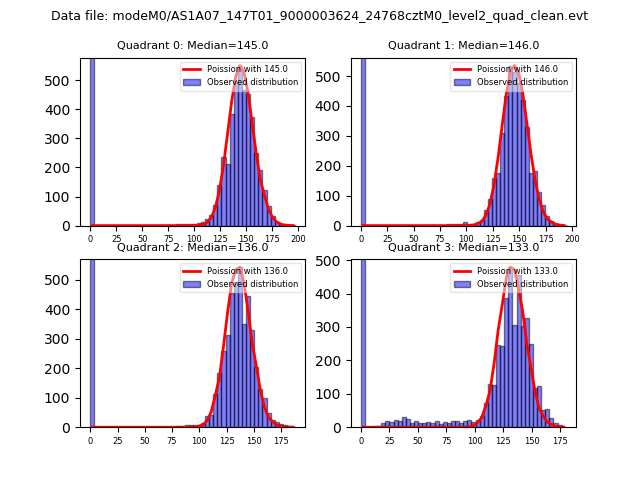 |
 |
| Quadrant-wise count rates Data is divided into 100 sec bins |
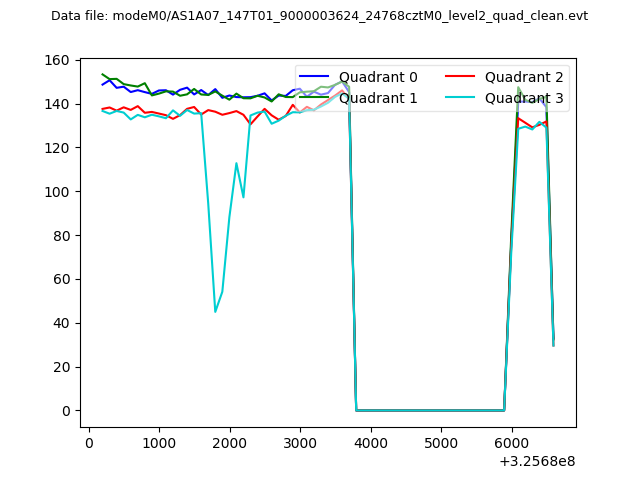 |
|
| Module-wise count rates for Quadrant A Data is divided into 100 sec bins |
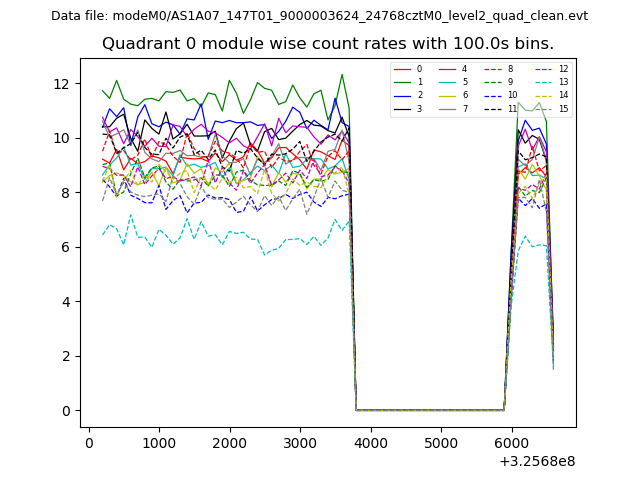 |
 |
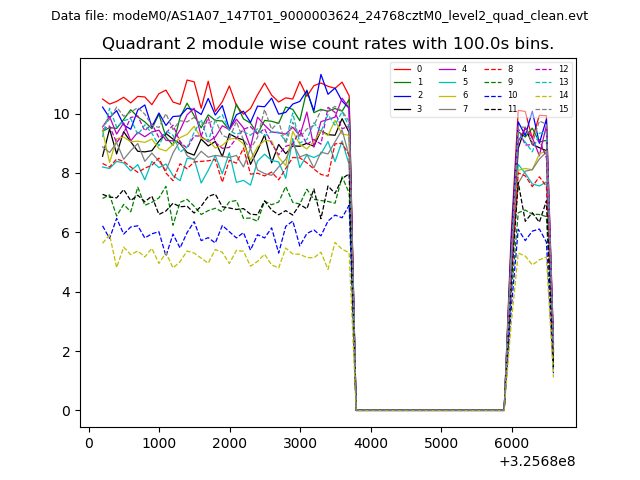
| Module-wise count rates for Quadrant B Data is divided into 100 sec bins |
 |
 |
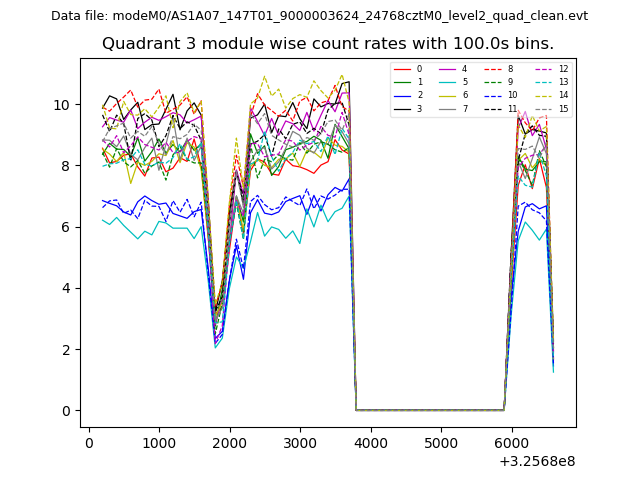
| Module-wise count rates for Quadrant C Data is divided into 100 sec bins |
 |
 |
| Module-wise count rates for Quadrant D Data is divided into 100 sec bins |
 |
 |
| Parameter | Plot |
|---|---|
| CZT HV Monitor | 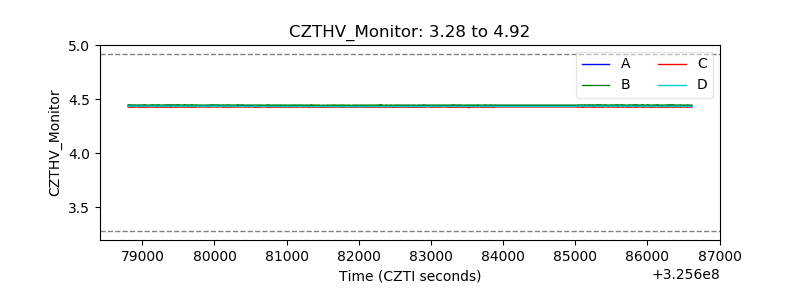 |
| D_VDD | 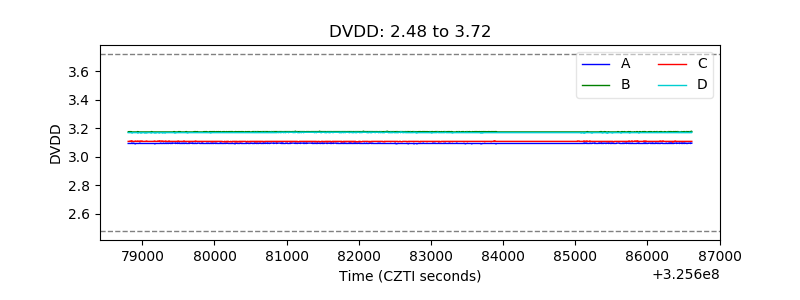 |
| Temperature 1 | 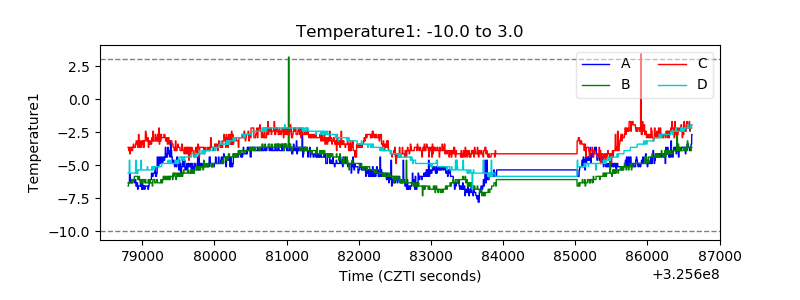 |
| Veto HV Monitor | 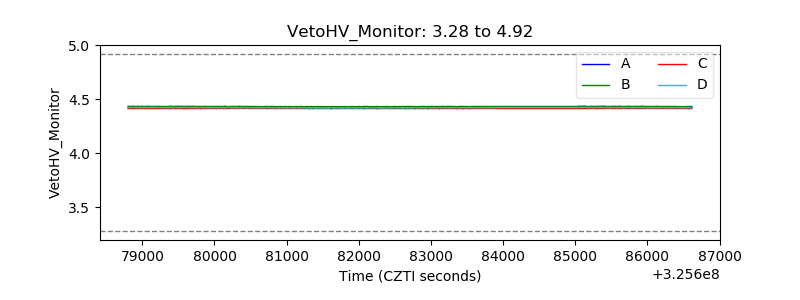 |
| Veto LLD | 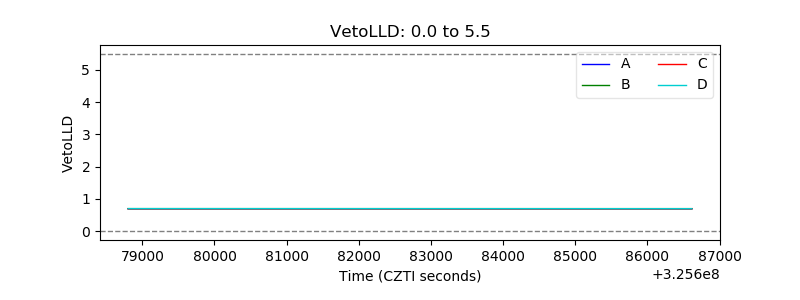 |
| Alpha Counter | 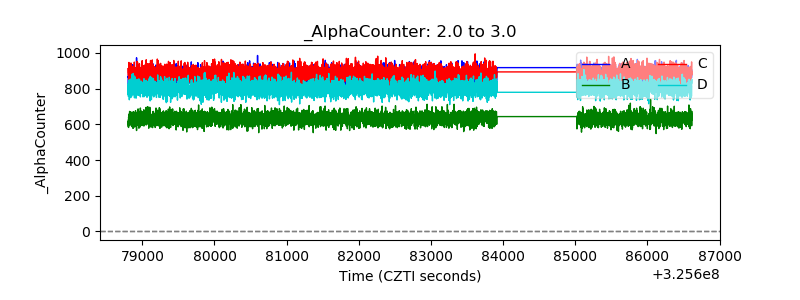 |
| _CPM_Rate | 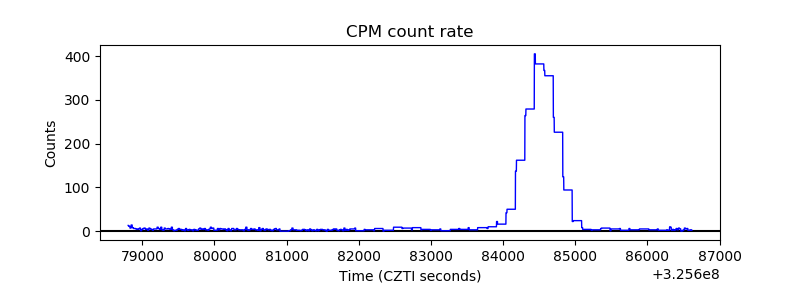 |
| CZT Counter | 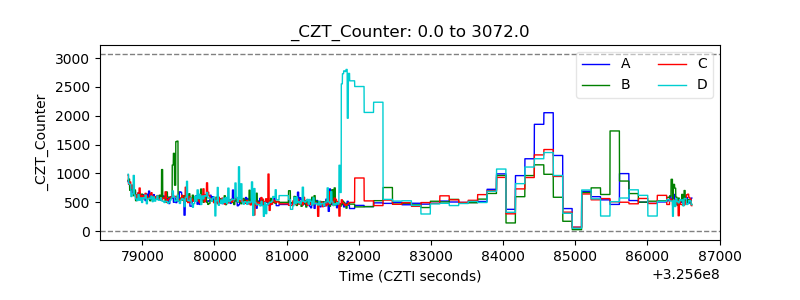 |
| +2.5 Volts monitor |  |
| +5 Volts monitor |  |
| _ROLL_ROT |  |
| _Roll_DEC | 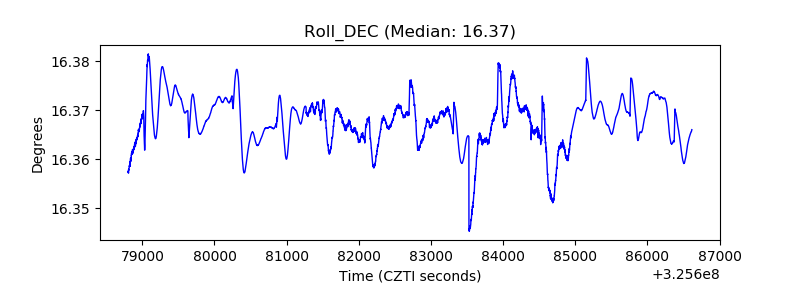 |
| _Roll_RA | 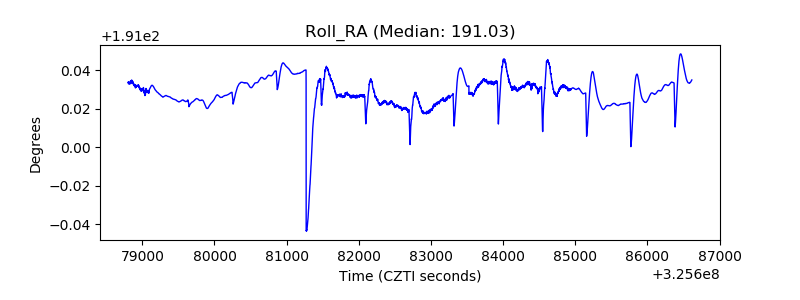 |
| Veto Counter | 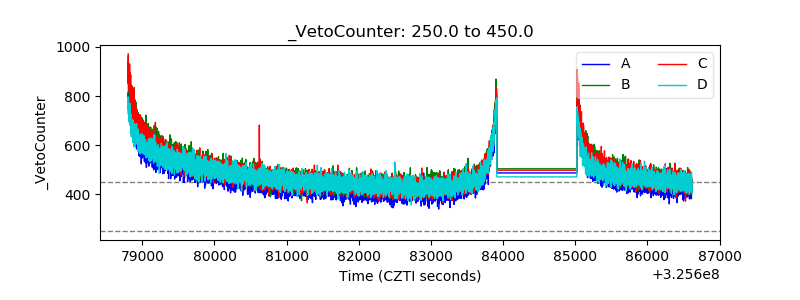 |