| Param | Original file | Final file |
|---|---|---|
| Filename | modeM0/AS1A07_147T01_9000003624_24769cztM0_level2.evt | modeM0/AS1A07_147T01_9000003624_24769cztM0_level2_quad_clean.evt |
| Size (bytes) | 562,403,520 | 94,446,720 |
| Size | 536.3 MB | 90.1 MB |
| Events in quadrant A | 3,561,315 | 612,659 |
| Events in quadrant B | 4,194,774 | 612,335 |
| Events in quadrant C | 5,171,768 | 570,641 |
| Events in quadrant D | 3,629,045 | 576,147 |
| Mode M0 | |||
|---|---|---|---|
| Quadrant | BADHDUFLAG | Total packets | Discarded packets |
| A | 0 | 14728 | 2 |
| B | 0 | 16849 | 2 |
| C | 0 | 19668 | 2 |
| D | 0 | 15043 | 2 |
| Mode SS | |||
|---|---|---|---|
| Quadrant | BADHDUFLAG | Total packets | Discarded packets |
| A | 0 | 146 | 0 |
| B | 0 | 146 | 0 |
| C | 0 | 146 | 0 |
| D | 0 | 146 | 0 |
| Mode M9 | |||
|---|---|---|---|
| Quadrant | BADHDUFLAG | Total packets | Discarded packets |
| A | 0 | 17 | 0 |
| B | 0 | 18 | 0 |
| C | 0 | 18 | 0 |
| D | 0 | 18 | 0 |
| Quadrant | Total seconds | Saturated seconds | Saturation percentage |
|---|---|---|---|
| A | 7005 | 143 | 2.041399% |
| B | 7005 | 207 | 2.955032% |
| C | 7005 | 755 | 10.778016% |
| D | 7005 | 99 | 1.413276% |
Noise dominated data is calculated using 1-second bins in cleaned event files. If a bin has >2000 counts, and if more than 50% of those come from <1% of pixels, then it is considered to be noise-dominated and hence unusable.
| Quadrant | # 1 sec bins | Bins with >0 counts | Bins with >2000 counts | High rate bins dominated by noise | Noise dominated (total time) | Noise dominated (detector-on time) | Marked lightcurve |
|---|---|---|---|---|---|---|---|
| A | 7760 | 7006 | 0 | 0 | 0.00% | 0.00% | 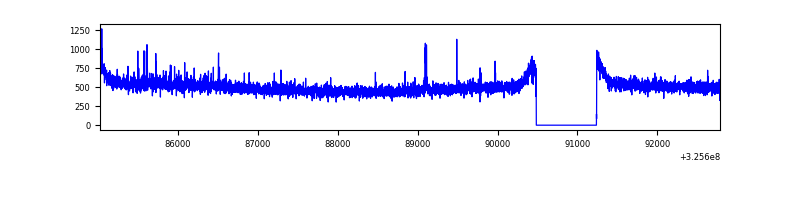 |
| B | 7760 | 7006 | 17 | 17 | 0.22% | 0.24% | 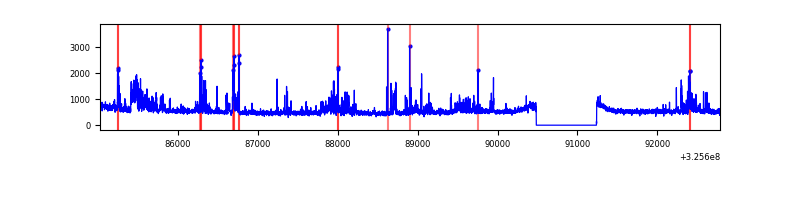 |
| C | 7760 | 7006 | 161 | 161 | 2.07% | 2.30% | 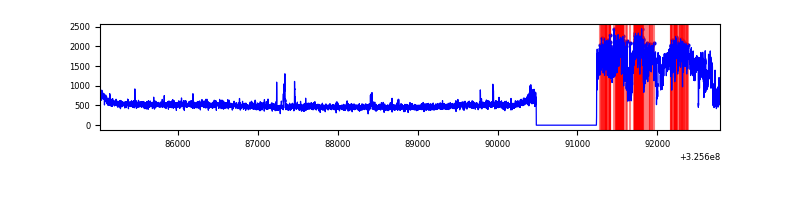 |
| D | 7760 | 7006 | 4 | 4 | 0.05% | 0.06% | 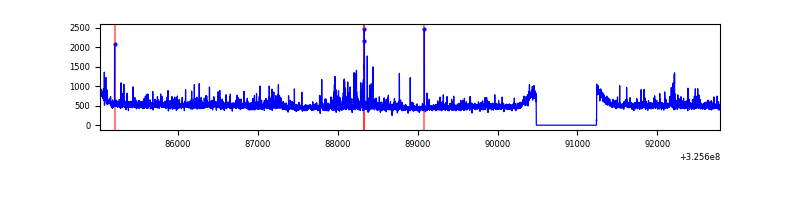 |
Top three noisy pixels from each quadrant. If the there are fewer than three noisy pixels in the level2.evt file, extra rows are filled as -1
| Pixel properties | Quadrant properties | ||||||
|---|---|---|---|---|---|---|---|
| Quadrant | DetID | PixID | Counts | Sigma | Mean | Median | Sigma |
| A | 4 | 2 | 29921 | 157.97 | 913 | 894 | 183.7 |
| A | 12 | 96 | 14928 | 76.38 | 913 | 894 | 183.7 |
| A | 13 | 254 | 8756 | 42.79 | 913 | 894 | 183.7 |
| B | 3 | 64 | 528737 | 3046.55 | 895 | 874 | 173.3 |
| B | 10 | 246 | 106750 | 611.06 | 895 | 874 | 173.3 |
| B | 0 | 230 | 27383 | 153.0 | 895 | 874 | 173.3 |
| C | 7 | 247 | 1723626 | 8754.84 | 845 | 851 | 196.8 |
| C | 14 | 238 | 133317 | 673.17 | 845 | 851 | 196.8 |
| C | 10 | 91 | 13464 | 64.1 | 845 | 851 | 196.8 |
| D | 8 | 195 | 158348 | 732.76 | 882 | 858 | 214.9 |
| D | 12 | 233 | 71818 | 330.16 | 882 | 858 | 214.9 |
| D | 1 | 52 | 66430 | 305.09 | 882 | 858 | 214.9 |
Histogram calculated using DETX and DETY for each event in the final _common_clean file
| Quadrant A |  |
 |
Quadrant B |
|---|---|---|---|
| Quadrant D | 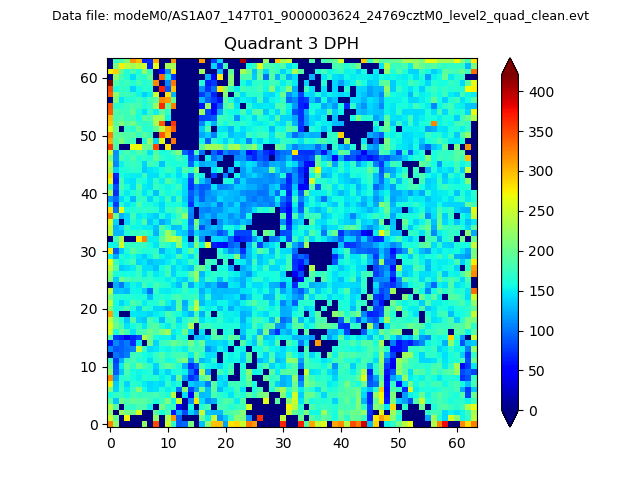 |
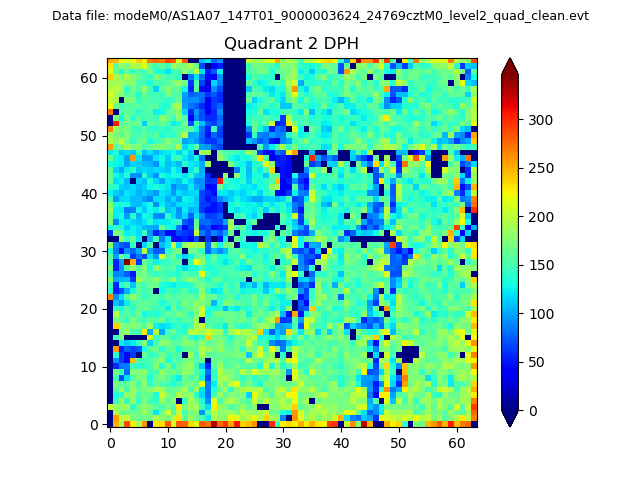 |
Quadrant C |
| Plot type | Count rate plots | Images |
|---|---|---|
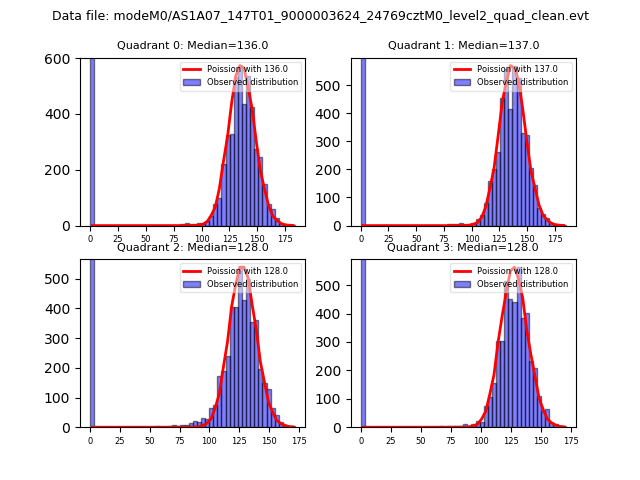
| Comparison with Poisson distribution Blue bars denote a histogram of data divided into 1 sec bins. Red curve is a Poisson curve with rate = median count rate of data. |
 |
 |
| Quadrant-wise count rates Data is divided into 100 sec bins |
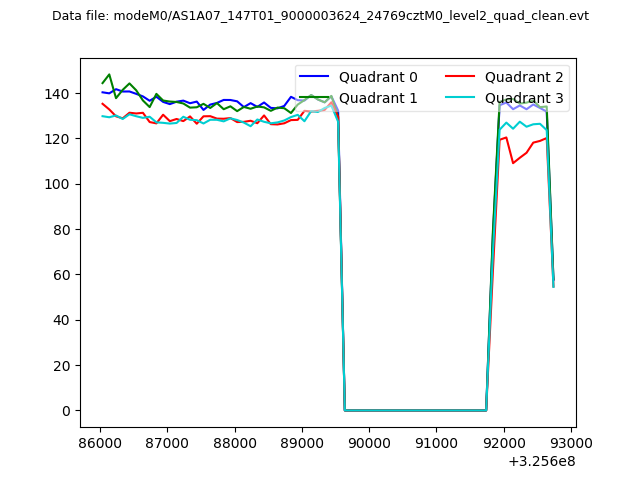 |
|
| Module-wise count rates for Quadrant A Data is divided into 100 sec bins |
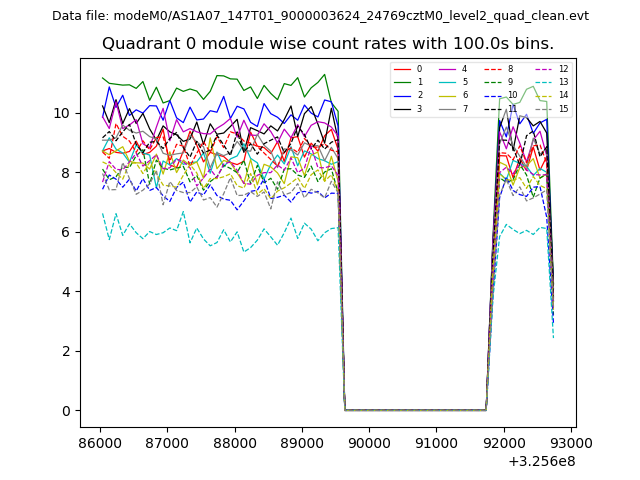 |
 |
| Module-wise count rates for Quadrant B Data is divided into 100 sec bins |
 |
 |
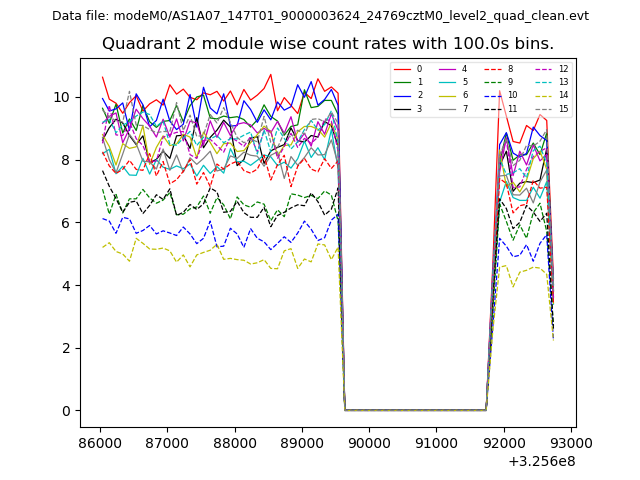
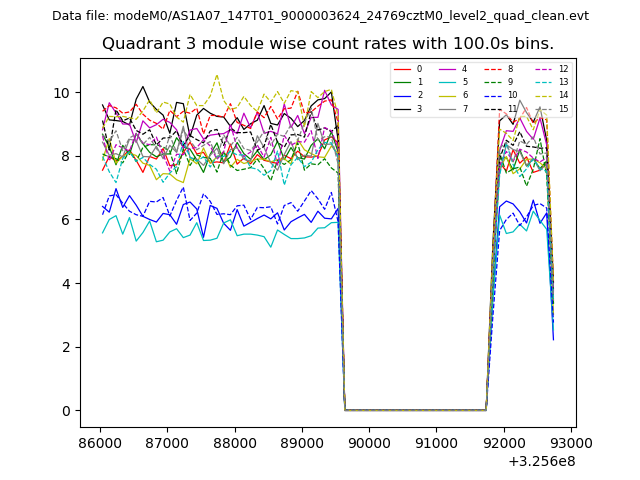
| Module-wise count rates for Quadrant C Data is divided into 100 sec bins |
 |
 |
| Module-wise count rates for Quadrant D Data is divided into 100 sec bins |
 |
 |
| Parameter | Plot |
|---|---|
| CZT HV Monitor | 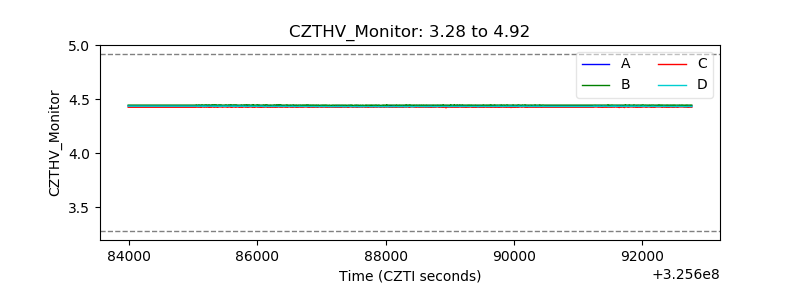 |
| D_VDD | 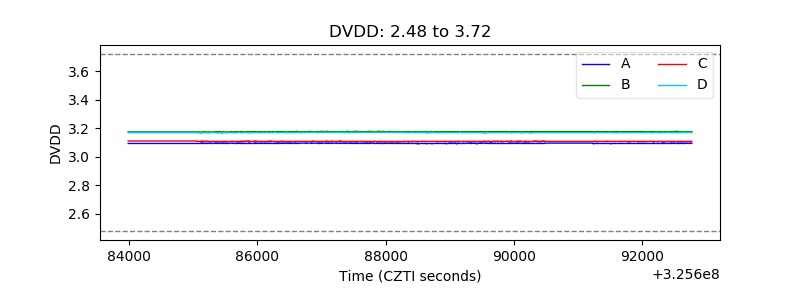 |
| Temperature 1 | 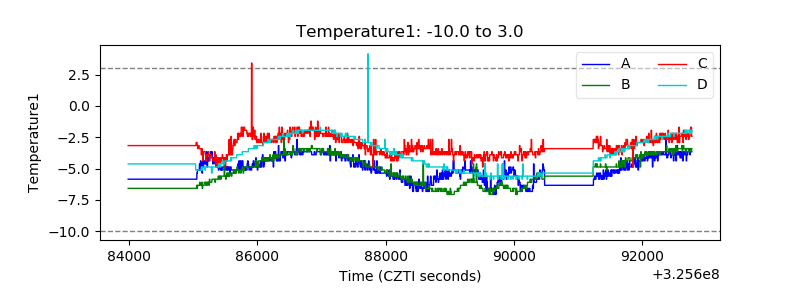 |
| Veto HV Monitor | 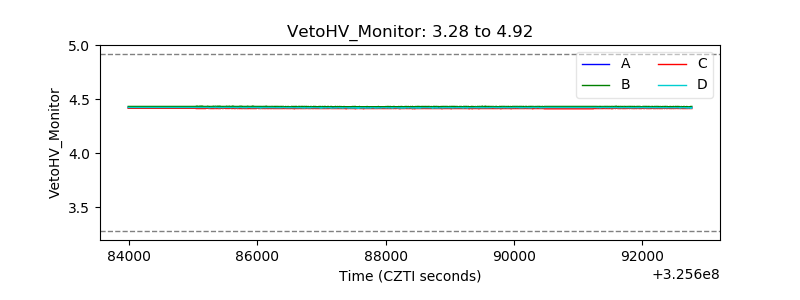 |
| Veto LLD | 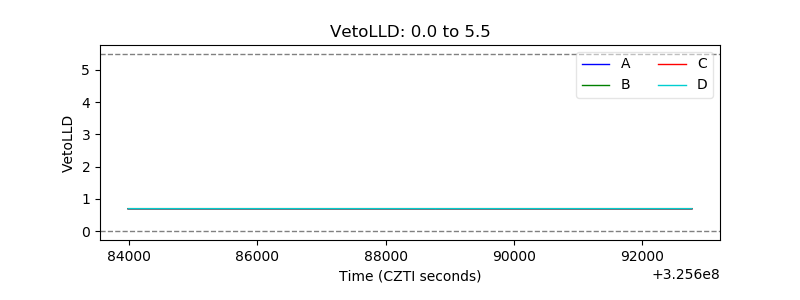 |
| Alpha Counter | 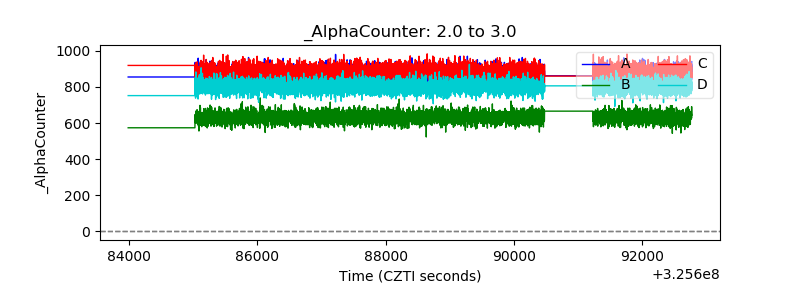 |
| _CPM_Rate | 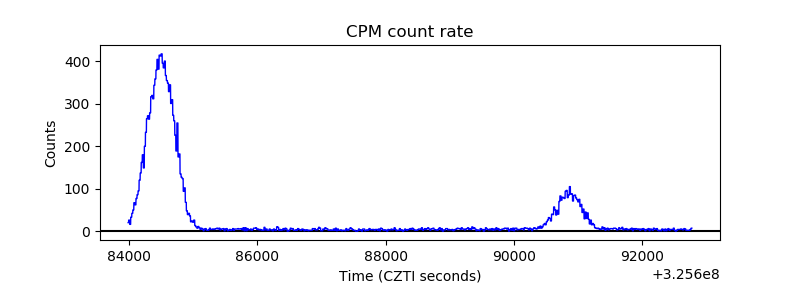 |
| CZT Counter | 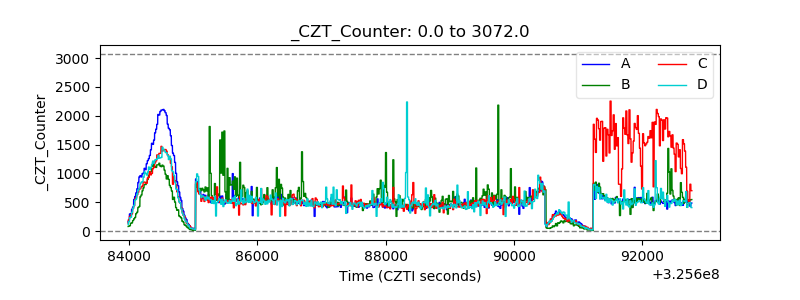 |
| +2.5 Volts monitor |  |
| +5 Volts monitor | 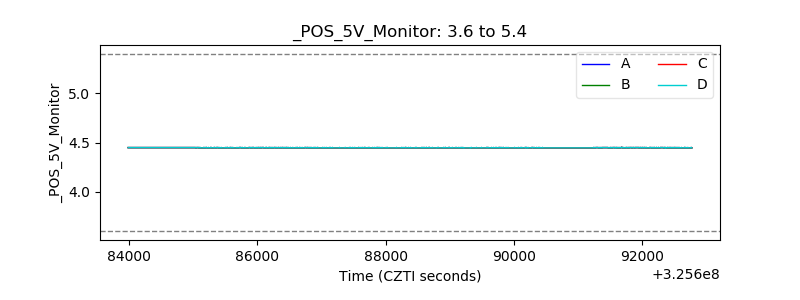 |
| _ROLL_ROT | 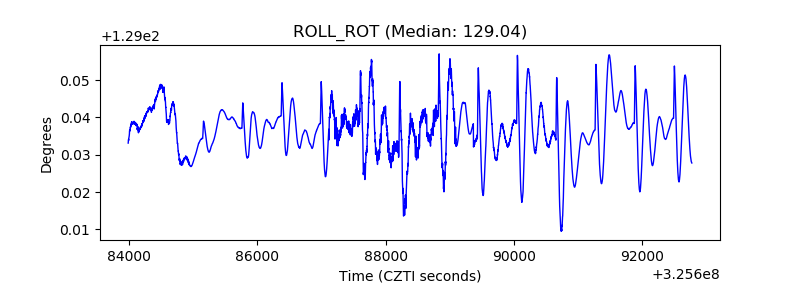 |
| _Roll_DEC | 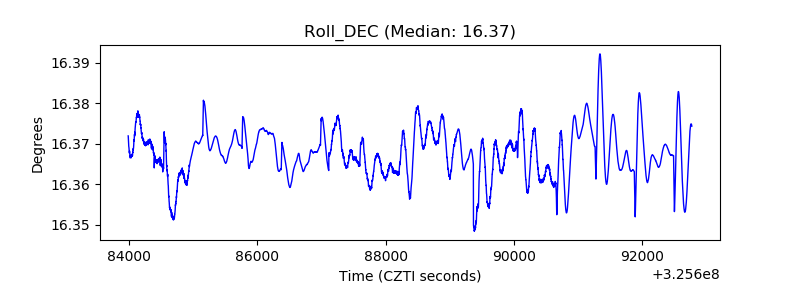 |
| _Roll_RA | 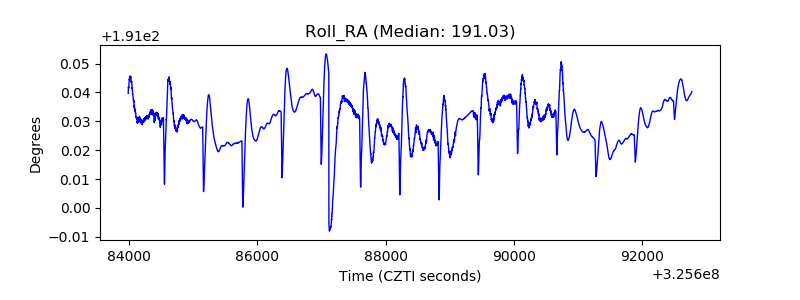 |
| Veto Counter | 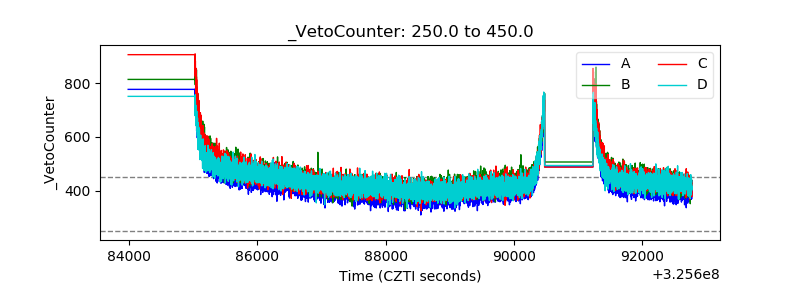 |