| Param | Original file | Final file |
|---|---|---|
| Filename | modeM0/AS1A07_147T01_9000003624_24770cztM0_level2.evt | modeM0/AS1A07_147T01_9000003624_24770cztM0_level2_quad_clean.evt |
| Size (bytes) | 927,771,840 | 173,136,960 |
| Size | 884.8 MB | 165.1 MB |
| Events in quadrant A | 5,835,537 | 1,140,756 |
| Events in quadrant B | 6,433,151 | 1,142,075 |
| Events in quadrant C | 8,937,659 | 1,061,823 |
| Events in quadrant D | 6,086,041 | 1,075,708 |
| Mode M0 | |||
|---|---|---|---|
| Quadrant | BADHDUFLAG | Total packets | Discarded packets |
| A | 0 | 24672 | 2 |
| B | 0 | 26383 | 4 |
| C | 0 | 33950 | 2 |
| D | 0 | 25627 | 2 |
| Mode SS | |||
|---|---|---|---|
| Quadrant | BADHDUFLAG | Total packets | Discarded packets |
| A | 0 | 244 | 0 |
| B | 0 | 244 | 0 |
| C | 0 | 244 | 0 |
| D | 0 | 244 | 0 |
| Mode M9 | |||
|---|---|---|---|
| Quadrant | BADHDUFLAG | Total packets | Discarded packets |
| A | 0 | 11 | 0 |
| B | 0 | 11 | 0 |
| C | 0 | 11 | 0 |
| D | 0 | 11 | 0 |
| Quadrant | Total seconds | Saturated seconds | Saturation percentage |
|---|---|---|---|
| A | 11902 | 206 | 1.730802% |
| B | 11901 | 273 | 2.293925% |
| C | 11902 | 926 | 7.780205% |
| D | 11903 | 149 | 1.251785% |
Noise dominated data is calculated using 1-second bins in cleaned event files. If a bin has >2000 counts, and if more than 50% of those come from <1% of pixels, then it is considered to be noise-dominated and hence unusable.
| Quadrant | # 1 sec bins | Bins with >0 counts | Bins with >2000 counts | High rate bins dominated by noise | Noise dominated (total time) | Noise dominated (detector-on time) | Marked lightcurve |
|---|---|---|---|---|---|---|---|
| A | 13052 | 11904 | 1 | 1 | 0.01% | 0.01% | 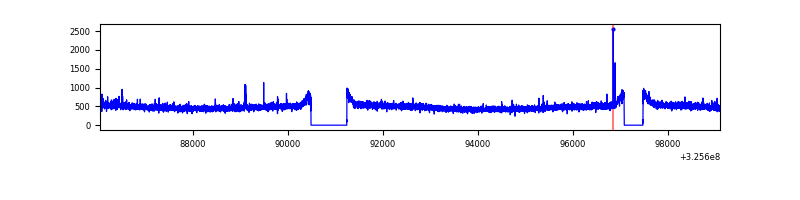 |
| B | 13052 | 11904 | 16 | 16 | 0.12% | 0.13% | 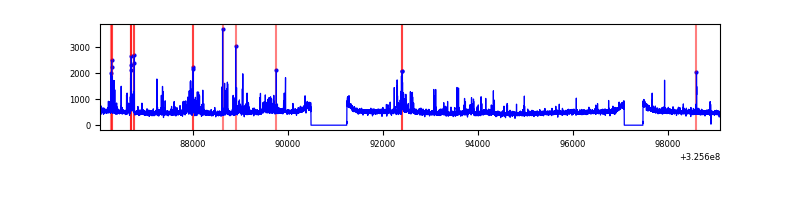 |
| C | 13052 | 11904 | 178 | 178 | 1.36% | 1.50% | 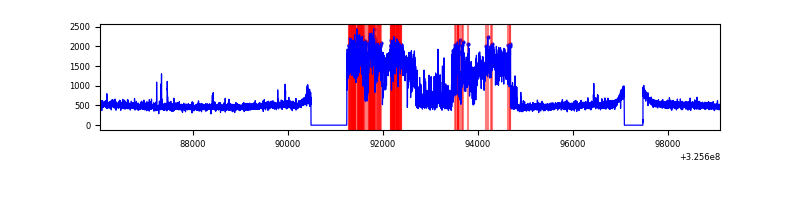 |
| D | 13053 | 11905 | 6 | 6 | 0.05% | 0.05% | 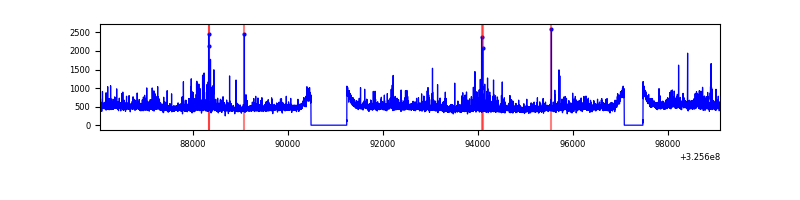 |
Top three noisy pixels from each quadrant. If the there are fewer than three noisy pixels in the level2.evt file, extra rows are filled as -1
| Pixel properties | Quadrant properties | ||||||
|---|---|---|---|---|---|---|---|
| Quadrant | DetID | PixID | Counts | Sigma | Mean | Median | Sigma |
| A | 12 | 96 | 17554 | 53.01 | 1505 | 1474 | 303.3 |
| A | 13 | 254 | 15363 | 45.79 | 1505 | 1474 | 303.3 |
| A | 4 | 2 | 15190 | 45.22 | 1505 | 1474 | 303.3 |
| B | 3 | 64 | 434889 | 1508.87 | 1482 | 1444 | 287.3 |
| B | 10 | 246 | 112776 | 387.56 | 1482 | 1444 | 287.3 |
| B | 12 | 111 | 35367 | 118.09 | 1482 | 1444 | 287.3 |
| C | 7 | 247 | 3181859 | 9655.86 | 1412 | 1419 | 329.4 |
| C | 14 | 238 | 220798 | 666.04 | 1412 | 1419 | 329.4 |
| C | 10 | 91 | 23184 | 66.08 | 1412 | 1419 | 329.4 |
| D | 8 | 195 | 323840 | 901.9 | 1463 | 1420 | 357.5 |
| D | 12 | 233 | 128711 | 356.07 | 1463 | 1420 | 357.5 |
| D | 1 | 52 | 117797 | 325.54 | 1463 | 1420 | 357.5 |
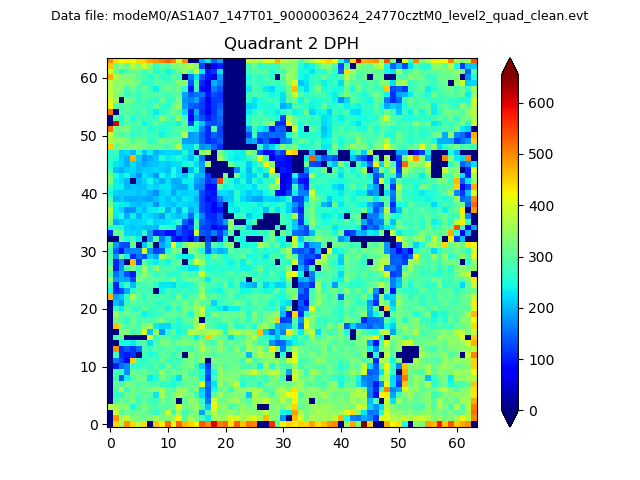
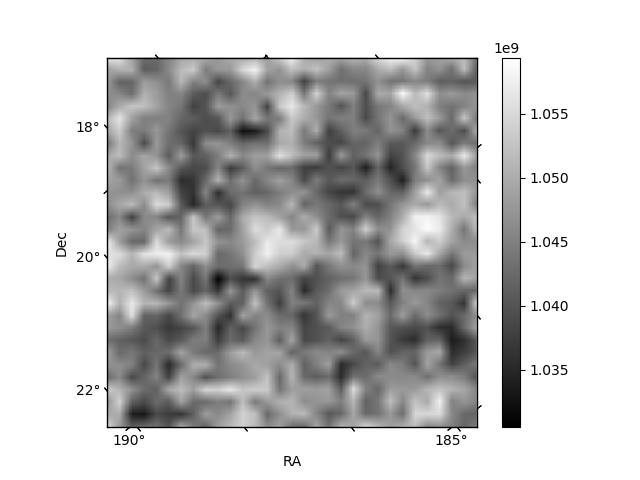
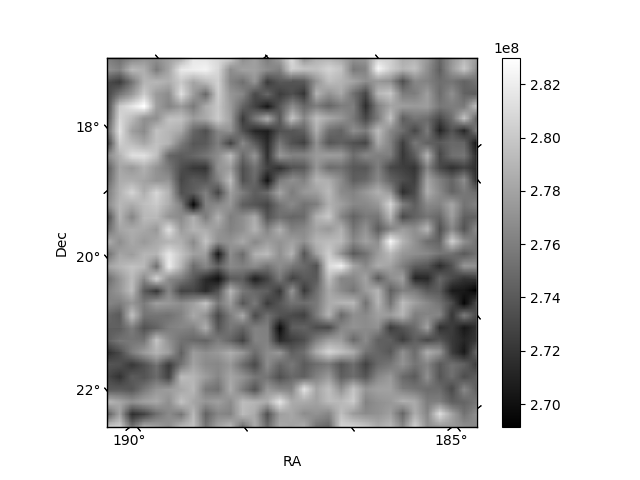
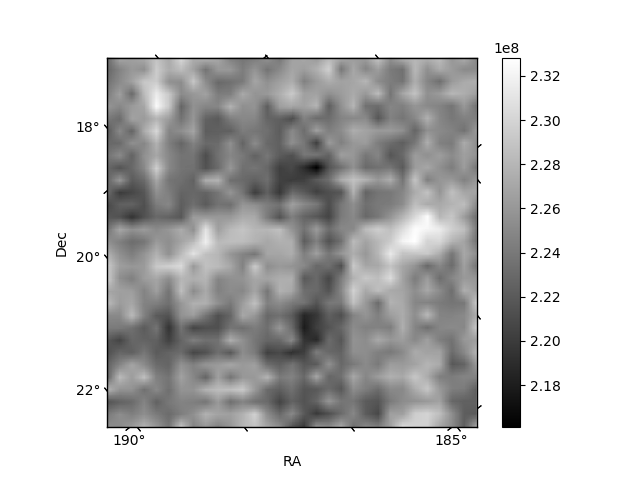
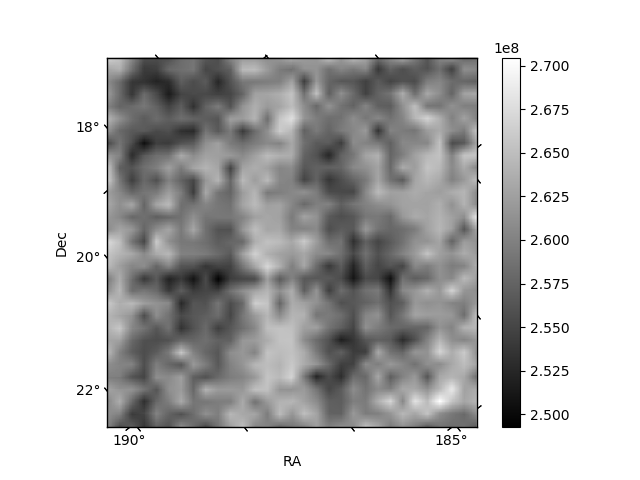
Histogram calculated using DETX and DETY for each event in the final _common_clean file
| Quadrant A | 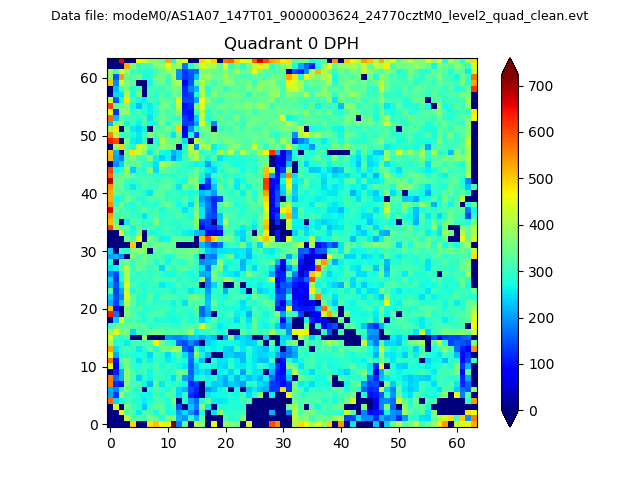 |
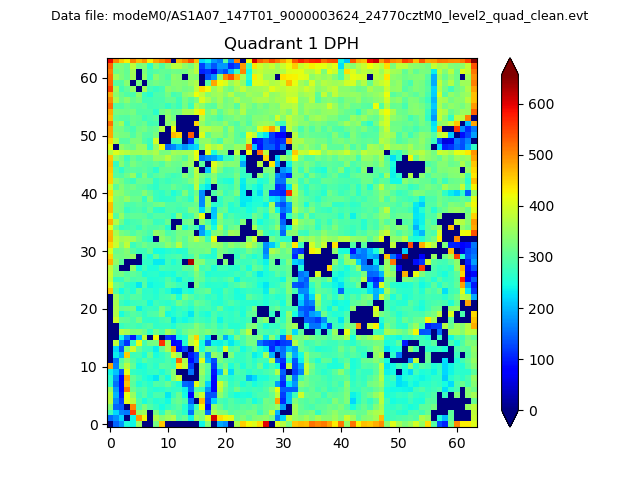 |
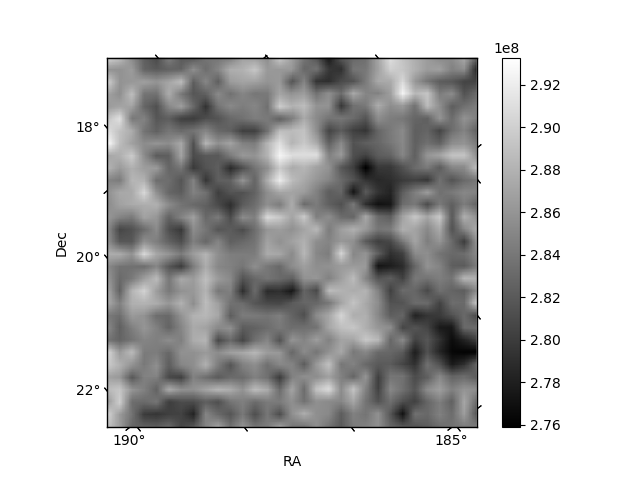
Quadrant B |
|---|---|---|---|
| Quadrant D | 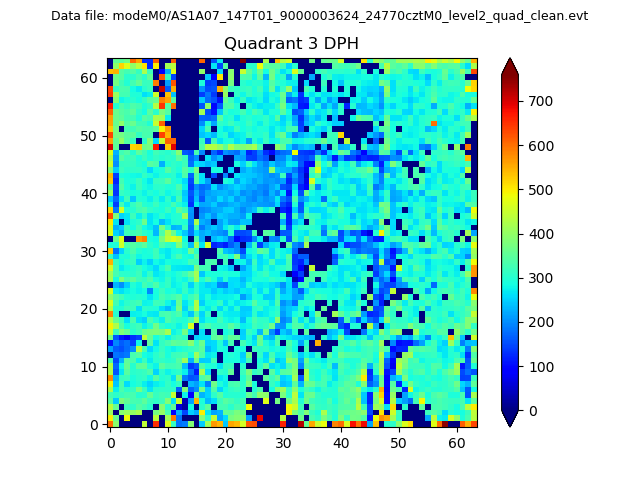 |
 |
Quadrant C |
| Plot type | Count rate plots | Images |
|---|---|---|
| Comparison with Poisson distribution Blue bars denote a histogram of data divided into 1 sec bins. Red curve is a Poisson curve with rate = median count rate of data. |
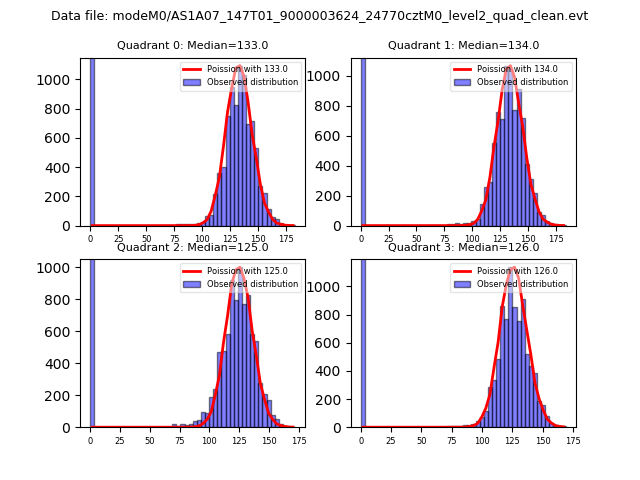 |
 |
| Quadrant-wise count rates Data is divided into 100 sec bins |
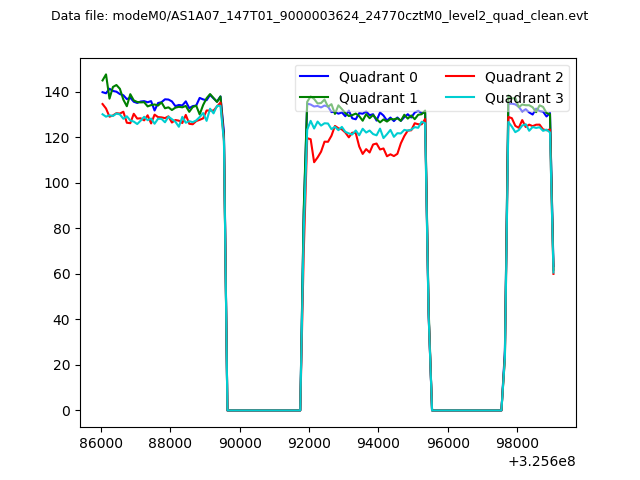 |
|
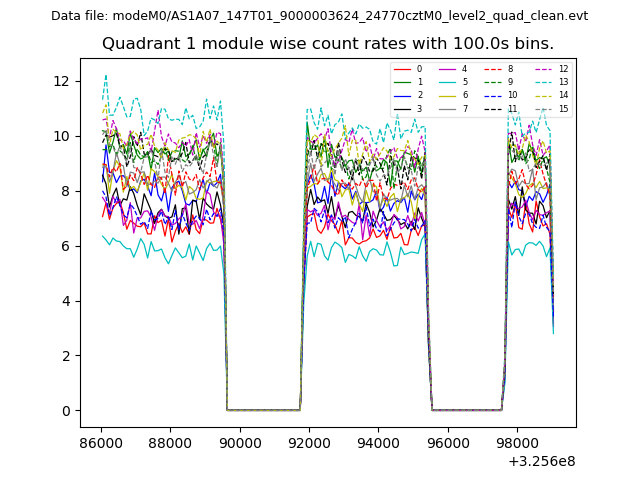
| Module-wise count rates for Quadrant A Data is divided into 100 sec bins |
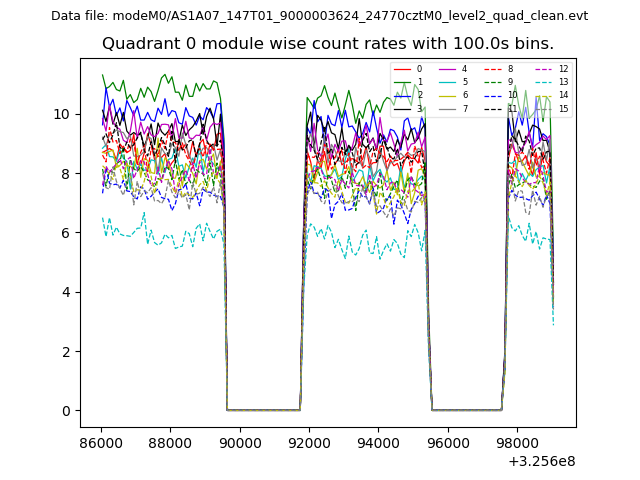 |
 |
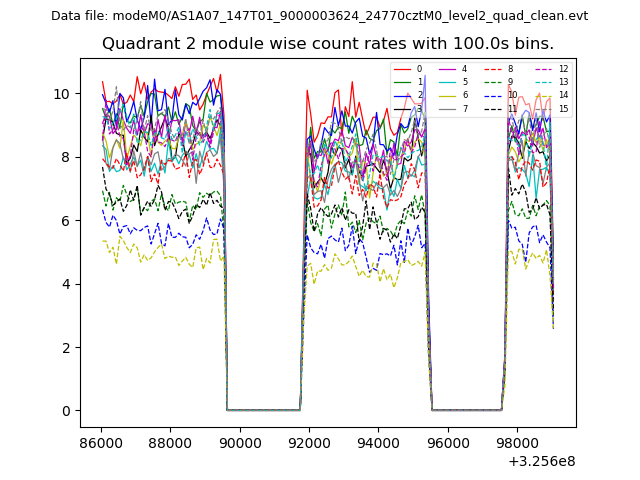
| Module-wise count rates for Quadrant B Data is divided into 100 sec bins |
 |
 |
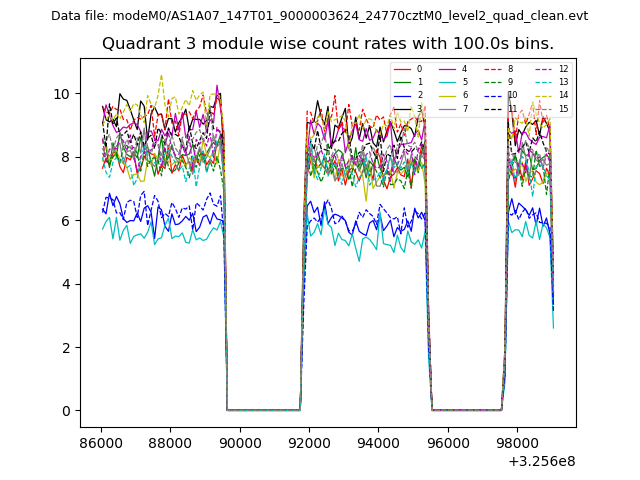
| Module-wise count rates for Quadrant C Data is divided into 100 sec bins |
 |
 |
| Module-wise count rates for Quadrant D Data is divided into 100 sec bins |
 |
 |
| Parameter | Plot |
|---|---|
| CZT HV Monitor | 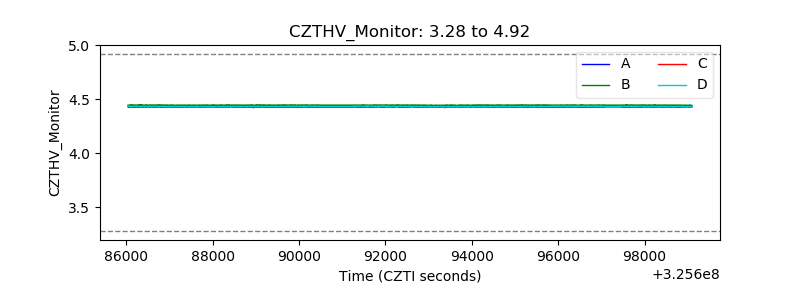 |
| D_VDD | 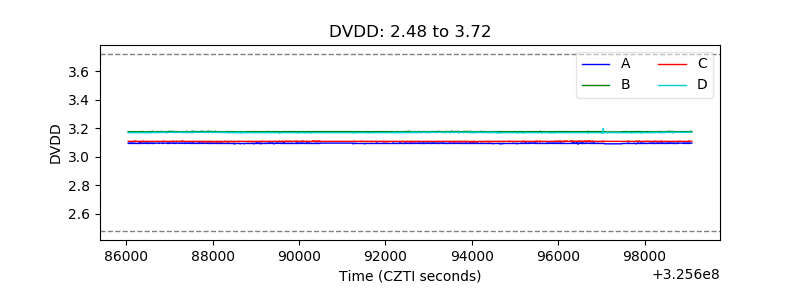 |
| Temperature 1 |  |
| Veto HV Monitor | 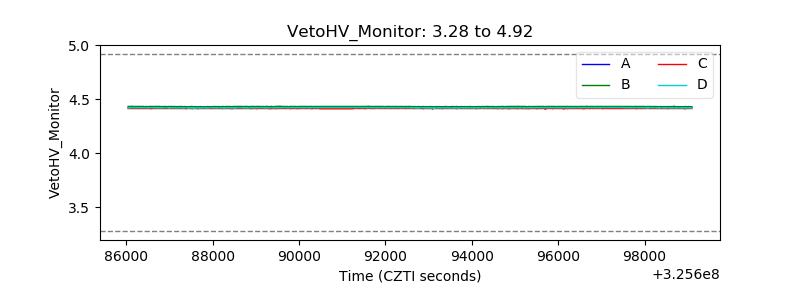 |
| Veto LLD | 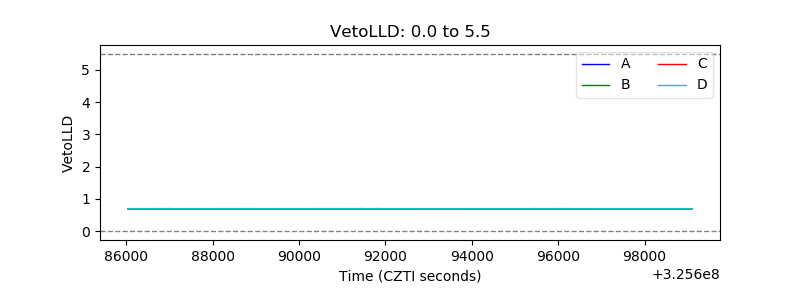 |
| Alpha Counter | 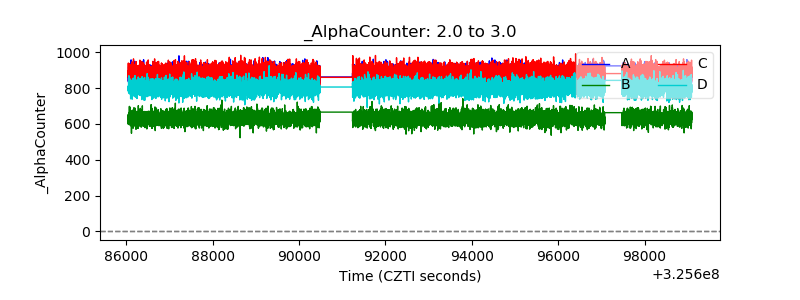 |
| _CPM_Rate | 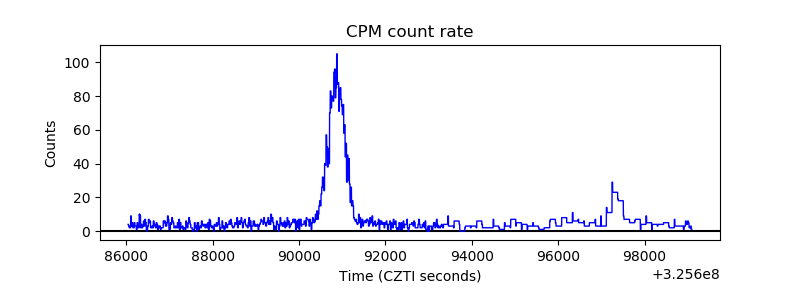 |
| CZT Counter | 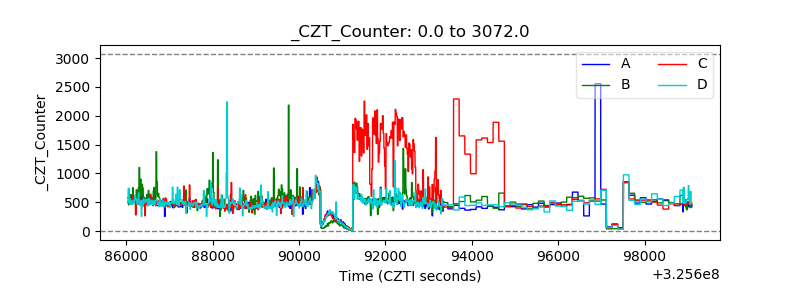 |
| +2.5 Volts monitor |  |
| +5 Volts monitor |  |
| _ROLL_ROT | 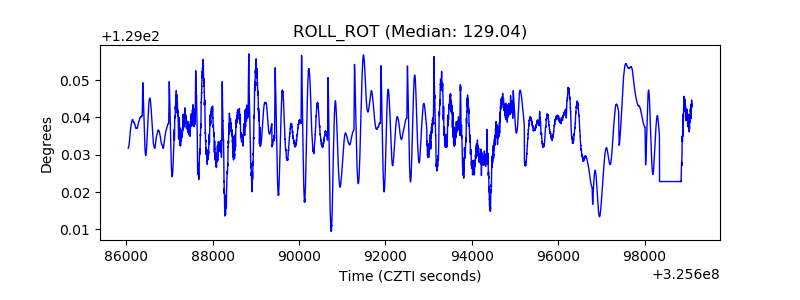 |
| _Roll_DEC | 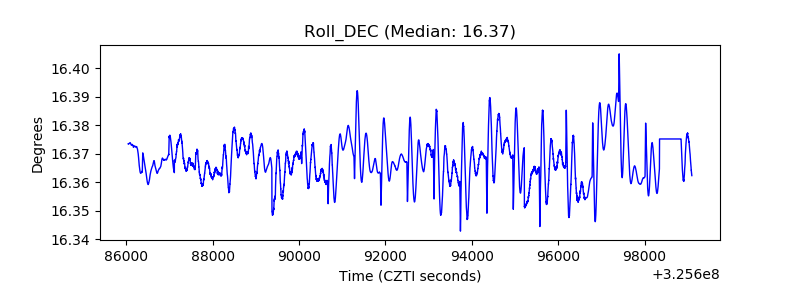 |
| _Roll_RA | 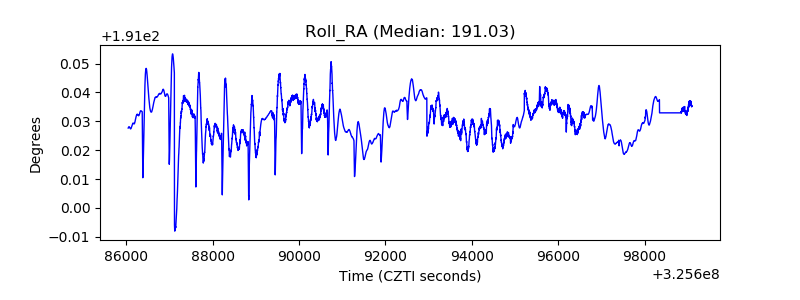 |
| Veto Counter |  |