| Param | Original file | Final file |
|---|---|---|
| Filename | modeM0/AS1A07_147T01_9000003624_24771cztM0_level2.evt | modeM0/AS1A07_147T01_9000003624_24771cztM0_level2_quad_clean.evt |
| Size (bytes) | 579,159,360 | 104,034,240 |
| Size | 552.3 MB | 99.2 MB |
| Events in quadrant A | 4,117,042 | 662,229 |
| Events in quadrant B | 4,262,328 | 667,351 |
| Events in quadrant C | 4,171,901 | 629,510 |
| Events in quadrant D | 4,433,056 | 622,879 |
| Mode M0 | |||
|---|---|---|---|
| Quadrant | BADHDUFLAG | Total packets | Discarded packets |
| A | 0 | 17385 | 2 |
| B | 0 | 17662 | 2 |
| C | 0 | 17405 | 2 |
| D | 0 | 18339 | 2 |
| Mode SS | |||
|---|---|---|---|
| Quadrant | BADHDUFLAG | Total packets | Discarded packets |
| A | 0 | 170 | 0 |
| B | 0 | 170 | 0 |
| C | 0 | 170 | 0 |
| D | 0 | 170 | 0 |
| Mode M9 | |||
|---|---|---|---|
| Quadrant | BADHDUFLAG | Total packets | Discarded packets |
| A | 0 | 6 | 0 |
| B | 0 | 6 | 0 |
| C | 0 | 6 | 0 |
| D | 0 | 6 | 0 |
| Quadrant | Total seconds | Saturated seconds | Saturation percentage |
|---|---|---|---|
| A | 8180 | 237 | 2.897311% |
| B | 8181 | 311 | 3.801491% |
| C | 8181 | 333 | 4.070407% |
| D | 8181 | 205 | 2.505806% |
Noise dominated data is calculated using 1-second bins in cleaned event files. If a bin has >2000 counts, and if more than 50% of those come from <1% of pixels, then it is considered to be noise-dominated and hence unusable.
| Quadrant | # 1 sec bins | Bins with >0 counts | Bins with >2000 counts | High rate bins dominated by noise | Noise dominated (total time) | Noise dominated (detector-on time) | Marked lightcurve |
|---|---|---|---|---|---|---|---|
| A | 8760 | 8183 | 1 | 1 | 0.01% | 0.01% | 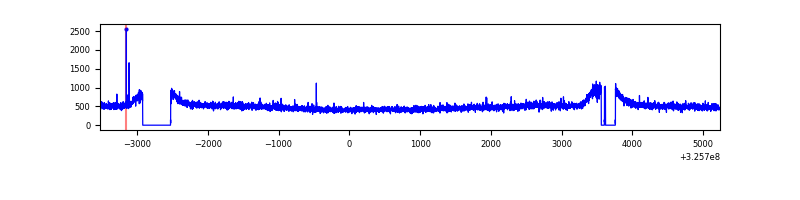 |
| B | 8761 | 8184 | 2 | 2 | 0.02% | 0.02% | 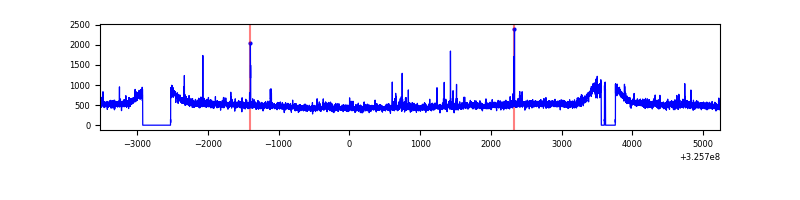 |
| C | 8761 | 8184 | 0 | 0 | 0.00% | 0.00% | 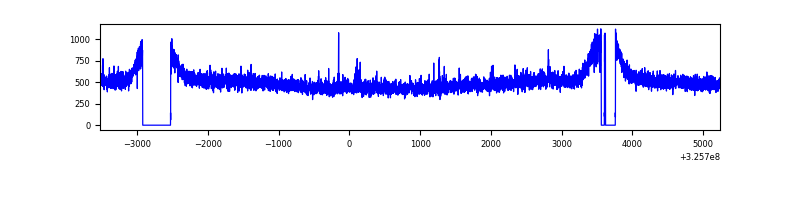 |
| D | 8761 | 8184 | 3 | 3 | 0.03% | 0.04% | 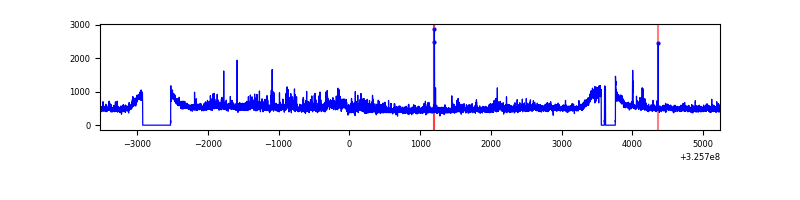 |
Top three noisy pixels from each quadrant. If the there are fewer than three noisy pixels in the level2.evt file, extra rows are filled as -1
| Pixel properties | Quadrant properties | ||||||
|---|---|---|---|---|---|---|---|
| Quadrant | DetID | PixID | Counts | Sigma | Mean | Median | Sigma |
| A | 13 | 254 | 11164 | 46.96 | 1064 | 1039 | 215.6 |
| A | 3 | 137 | 10323 | 43.06 | 1064 | 1039 | 215.6 |
| A | 0 | 226 | 9006 | 36.95 | 1064 | 1039 | 215.6 |
| B | 3 | 64 | 81605 | 389.86 | 1052 | 1022 | 206.7 |
| B | 12 | 111 | 26321 | 122.4 | 1052 | 1022 | 206.7 |
| B | 0 | 230 | 24869 | 115.37 | 1052 | 1022 | 206.7 |
| C | 14 | 238 | 158639 | 655.83 | 1016 | 1021 | 240.3 |
| C | 7 | 247 | 48235 | 196.45 | 1016 | 1021 | 240.3 |
| C | 13 | 61 | 6914 | 24.52 | 1016 | 1021 | 240.3 |
| D | 8 | 195 | 342521 | 1335.24 | 1040 | 1009 | 255.8 |
| D | 1 | 52 | 121372 | 470.59 | 1040 | 1009 | 255.8 |
| D | 2 | 234 | 31695 | 119.98 | 1040 | 1009 | 255.8 |
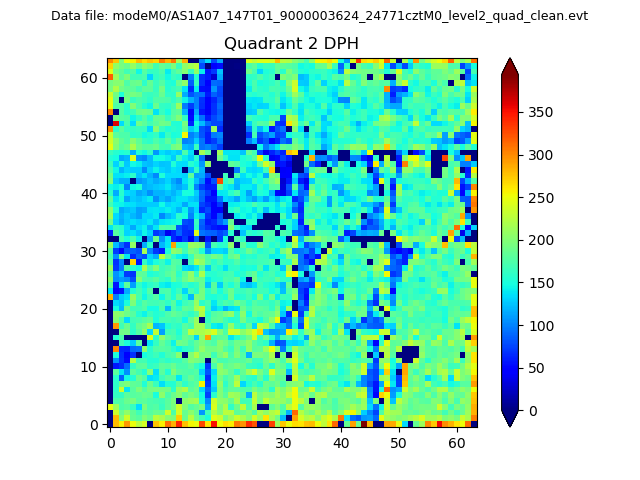
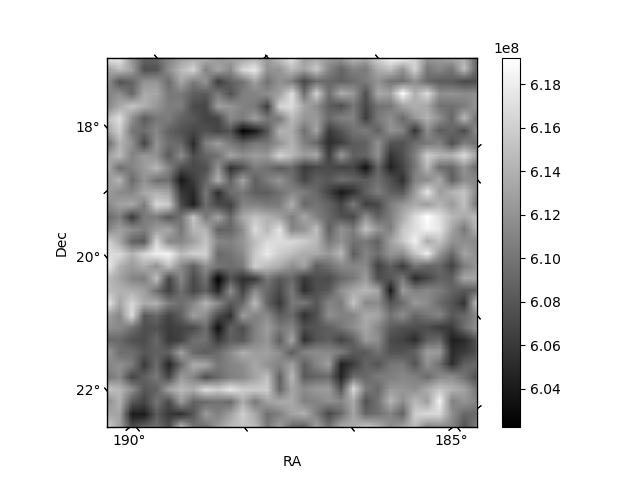
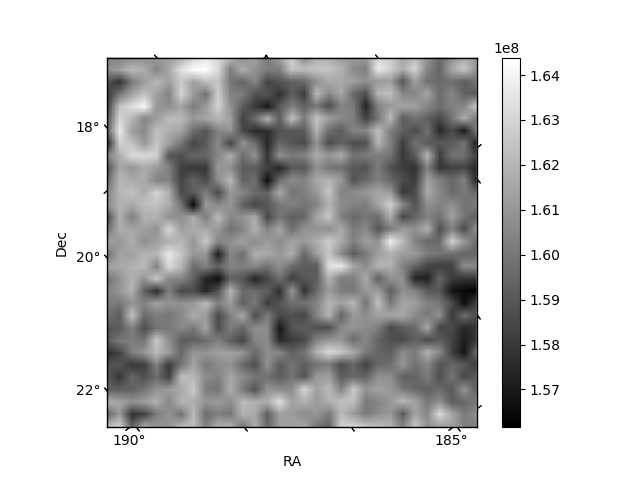
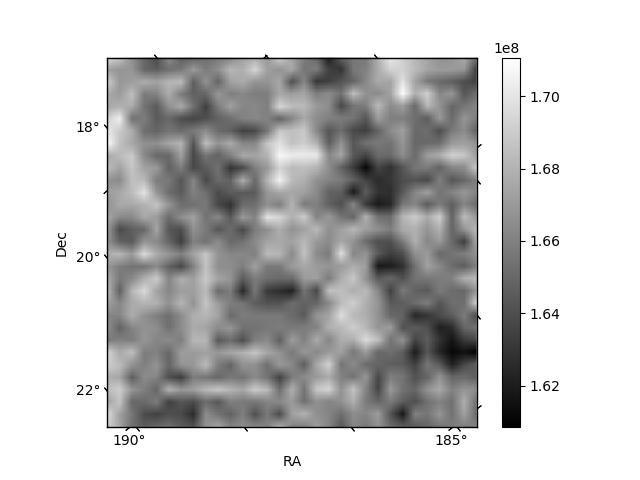
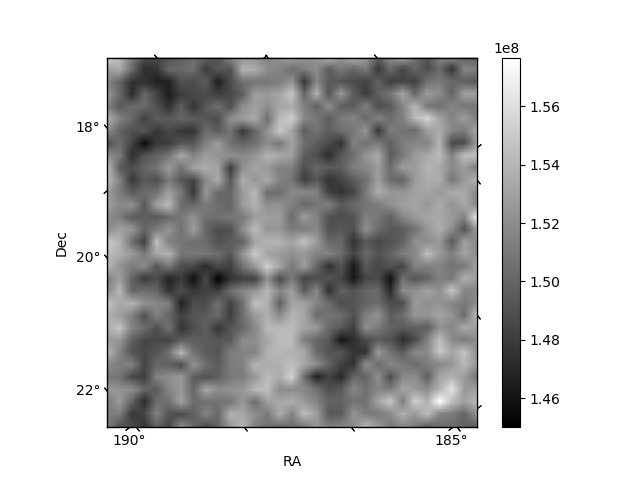
Histogram calculated using DETX and DETY for each event in the final _common_clean file
| Quadrant A | 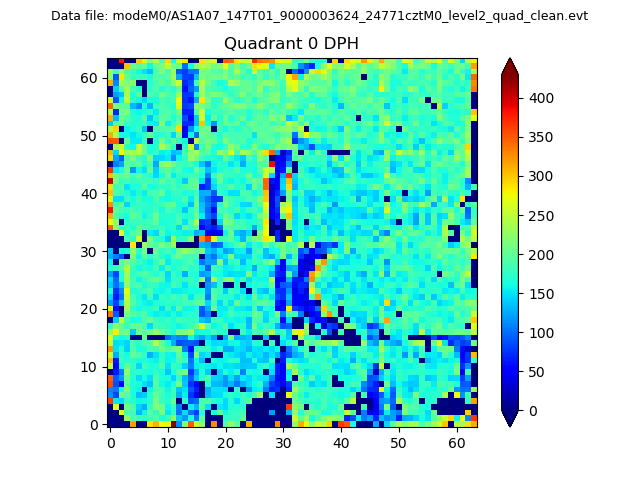 |
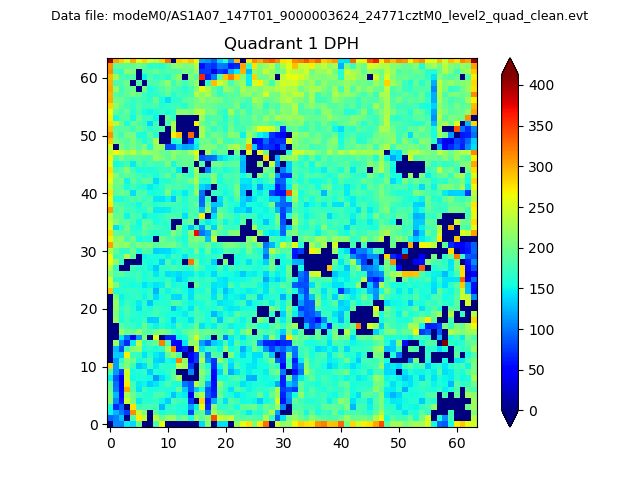 |
Quadrant B |
|---|---|---|---|
| Quadrant D | 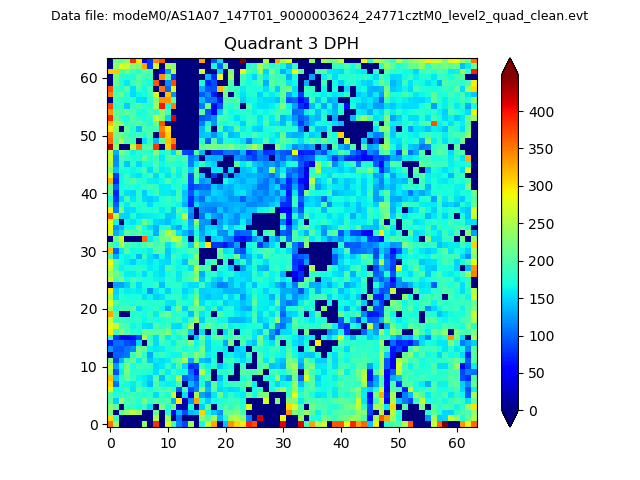 |
 |
Quadrant C |
| Plot type | Count rate plots | Images |
|---|---|---|
| Comparison with Poisson distribution Blue bars denote a histogram of data divided into 1 sec bins. Red curve is a Poisson curve with rate = median count rate of data. |
 |
 |
| Quadrant-wise count rates Data is divided into 100 sec bins |
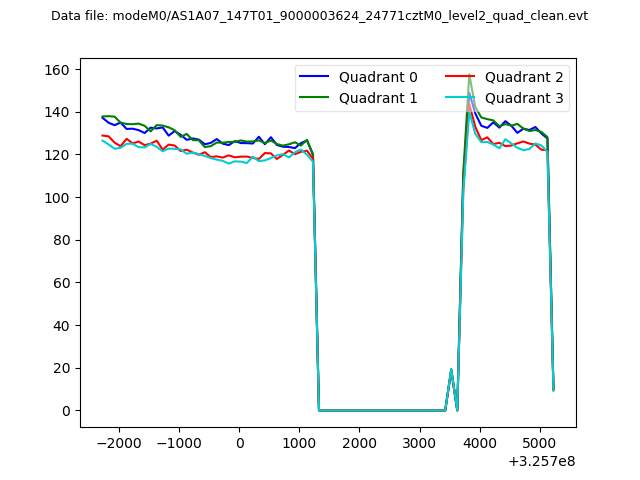 |
|
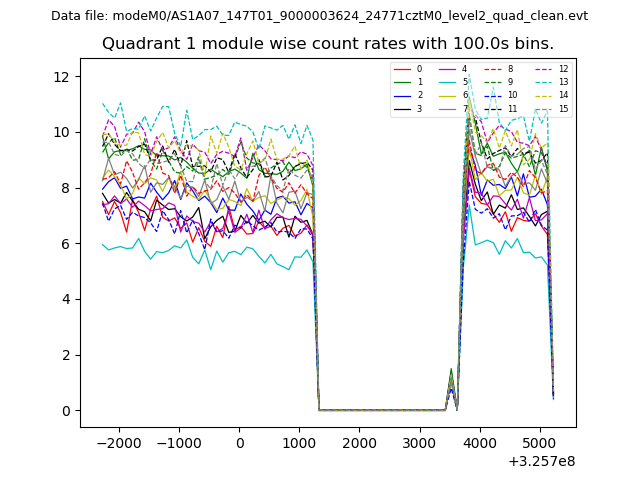
| Module-wise count rates for Quadrant A Data is divided into 100 sec bins |
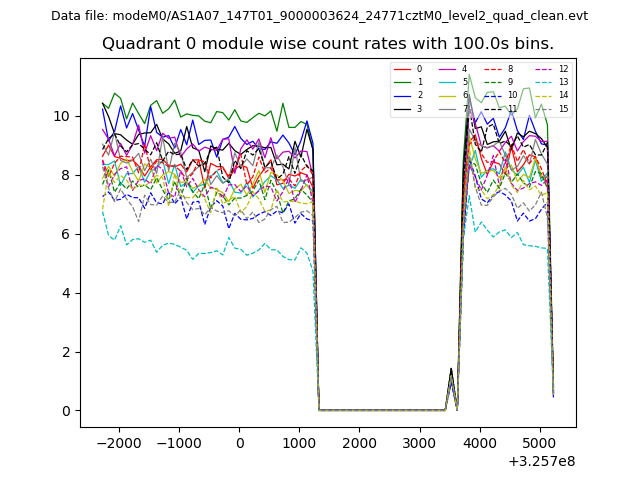 |
 |
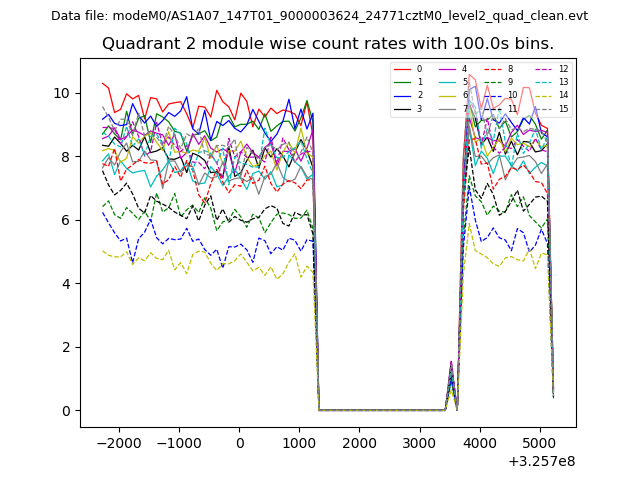
| Module-wise count rates for Quadrant B Data is divided into 100 sec bins |
 |
 |
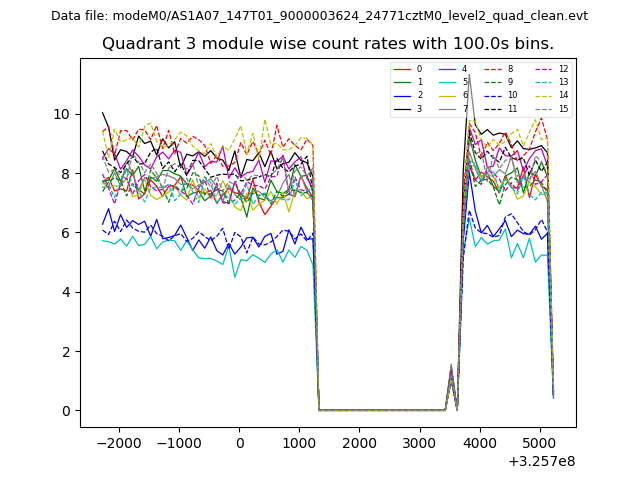
| Module-wise count rates for Quadrant C Data is divided into 100 sec bins |
 |
 |
| Module-wise count rates for Quadrant D Data is divided into 100 sec bins |
 |
 |
| Parameter | Plot |
|---|---|
| CZT HV Monitor | 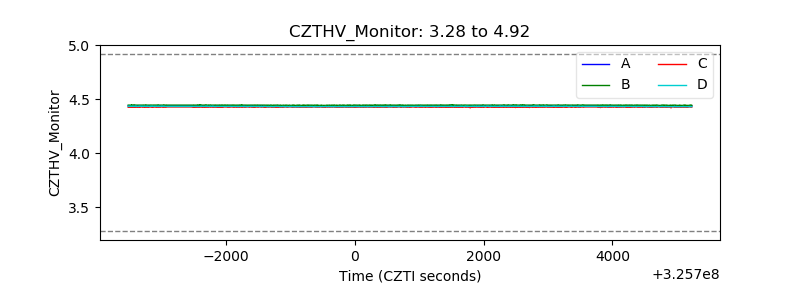 |
| D_VDD | 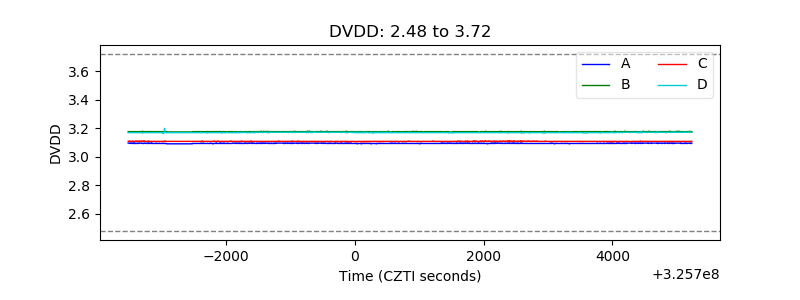 |
| Temperature 1 |  |
| Veto HV Monitor | 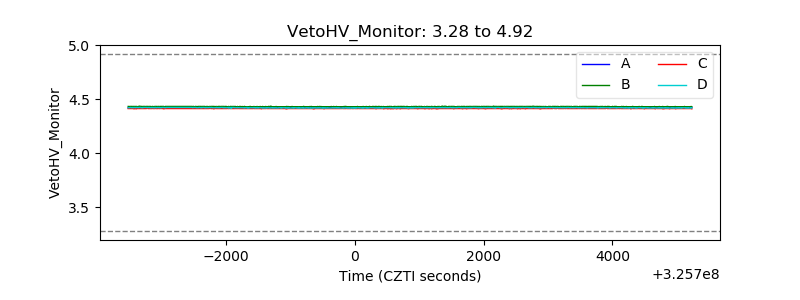 |
| Veto LLD | 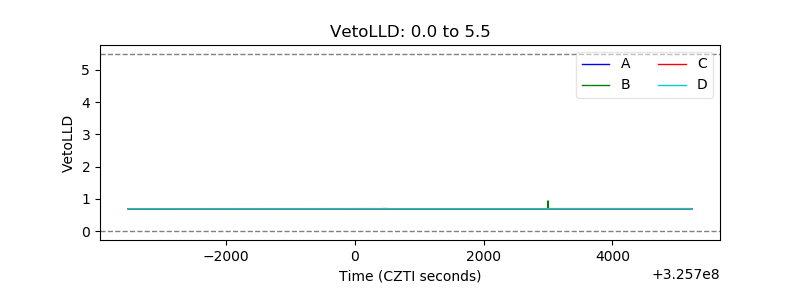 |
| Alpha Counter | 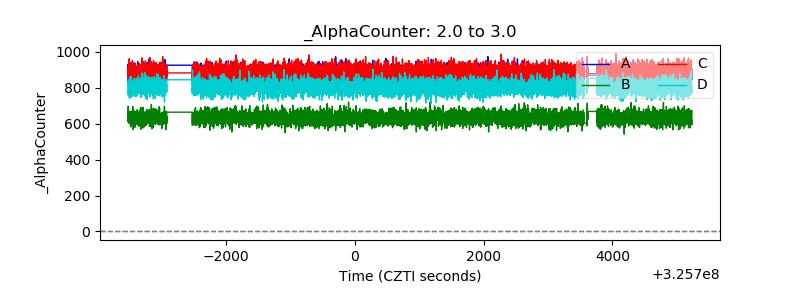 |
| _CPM_Rate | 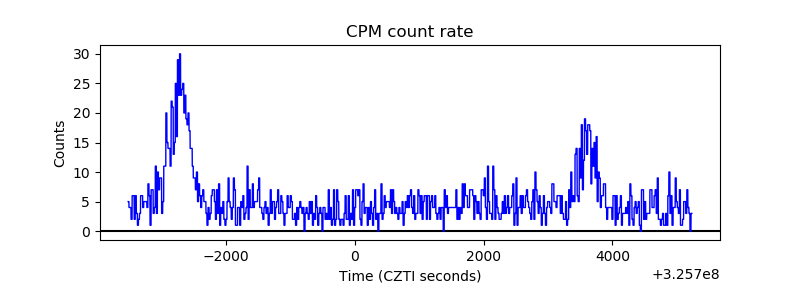 |
| CZT Counter | 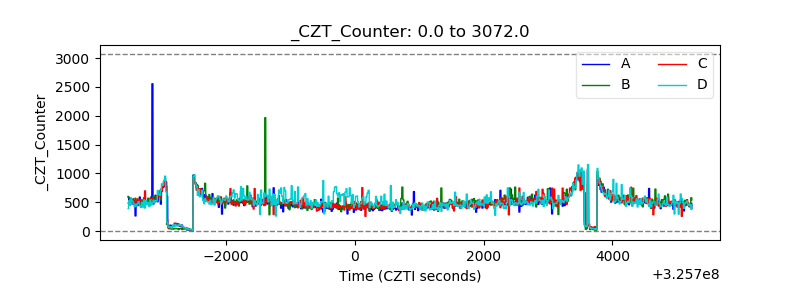 |
| +2.5 Volts monitor |  |
| +5 Volts monitor |  |
| _ROLL_ROT | 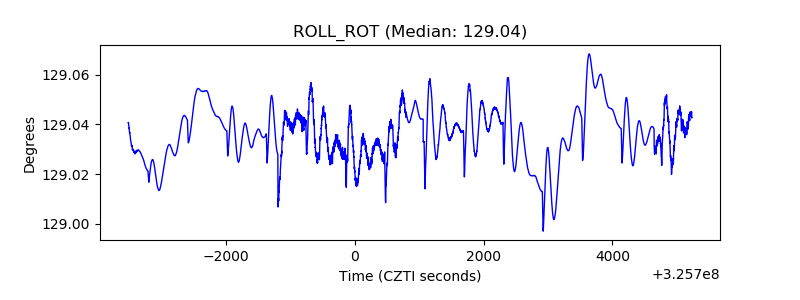 |
| _Roll_DEC |  |
| _Roll_RA | 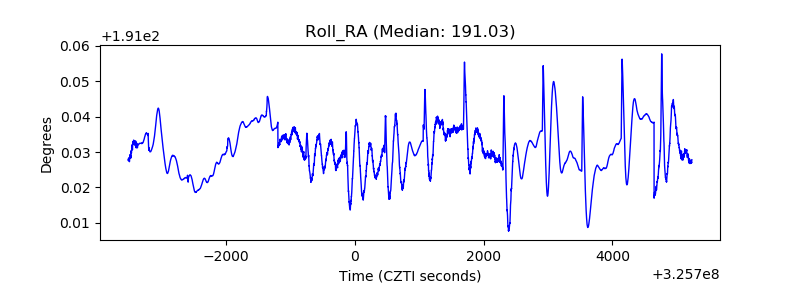 |
| Veto Counter | 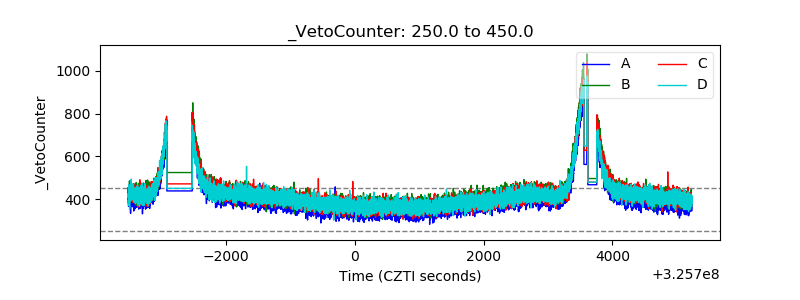 |