| Param | Original file | Final file |
|---|---|---|
| Filename | modeM0/AS1A07_147T01_9000003624_24772cztM0_level2.evt | modeM0/AS1A07_147T01_9000003624_24772cztM0_level2_quad_clean.evt |
| Size (bytes) | 532,347,840 | 106,704,000 |
| Size | 507.7 MB | 101.8 MB |
| Events in quadrant A | 3,759,240 | 690,181 |
| Events in quadrant B | 4,083,762 | 695,322 |
| Events in quadrant C | 3,783,072 | 660,944 |
| Events in quadrant D | 3,977,690 | 653,744 |
| Mode M0 | |||
|---|---|---|---|
| Quadrant | BADHDUFLAG | Total packets | Discarded packets |
| A | 0 | 16146 | 2 |
| B | 0 | 16963 | 2 |
| C | 0 | 16115 | 2 |
| D | 0 | 16827 | 2 |
| Mode SS | |||
|---|---|---|---|
| Quadrant | BADHDUFLAG | Total packets | Discarded packets |
| A | 0 | 156 | 0 |
| B | 0 | 156 | 0 |
| C | 0 | 156 | 0 |
| D | 0 | 156 | 0 |
| Mode M9 | |||
|---|---|---|---|
| Quadrant | BADHDUFLAG | Total packets | Discarded packets |
| A | 0 | 6 | 0 |
| B | 0 | 6 | 0 |
| C | 0 | 6 | 0 |
| D | 0 | 6 | 0 |
| Quadrant | Total seconds | Saturated seconds | Saturation percentage |
|---|---|---|---|
| A | 7643 | 211 | 2.760696% |
| B | 7643 | 278 | 3.637315% |
| C | 7644 | 280 | 3.663004% |
| D | 7644 | 223 | 2.917321% |
Noise dominated data is calculated using 1-second bins in cleaned event files. If a bin has >2000 counts, and if more than 50% of those come from <1% of pixels, then it is considered to be noise-dominated and hence unusable.
| Quadrant | # 1 sec bins | Bins with >0 counts | Bins with >2000 counts | High rate bins dominated by noise | Noise dominated (total time) | Noise dominated (detector-on time) | Marked lightcurve |
|---|---|---|---|---|---|---|---|
| A | 8193 | 7646 | 0 | 0 | 0.00% | 0.00% | 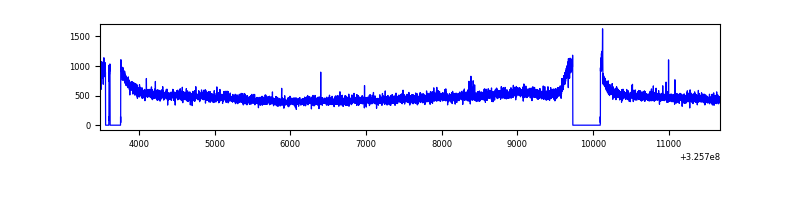 |
| B | 8193 | 7646 | 15 | 15 | 0.18% | 0.20% | 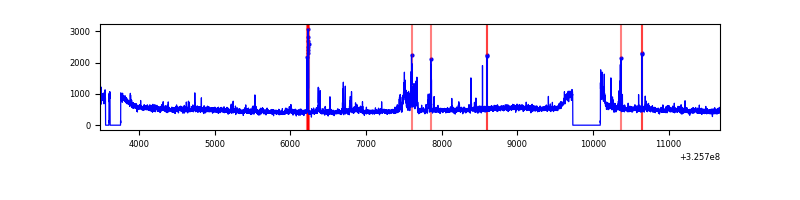 |
| C | 8194 | 7647 | 0 | 0 | 0.00% | 0.00% | 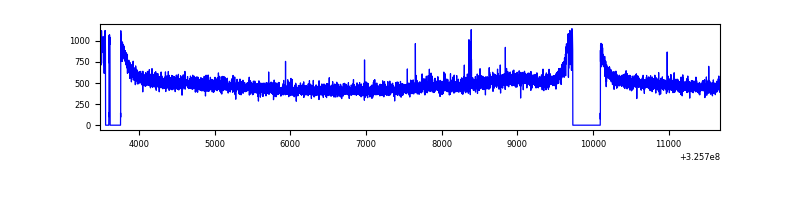 |
| D | 8194 | 7647 | 30 | 30 | 0.37% | 0.39% | 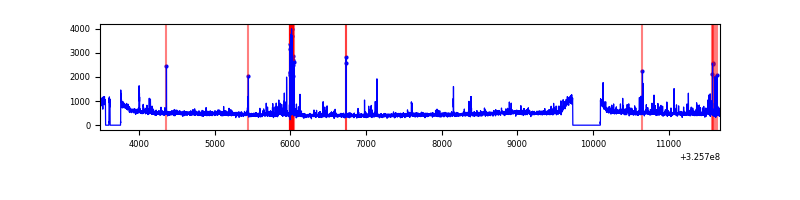 |
Top three noisy pixels from each quadrant. If the there are fewer than three noisy pixels in the level2.evt file, extra rows are filled as -1
| Pixel properties | Quadrant properties | ||||||
|---|---|---|---|---|---|---|---|
| Quadrant | DetID | PixID | Counts | Sigma | Mean | Median | Sigma |
| A | 13 | 254 | 11090 | 51.62 | 972 | 950 | 196.4 |
| A | 3 | 137 | 9352 | 42.78 | 972 | 950 | 196.4 |
| A | 15 | 223 | 8830 | 40.12 | 972 | 950 | 196.4 |
| B | 3 | 64 | 292267 | 1550.15 | 958 | 932 | 187.9 |
| B | 12 | 111 | 23761 | 121.47 | 958 | 932 | 187.9 |
| B | 11 | 111 | 21704 | 110.52 | 958 | 932 | 187.9 |
| C | 14 | 238 | 147376 | 663.85 | 930 | 936 | 220.6 |
| C | 13 | 61 | 6501 | 25.23 | 930 | 936 | 220.6 |
| C | 7 | 247 | 5821 | 22.14 | 930 | 936 | 220.6 |
| D | 1 | 52 | 191158 | 823.5 | 949 | 924 | 231.0 |
| D | 8 | 195 | 88960 | 381.1 | 949 | 924 | 231.0 |
| D | 12 | 233 | 84056 | 359.87 | 949 | 924 | 231.0 |
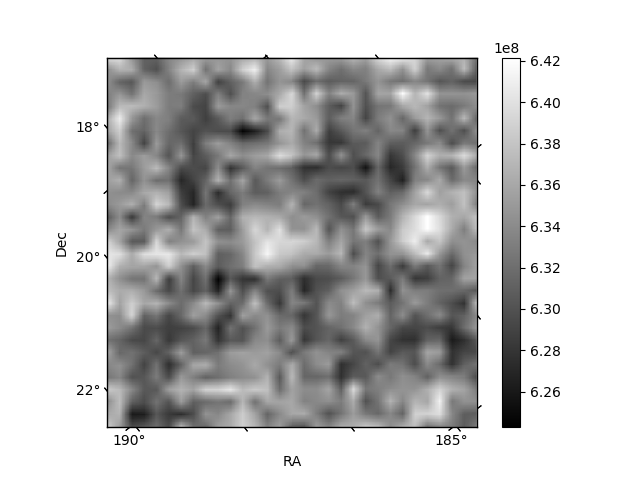
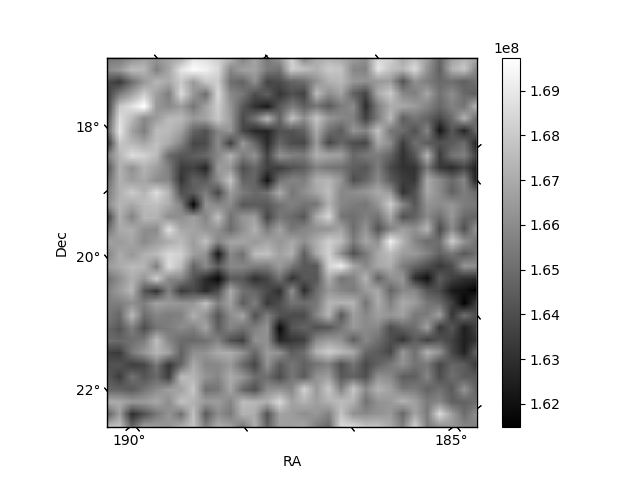
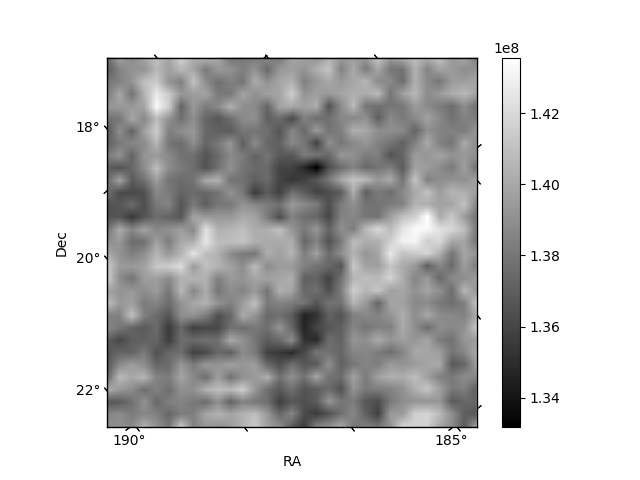
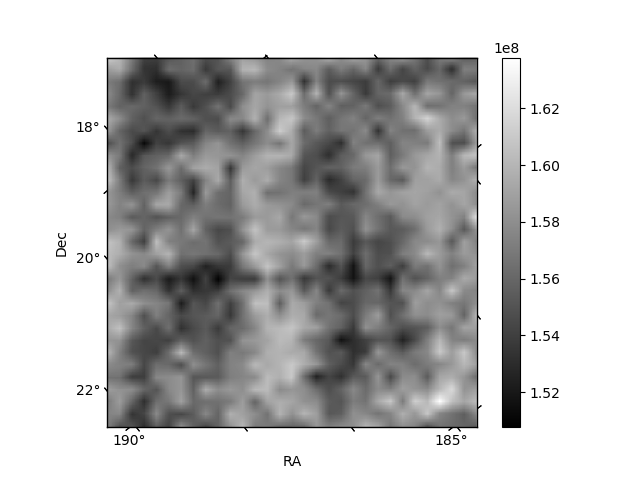
Histogram calculated using DETX and DETY for each event in the final _common_clean file
| Quadrant A | 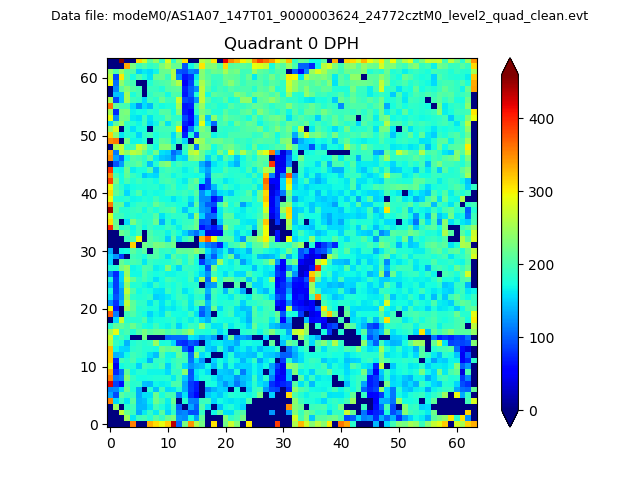 |
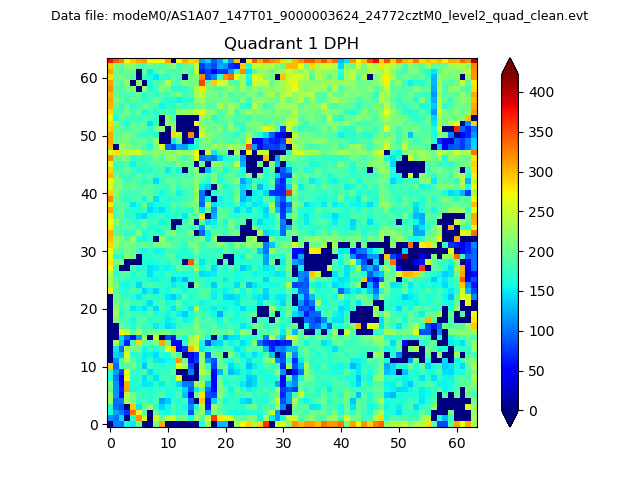 |
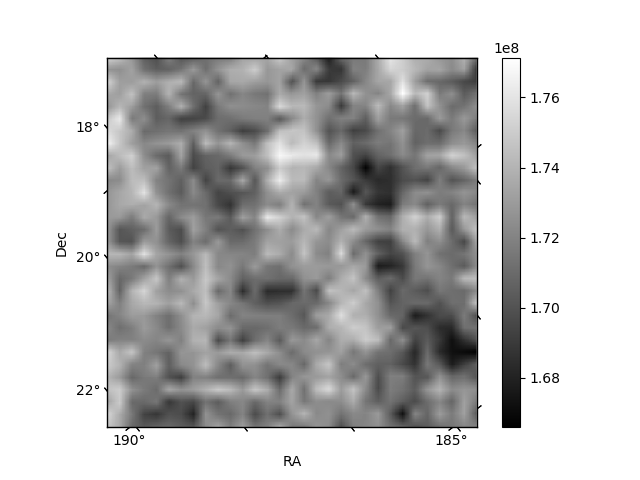
Quadrant B |
|---|---|---|---|
| Quadrant D | 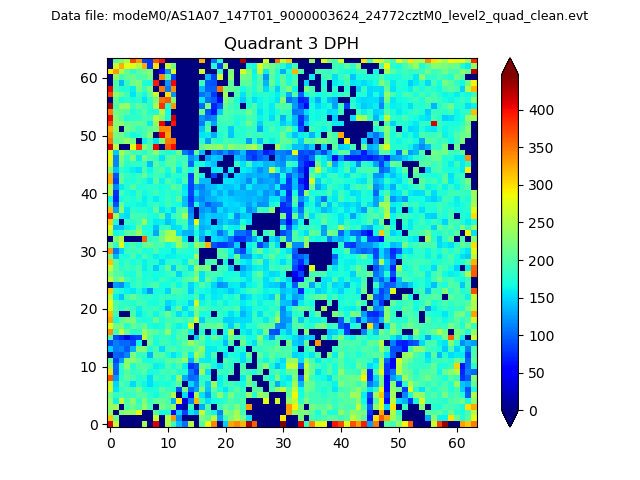 |
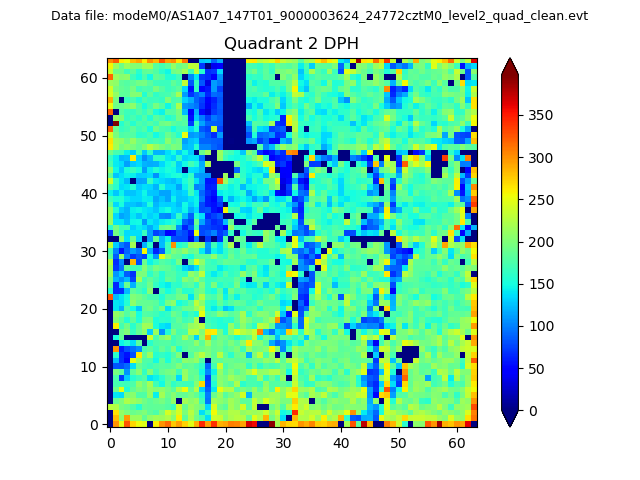 |
Quadrant C |
| Plot type | Count rate plots | Images |
|---|---|---|
| Comparison with Poisson distribution Blue bars denote a histogram of data divided into 1 sec bins. Red curve is a Poisson curve with rate = median count rate of data. |
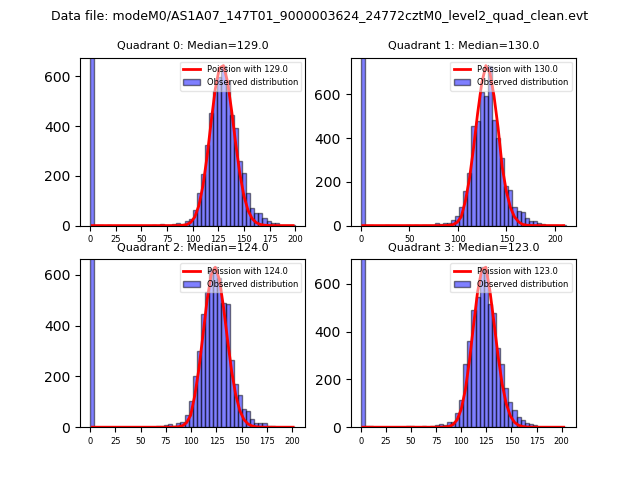 |
 |
| Quadrant-wise count rates Data is divided into 100 sec bins |
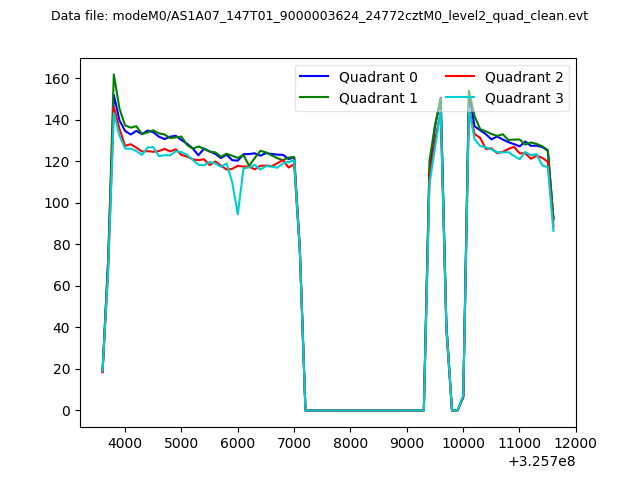 |
|
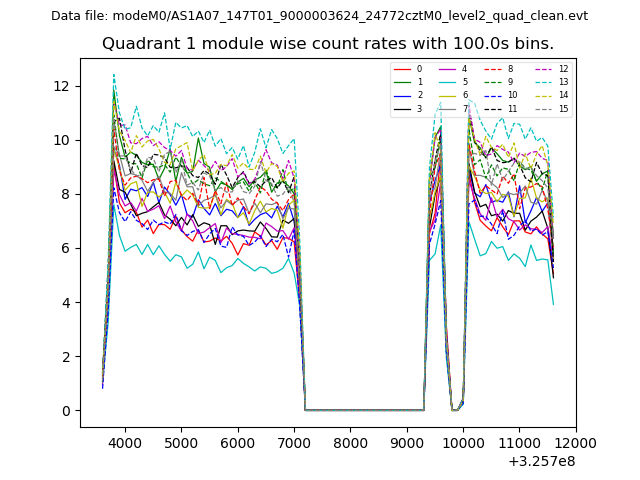
| Module-wise count rates for Quadrant A Data is divided into 100 sec bins |
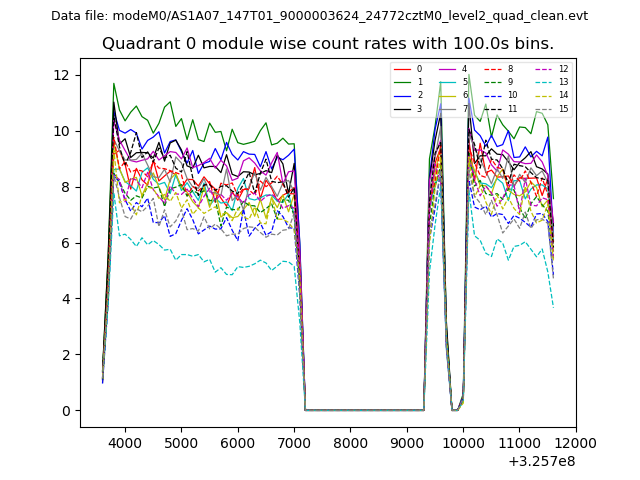 |
 |
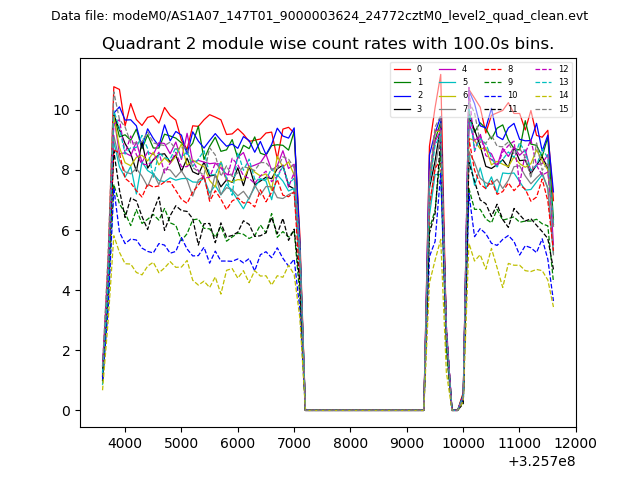
| Module-wise count rates for Quadrant B Data is divided into 100 sec bins |
 |
 |
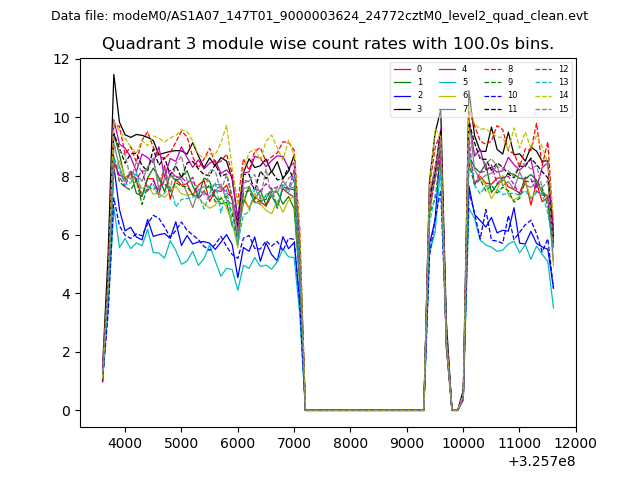
| Module-wise count rates for Quadrant C Data is divided into 100 sec bins |
 |
 |
| Module-wise count rates for Quadrant D Data is divided into 100 sec bins |
 |
 |
| Parameter | Plot |
|---|---|
| CZT HV Monitor | 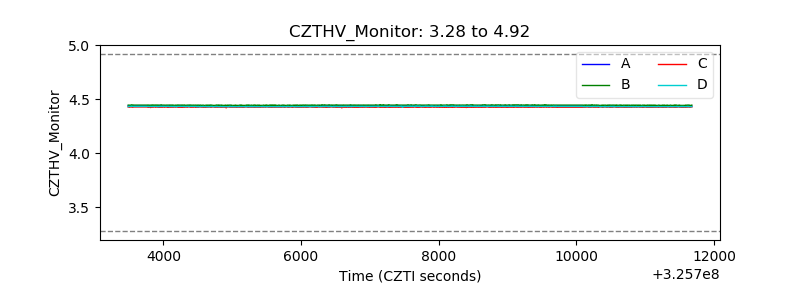 |
| D_VDD | 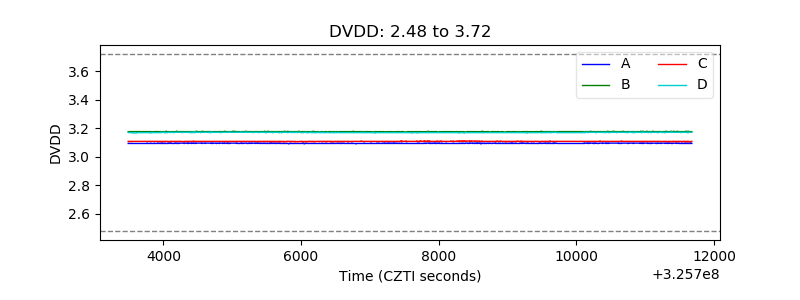 |
| Temperature 1 | 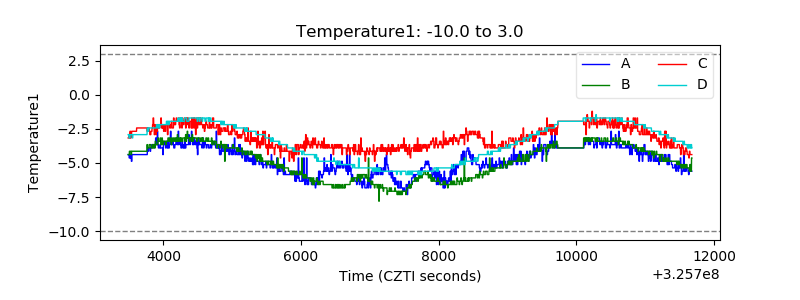 |
| Veto HV Monitor |  |
| Veto LLD | 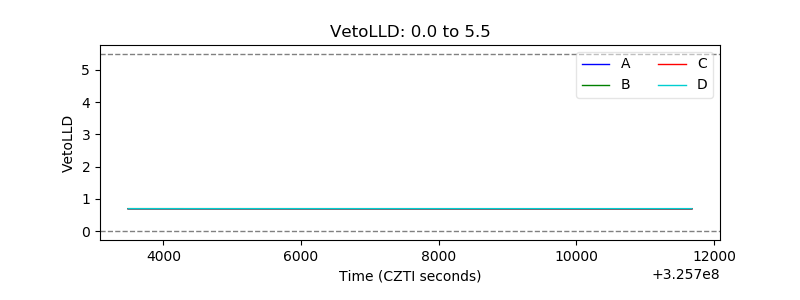 |
| Alpha Counter | 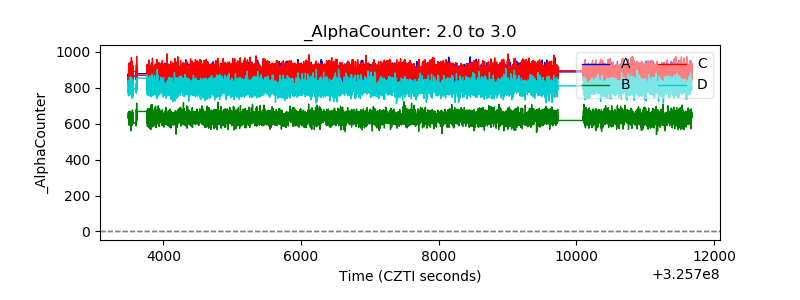 |
| _CPM_Rate | 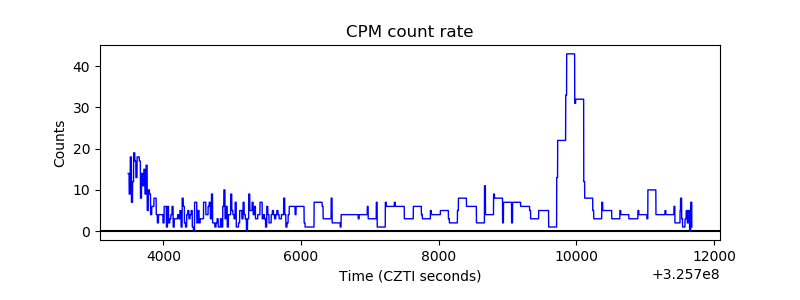 |
| CZT Counter | 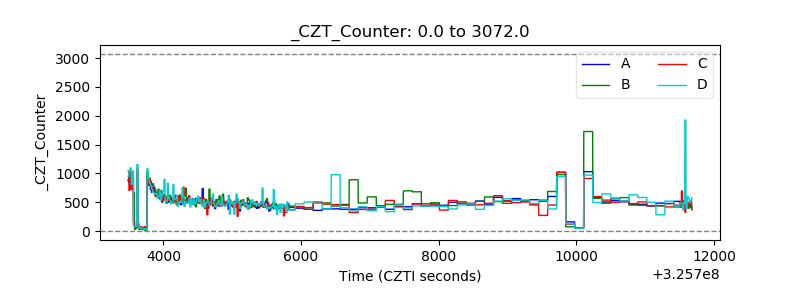 |
| +2.5 Volts monitor |  |
| +5 Volts monitor |  |
| _ROLL_ROT |  |
| _Roll_DEC |  |
| _Roll_RA | 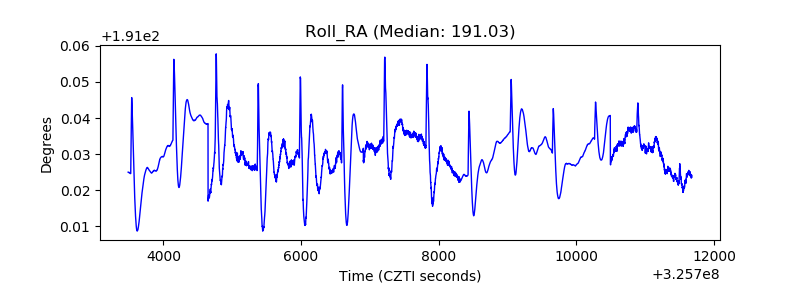 |
| Veto Counter | 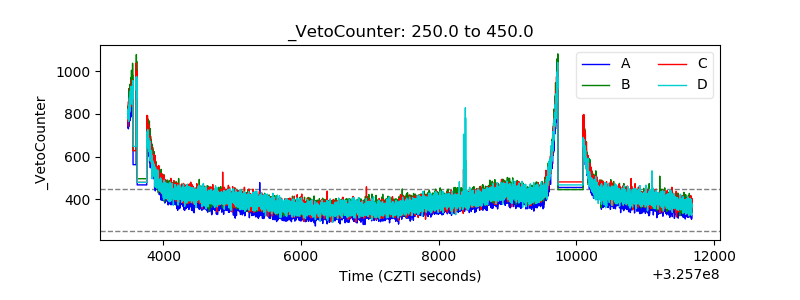 |