| Param | Original file | Final file |
|---|---|---|
| Filename | modeM0/AS1A07_147T01_9000003624_24776cztM0_level2.evt | modeM0/AS1A07_147T01_9000003624_24776cztM0_level2_quad_clean.evt |
| Size (bytes) | 467,593,920 | 88,436,160 |
| Size | 445.9 MB | 84.3 MB |
| Events in quadrant A | 3,138,107 | 575,815 |
| Events in quadrant B | 4,042,581 | 551,892 |
| Events in quadrant C | 3,200,121 | 550,941 |
| Events in quadrant D | 3,334,029 | 541,470 |
| Mode M0 | |||
|---|---|---|---|
| Quadrant | BADHDUFLAG | Total packets | Discarded packets |
| A | 0 | 13435 | 2 |
| B | 0 | 16161 | 2 |
| C | 0 | 13569 | 2 |
| D | 0 | 14251 | 2 |
| Mode SS | |||
|---|---|---|---|
| Quadrant | BADHDUFLAG | Total packets | Discarded packets |
| A | 0 | 132 | 0 |
| B | 0 | 132 | 0 |
| C | 0 | 132 | 0 |
| D | 0 | 132 | 0 |
| Mode M9 | |||
|---|---|---|---|
| Quadrant | BADHDUFLAG | Total packets | Discarded packets |
| A | 0 | 12 | 0 |
| B | 0 | 13 | 0 |
| C | 0 | 13 | 0 |
| D | 0 | 13 | 0 |
| Quadrant | Total seconds | Saturated seconds | Saturation percentage |
|---|---|---|---|
| A | 6570 | 23 | 0.350076% |
| B | 6570 | 367 | 5.585997% |
| C | 6570 | 61 | 0.928463% |
| D | 6570 | 45 | 0.684932% |
Noise dominated data is calculated using 1-second bins in cleaned event files. If a bin has >2000 counts, and if more than 50% of those come from <1% of pixels, then it is considered to be noise-dominated and hence unusable.
| Quadrant | # 1 sec bins | Bins with >0 counts | Bins with >2000 counts | High rate bins dominated by noise | Noise dominated (total time) | Noise dominated (detector-on time) | Marked lightcurve |
|---|---|---|---|---|---|---|---|
| A | 7595 | 6571 | 0 | 0 | 0.00% | 0.00% | 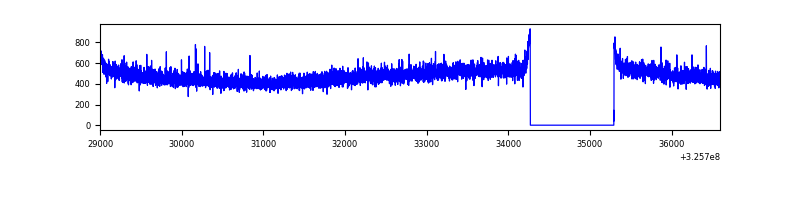 |
| B | 7595 | 6571 | 245 | 245 | 3.23% | 3.73% |  |
| C | 7595 | 6571 | 0 | 0 | 0.00% | 0.00% | 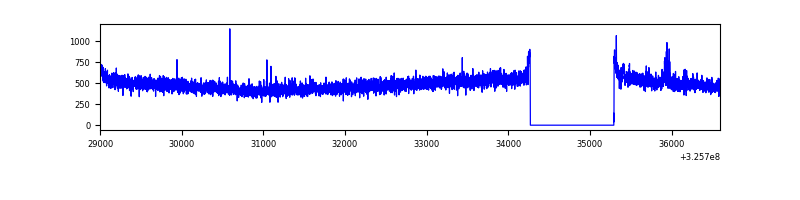 |
| D | 7595 | 6571 | 27 | 27 | 0.36% | 0.41% | 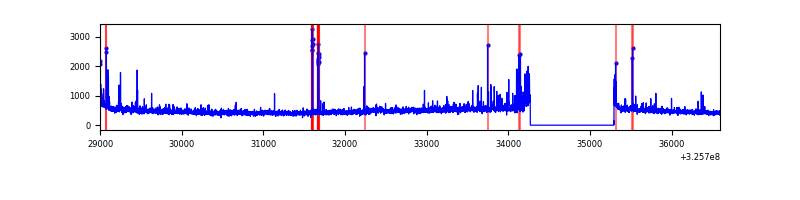 |
Top three noisy pixels from each quadrant. If the there are fewer than three noisy pixels in the level2.evt file, extra rows are filled as -1
| Pixel properties | Quadrant properties | ||||||
|---|---|---|---|---|---|---|---|
| Quadrant | DetID | PixID | Counts | Sigma | Mean | Median | Sigma |
| A | 13 | 254 | 10068 | 56.36 | 814 | 800 | 164.4 |
| A | 3 | 137 | 7637 | 41.58 | 814 | 800 | 164.4 |
| A | 0 | 226 | 6954 | 37.42 | 814 | 800 | 164.4 |
| B | 3 | 64 | 921112 | 6045.96 | 786 | 764 | 152.2 |
| B | 12 | 111 | 18702 | 117.84 | 786 | 764 | 152.2 |
| B | 11 | 111 | 16884 | 105.9 | 786 | 764 | 152.2 |
| C | 14 | 238 | 122042 | 661.32 | 779 | 785 | 183.4 |
| C | 2 | 16 | 21371 | 112.27 | 779 | 785 | 183.4 |
| C | 10 | 91 | 16320 | 84.73 | 779 | 785 | 183.4 |
| D | 1 | 52 | 248009 | 1294.16 | 782 | 760 | 191.0 |
| D | 12 | 233 | 40705 | 209.08 | 782 | 760 | 191.0 |
| D | 8 | 195 | 37496 | 192.28 | 782 | 760 | 191.0 |
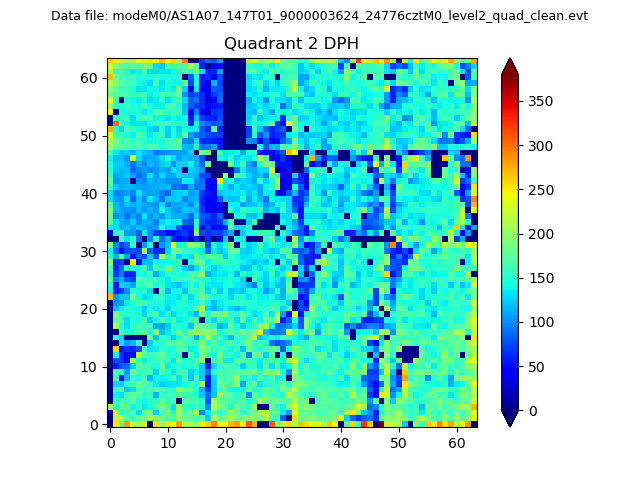
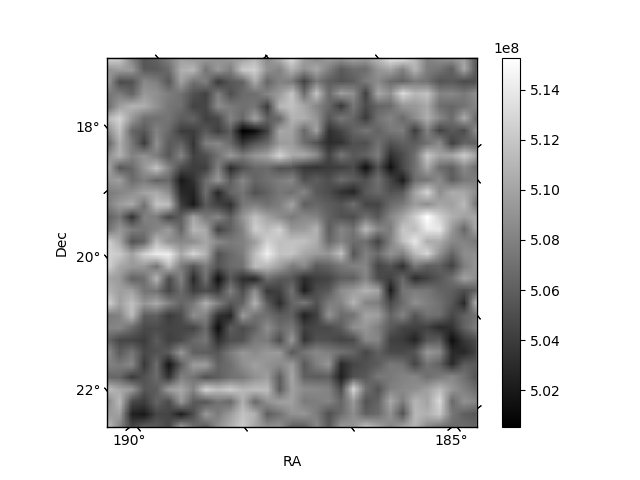
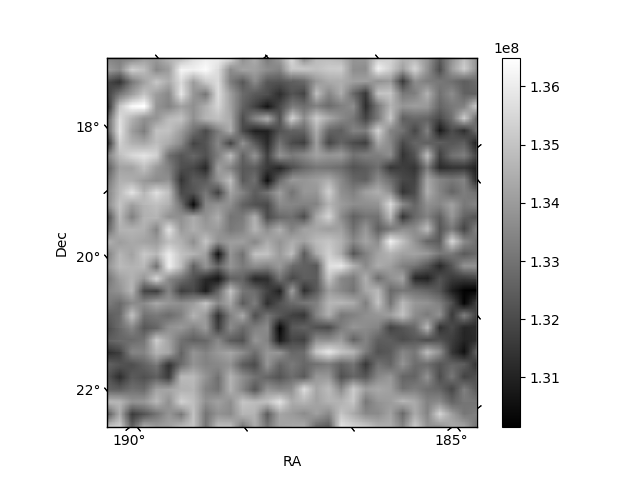
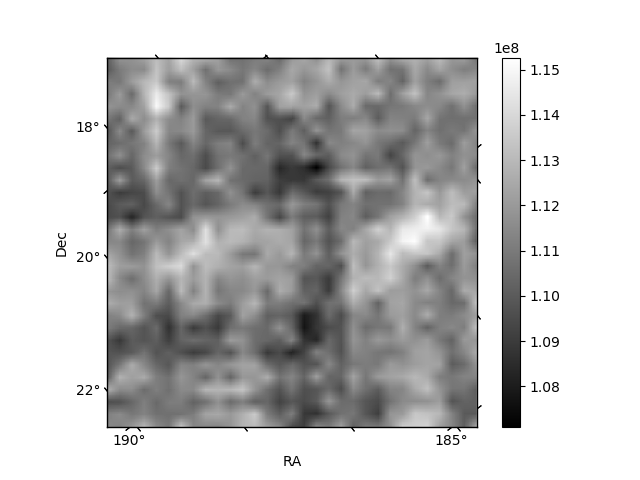
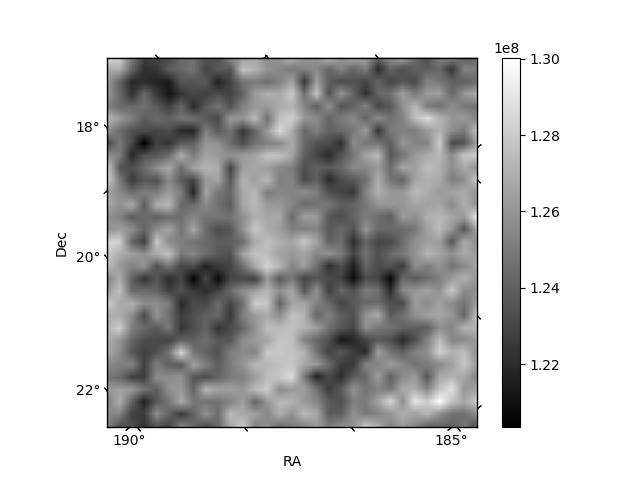
Histogram calculated using DETX and DETY for each event in the final _common_clean file
| Quadrant A |  |
 |
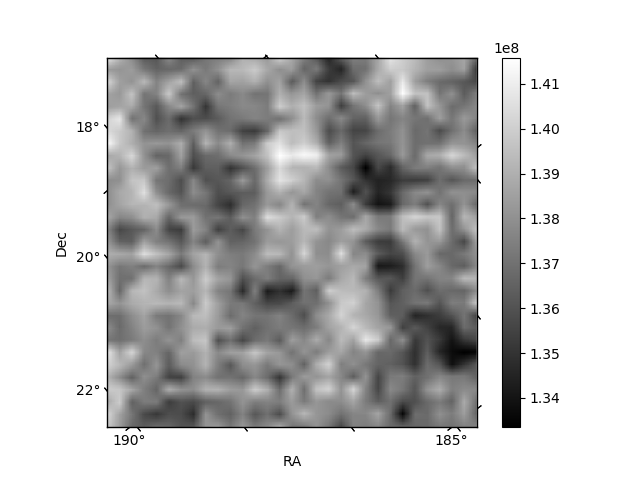
Quadrant B |
|---|---|---|---|
| Quadrant D |  |
 |
Quadrant C |
| Plot type | Count rate plots | Images |
|---|---|---|
| Comparison with Poisson distribution Blue bars denote a histogram of data divided into 1 sec bins. Red curve is a Poisson curve with rate = median count rate of data. |
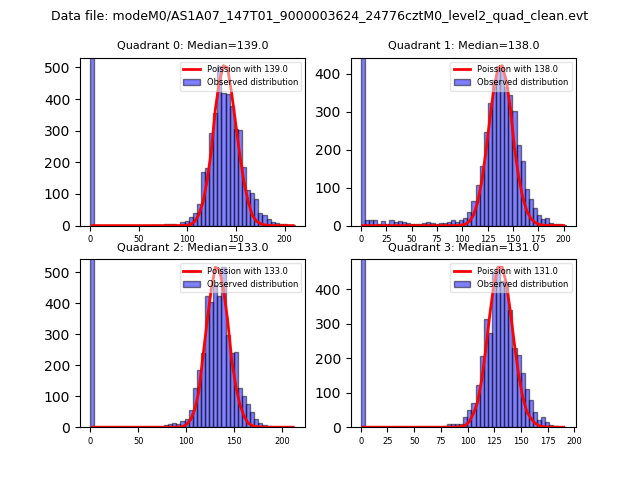 |
 |
| Quadrant-wise count rates Data is divided into 100 sec bins |
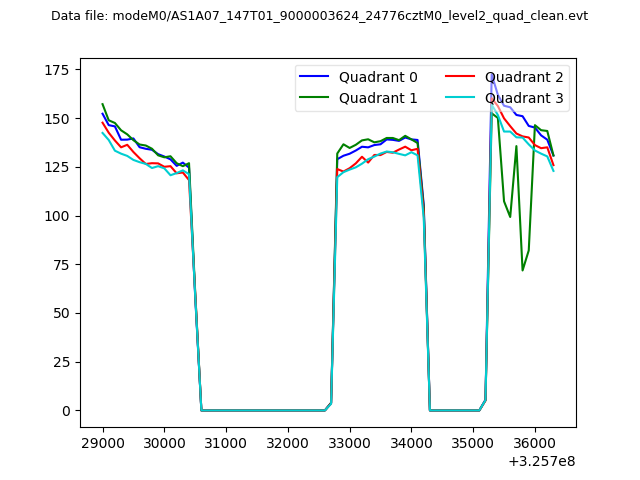 |
|
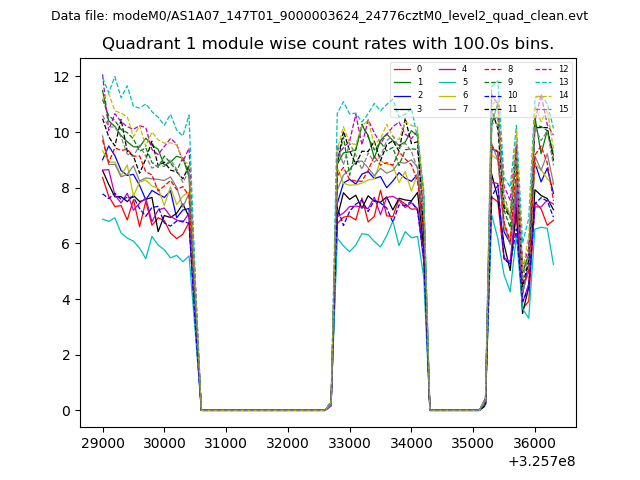
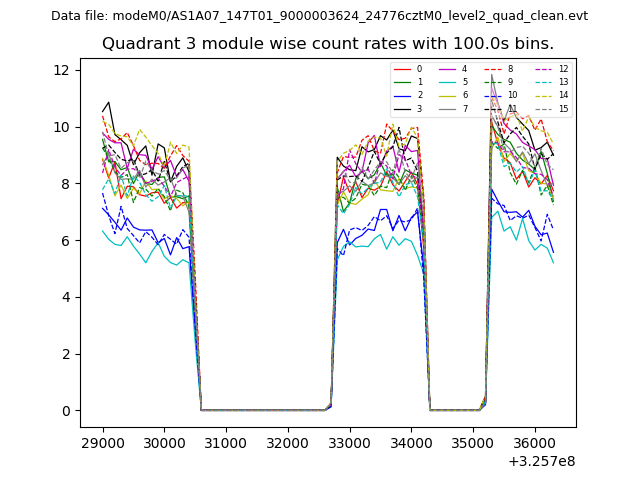
| Module-wise count rates for Quadrant A Data is divided into 100 sec bins |
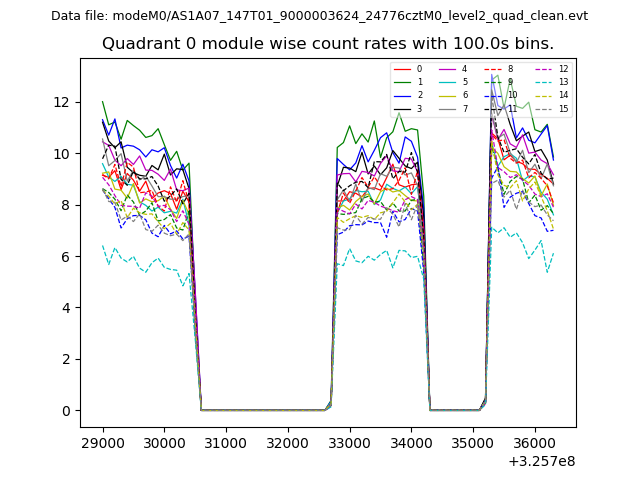 |
 |
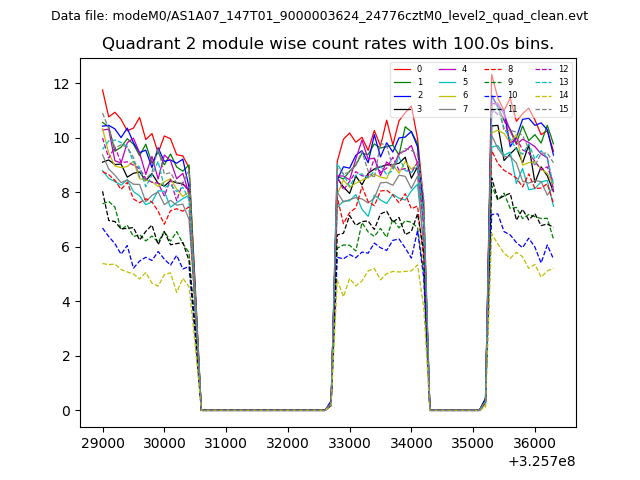
| Module-wise count rates for Quadrant B Data is divided into 100 sec bins |
 |
 |
| Module-wise count rates for Quadrant C Data is divided into 100 sec bins |
 |
 |
| Module-wise count rates for Quadrant D Data is divided into 100 sec bins |
 |
 |
| Parameter | Plot |
|---|---|
| CZT HV Monitor | 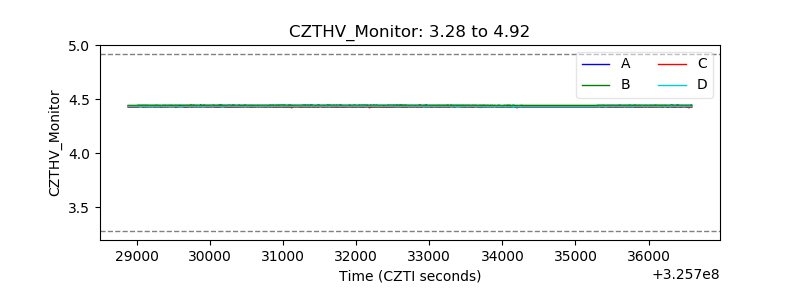 |
| D_VDD | 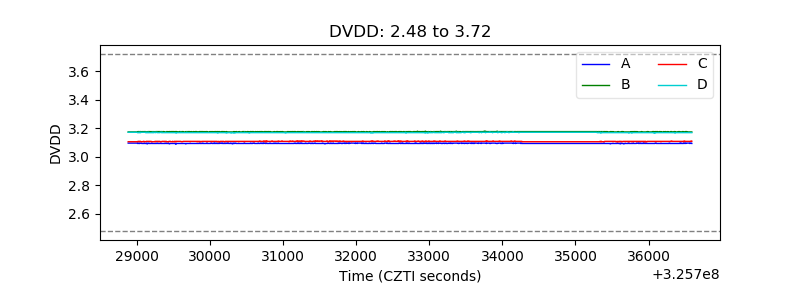 |
| Temperature 1 | 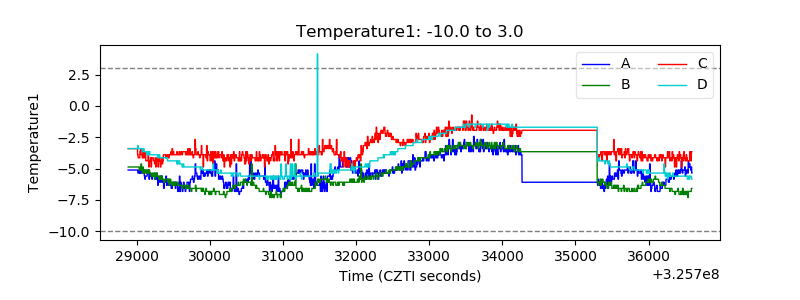 |
| Veto HV Monitor | 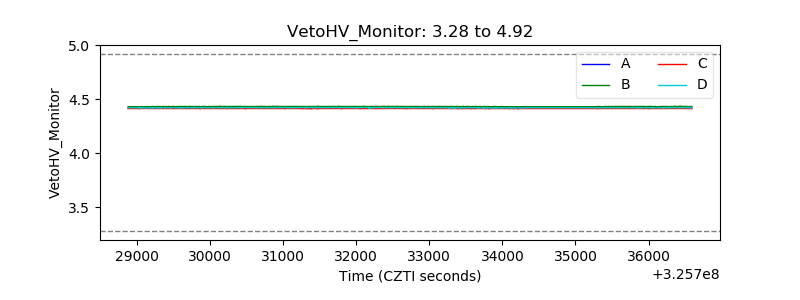 |
| Veto LLD | 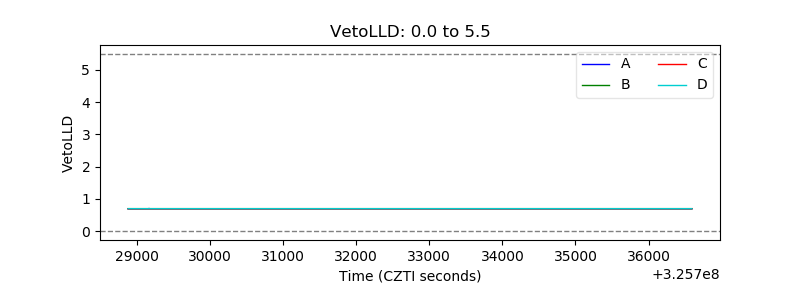 |
| Alpha Counter | 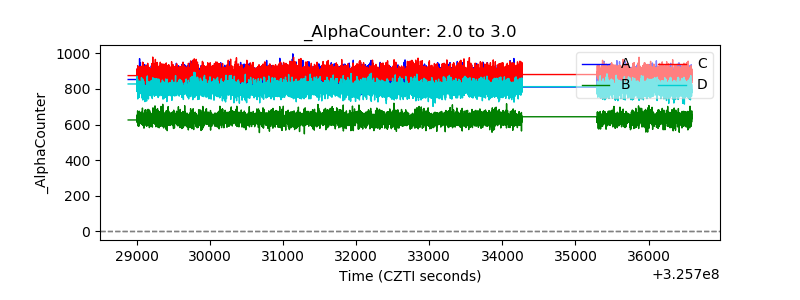 |
| _CPM_Rate | 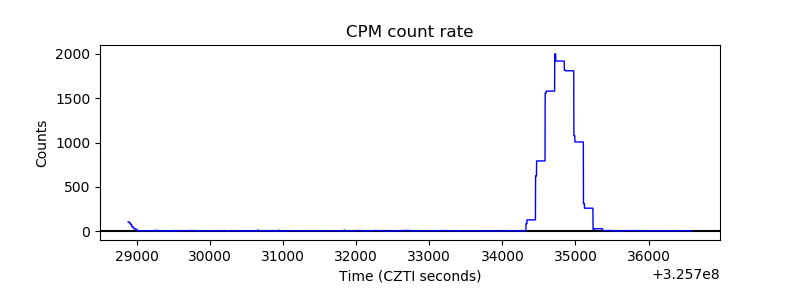 |
| CZT Counter | 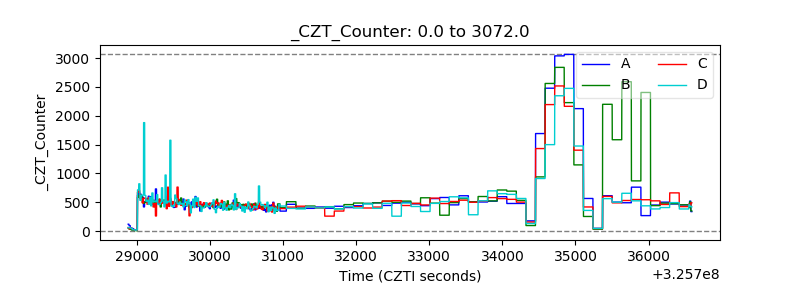 |
| +2.5 Volts monitor |  |
| +5 Volts monitor | 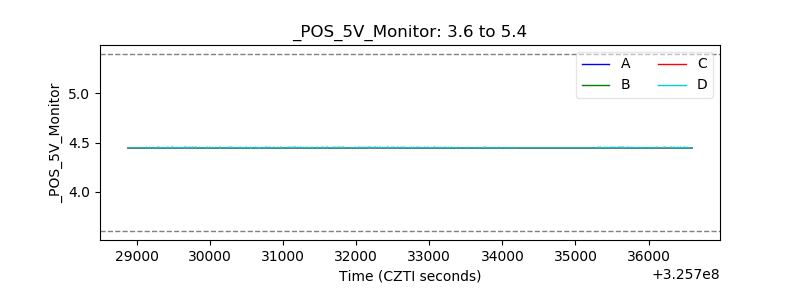 |
| _ROLL_ROT | 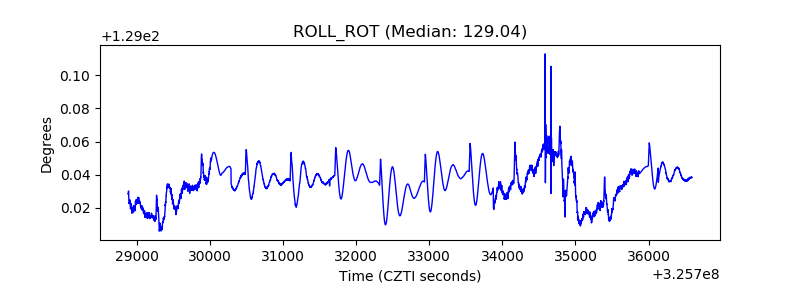 |
| _Roll_DEC | 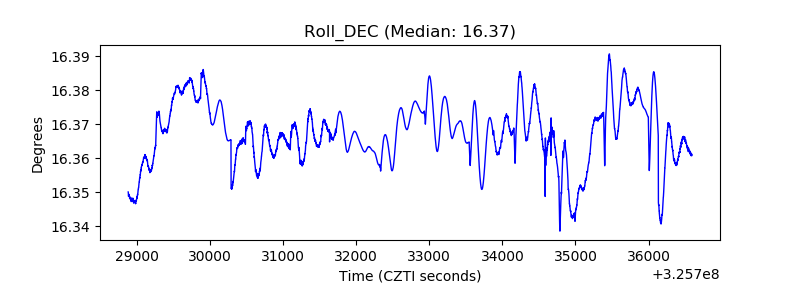 |
| _Roll_RA | 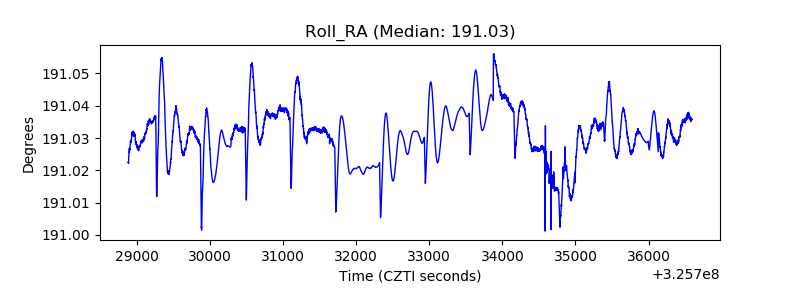 |
| Veto Counter | 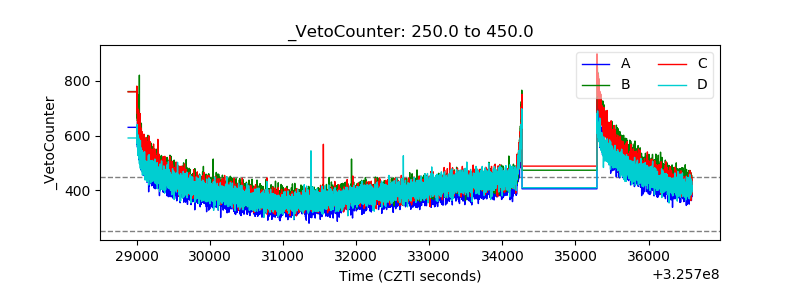 |