| Param | Original file | Final file |
|---|---|---|
| Filename | modeM0/AS1A07_147T01_9000003624_24779cztM0_level2.evt | modeM0/AS1A07_147T01_9000003624_24779cztM0_level2_quad_clean.evt |
| Size (bytes) | 487,088,640 | 74,721,600 |
| Size | 464.5 MB | 71.3 MB |
| Events in quadrant A | 3,328,123 | 467,836 |
| Events in quadrant B | 4,211,042 | 474,487 |
| Events in quadrant C | 3,329,445 | 445,815 |
| Events in quadrant D | 3,453,178 | 432,485 |
| Mode M0 | |||
|---|---|---|---|
| Quadrant | BADHDUFLAG | Total packets | Discarded packets |
| A | 0 | 13566 | 2 |
| B | 0 | 16349 | 2 |
| C | 0 | 13596 | 2 |
| D | 0 | 14187 | 2 |
| Mode SS | |||
|---|---|---|---|
| Quadrant | BADHDUFLAG | Total packets | Discarded packets |
| A | 0 | 128 | 0 |
| B | 0 | 128 | 0 |
| C | 0 | 128 | 0 |
| D | 0 | 128 | 0 |
| Mode M9 | |||
|---|---|---|---|
| Quadrant | BADHDUFLAG | Total packets | Discarded packets |
| A | 0 | 13 | 0 |
| B | 0 | 13 | 0 |
| C | 0 | 13 | 0 |
| D | 0 | 13 | 0 |
| Quadrant | Total seconds | Saturated seconds | Saturation percentage |
|---|---|---|---|
| A | 6334 | 29 | 0.457847% |
| B | 6335 | 267 | 4.214680% |
| C | 6335 | 50 | 0.789266% |
| D | 6335 | 47 | 0.741910% |
Noise dominated data is calculated using 1-second bins in cleaned event files. If a bin has >2000 counts, and if more than 50% of those come from <1% of pixels, then it is considered to be noise-dominated and hence unusable.
| Quadrant | # 1 sec bins | Bins with >0 counts | Bins with >2000 counts | High rate bins dominated by noise | Noise dominated (total time) | Noise dominated (detector-on time) | Marked lightcurve |
|---|---|---|---|---|---|---|---|
| A | 7584 | 6335 | 0 | 0 | 0.00% | 0.00% | 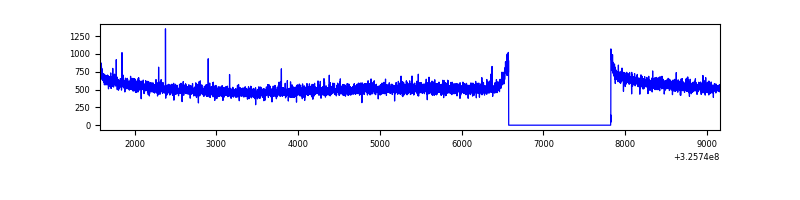 |
| B | 7585 | 6336 | 171 | 171 | 2.25% | 2.70% | 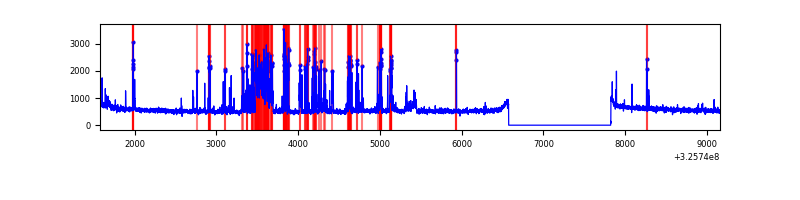 |
| C | 7585 | 6336 | 0 | 0 | 0.00% | 0.00% | 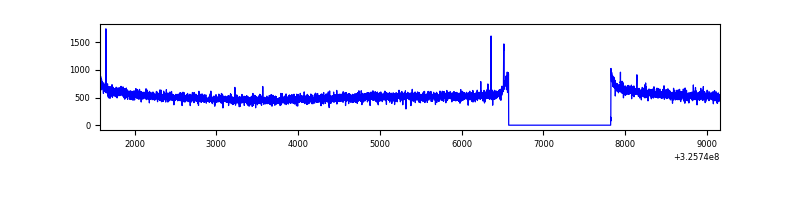 |
| D | 7585 | 6336 | 27 | 27 | 0.36% | 0.43% | 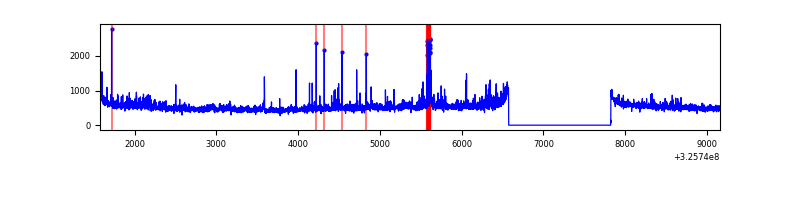 |
Top three noisy pixels from each quadrant. If the there are fewer than three noisy pixels in the level2.evt file, extra rows are filled as -1
| Pixel properties | Quadrant properties | ||||||
|---|---|---|---|---|---|---|---|
| Quadrant | DetID | PixID | Counts | Sigma | Mean | Median | Sigma |
| A | 13 | 254 | 8660 | 45.42 | 862 | 848 | 172.0 |
| A | 3 | 137 | 7481 | 38.57 | 862 | 848 | 172.0 |
| A | 0 | 226 | 7346 | 37.78 | 862 | 848 | 172.0 |
| B | 3 | 64 | 820655 | 5119.2 | 851 | 830 | 160.1 |
| B | 4 | 52 | 34316 | 209.1 | 851 | 830 | 160.1 |
| B | 12 | 111 | 19192 | 114.66 | 851 | 830 | 160.1 |
| C | 14 | 238 | 132936 | 696.3 | 815 | 824 | 189.7 |
| C | 10 | 218 | 11280 | 55.11 | 815 | 824 | 189.7 |
| C | 3 | 233 | 6622 | 30.56 | 815 | 824 | 189.7 |
| D | 1 | 52 | 202892 | 1013.07 | 820 | 795 | 199.5 |
| D | 8 | 195 | 133397 | 664.7 | 820 | 795 | 199.5 |
| D | 12 | 233 | 24870 | 120.68 | 820 | 795 | 199.5 |
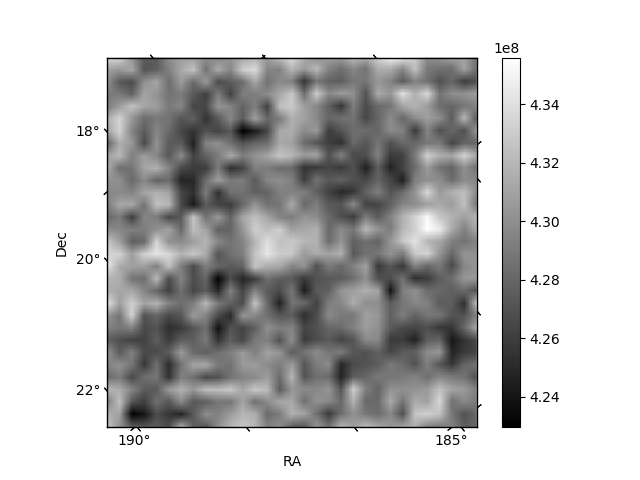
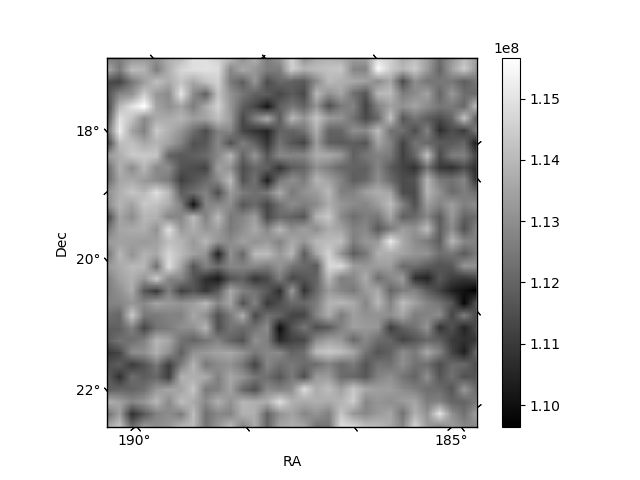
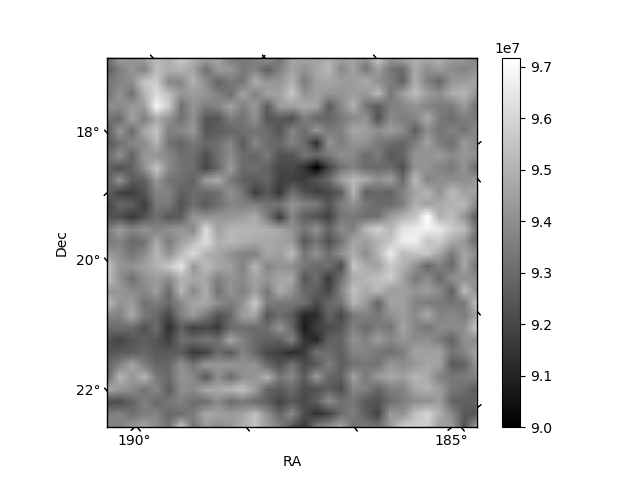
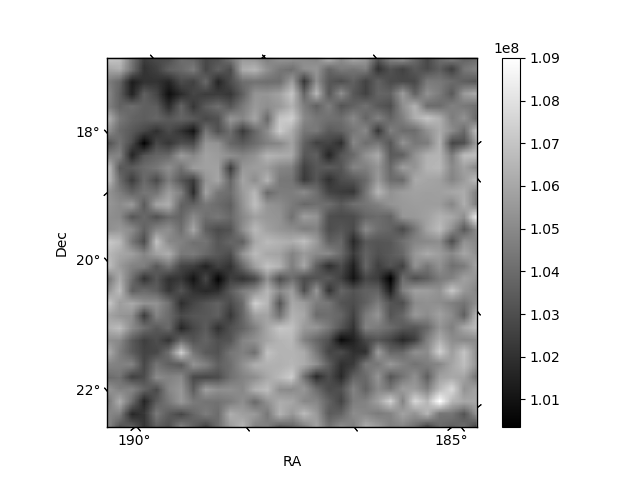
Histogram calculated using DETX and DETY for each event in the final _common_clean file
| Quadrant A | 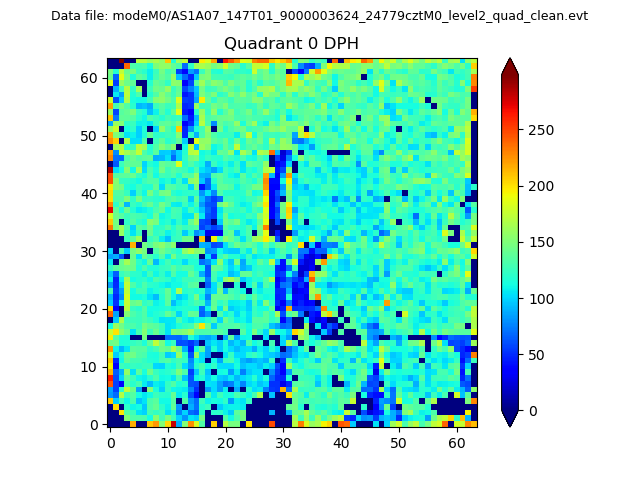 |
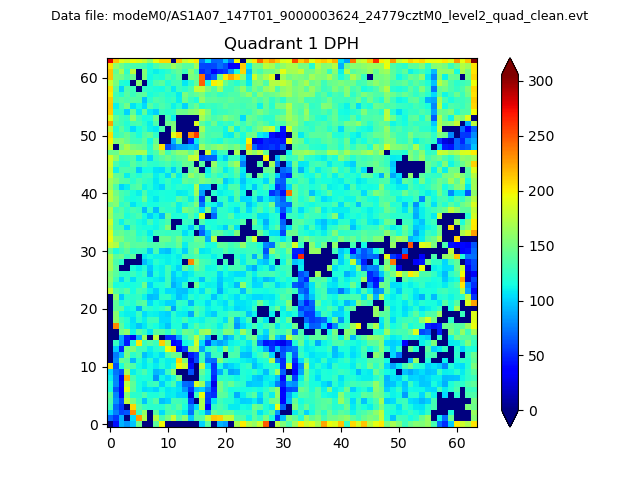 |
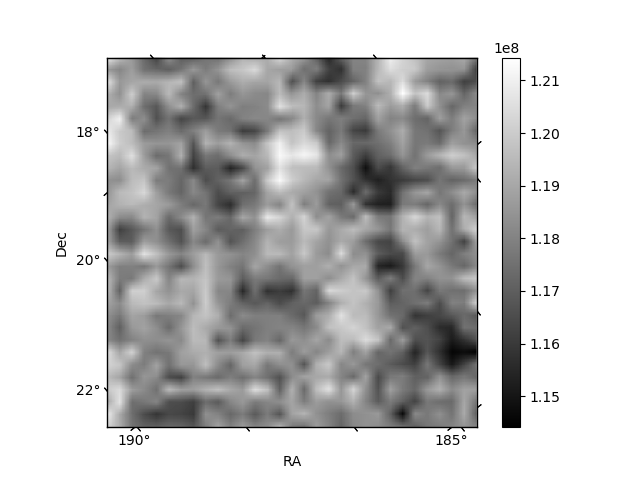
Quadrant B |
|---|---|---|---|
| Quadrant D | 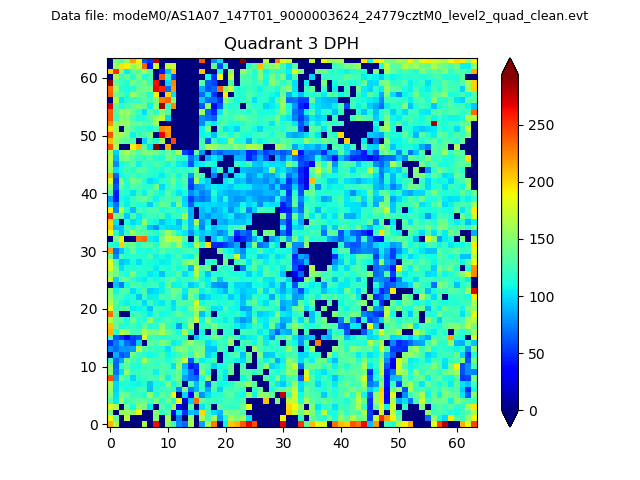 |
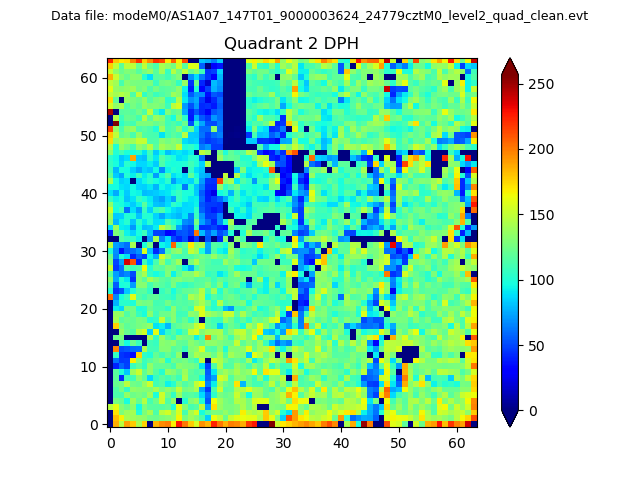 |
Quadrant C |
| Plot type | Count rate plots | Images |
|---|---|---|
| Comparison with Poisson distribution Blue bars denote a histogram of data divided into 1 sec bins. Red curve is a Poisson curve with rate = median count rate of data. |
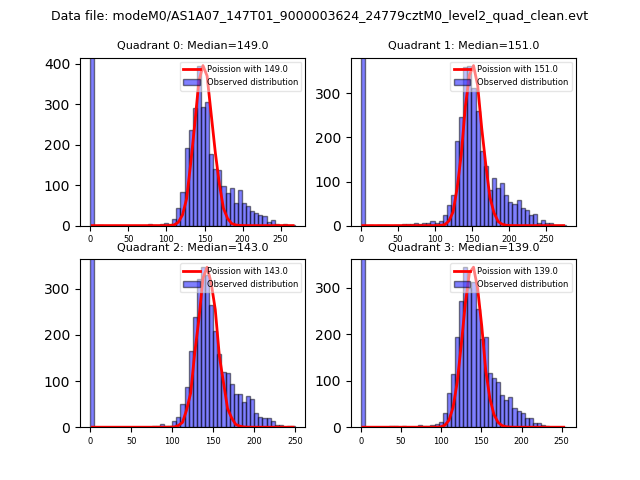 |
 |
| Quadrant-wise count rates Data is divided into 100 sec bins |
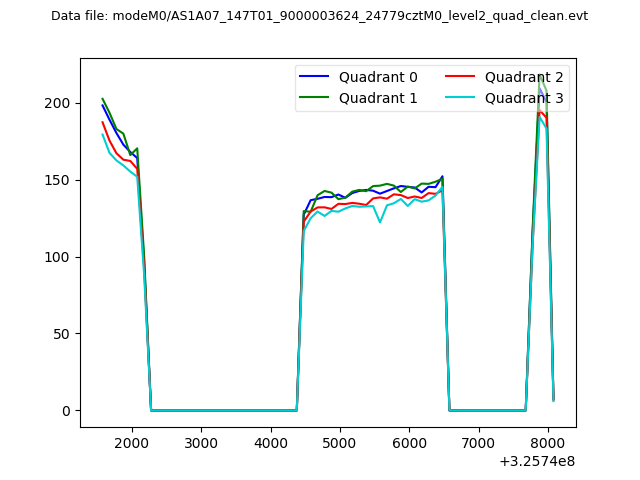 |
|
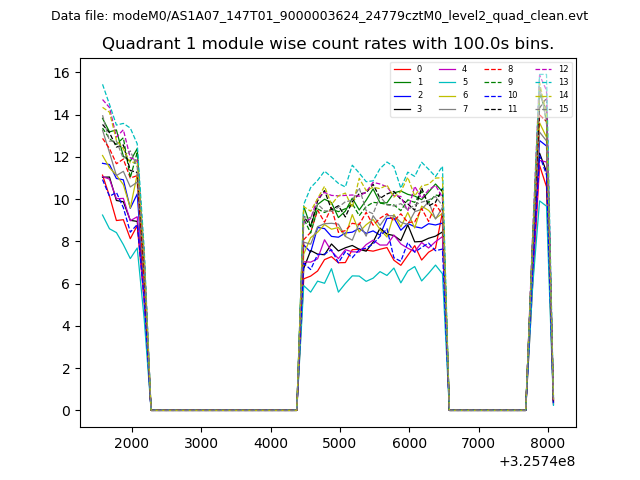
| Module-wise count rates for Quadrant A Data is divided into 100 sec bins |
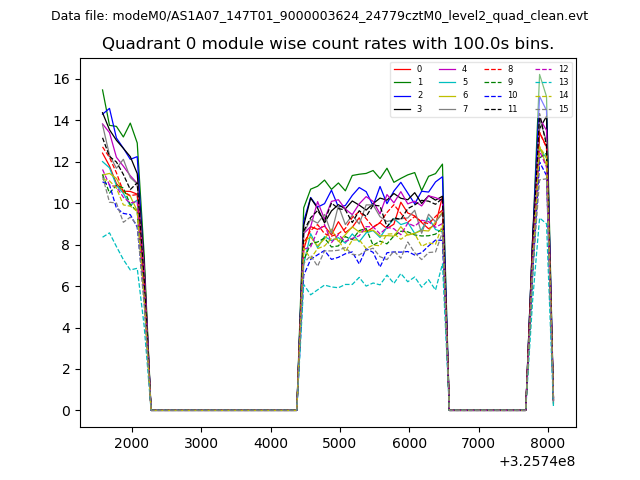 |
 |
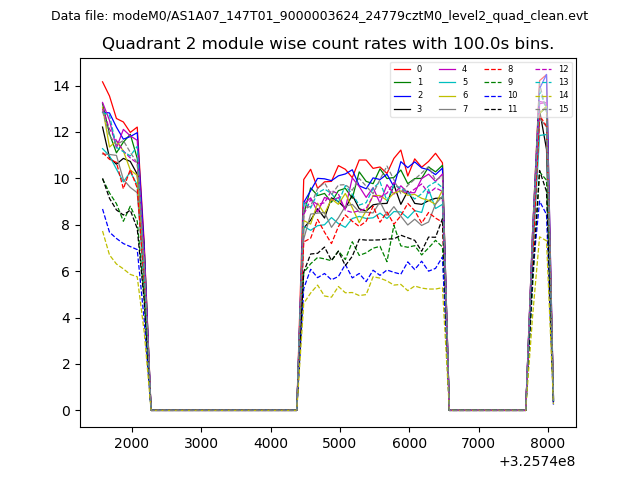
| Module-wise count rates for Quadrant B Data is divided into 100 sec bins |
 |
 |
| Module-wise count rates for Quadrant C Data is divided into 100 sec bins |
 |
 |
| Module-wise count rates for Quadrant D Data is divided into 100 sec bins |
 |
 |
| Parameter | Plot |
|---|---|
| CZT HV Monitor | 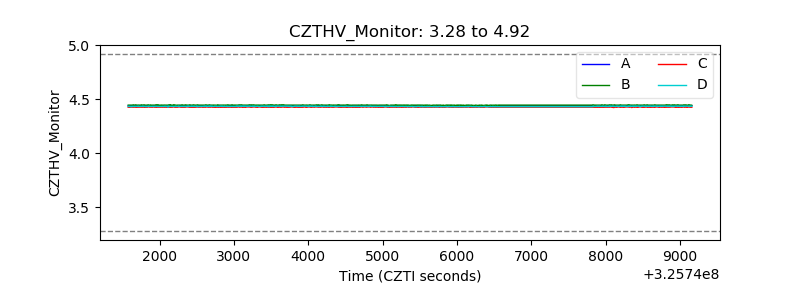 |
| D_VDD | 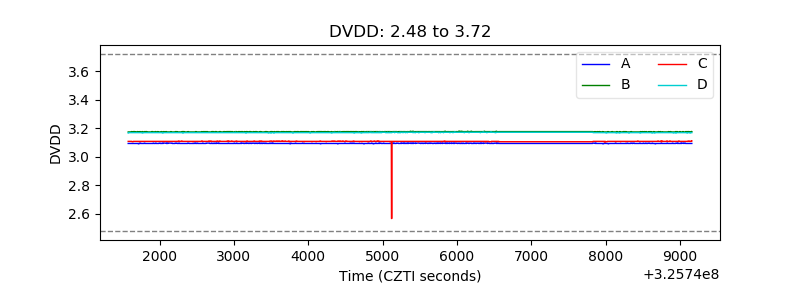 |
| Temperature 1 | 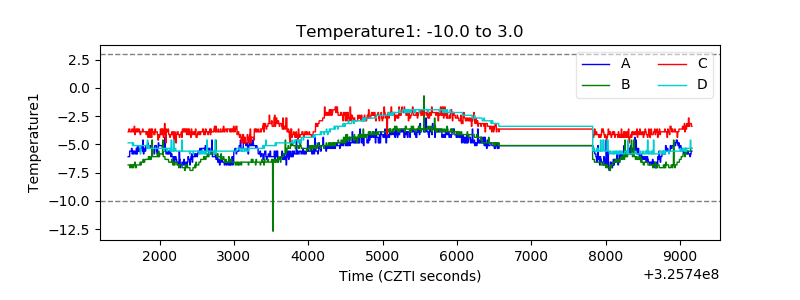 |
| Veto HV Monitor | 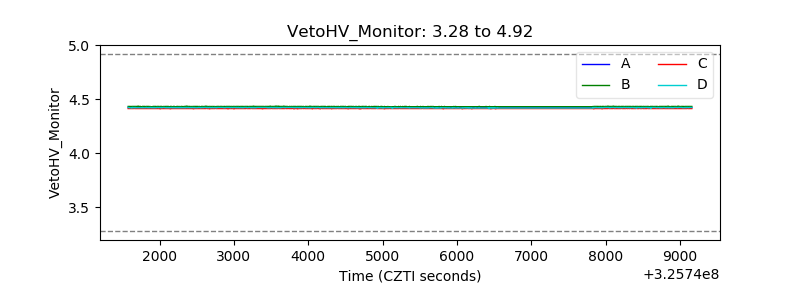 |
| Veto LLD | 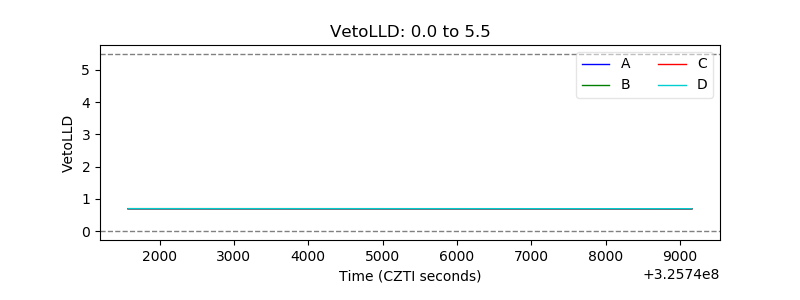 |
| Alpha Counter | 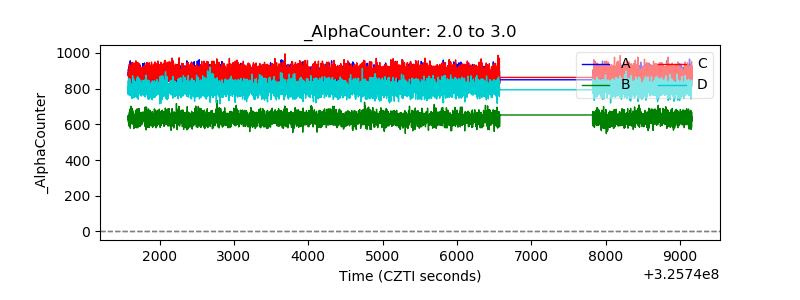 |
| _CPM_Rate | 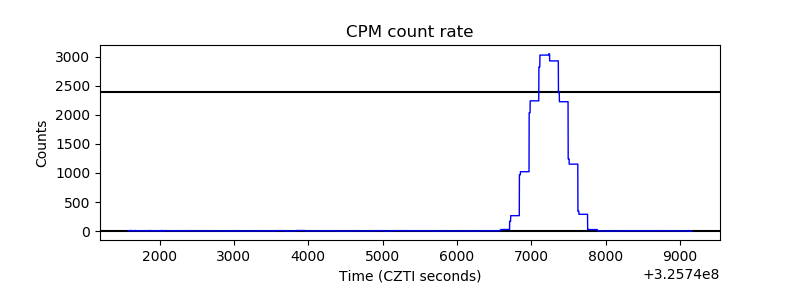 |
| CZT Counter | 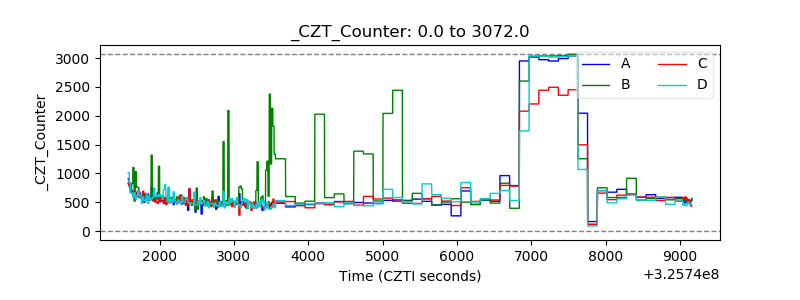 |
| +2.5 Volts monitor |  |
| +5 Volts monitor |  |
| _ROLL_ROT | 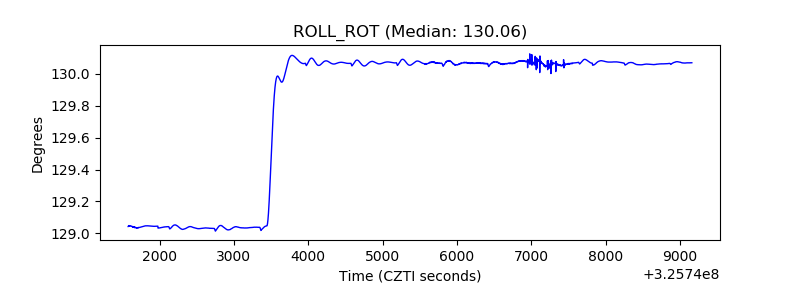 |
| _Roll_DEC | 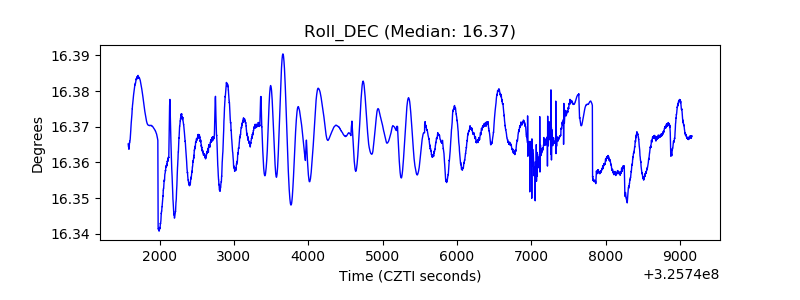 |
| _Roll_RA | 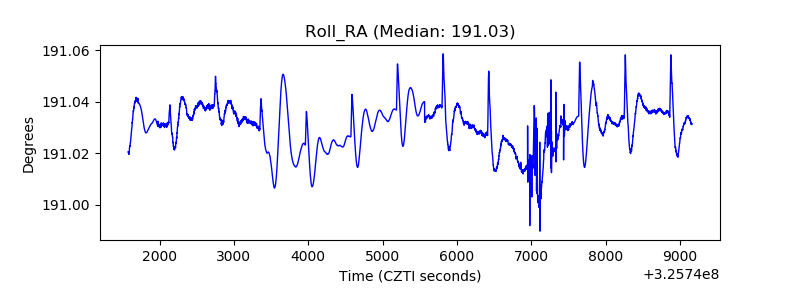 |
| Veto Counter |  |