| Param | Original file | Final file |
|---|---|---|
| Filename | modeM0/AS1A07_147T01_9000003624_24780cztM0_level2.evt | modeM0/AS1A07_147T01_9000003624_24780cztM0_level2_quad_clean.evt |
| Size (bytes) | 523,560,960 | 65,217,600 |
| Size | 499.3 MB | 62.2 MB |
| Events in quadrant A | 3,368,209 | 414,209 |
| Events in quadrant B | 5,075,435 | 360,103 |
| Events in quadrant C | 3,322,964 | 392,445 |
| Events in quadrant D | 3,675,070 | 380,820 |
| Mode M0 | |||
|---|---|---|---|
| Quadrant | BADHDUFLAG | Total packets | Discarded packets |
| A | 0 | 13535 | 2 |
| B | 0 | 18976 | 2 |
| C | 0 | 13398 | 2 |
| D | 0 | 14706 | 2 |
| Mode SS | |||
|---|---|---|---|
| Quadrant | BADHDUFLAG | Total packets | Discarded packets |
| A | 0 | 124 | 0 |
| B | 0 | 124 | 0 |
| C | 0 | 124 | 0 |
| D | 0 | 124 | 0 |
| Mode M9 | |||
|---|---|---|---|
| Quadrant | BADHDUFLAG | Total packets | Discarded packets |
| A | 0 | 15 | 0 |
| B | 0 | 16 | 0 |
| C | 0 | 16 | 0 |
| D | 0 | 16 | 0 |
| Quadrant | Total seconds | Saturated seconds | Saturation percentage |
|---|---|---|---|
| A | 6110 | 61 | 0.998363% |
| B | 6110 | 777 | 12.716858% |
| C | 6110 | 75 | 1.227496% |
| D | 6110 | 82 | 1.342062% |
Noise dominated data is calculated using 1-second bins in cleaned event files. If a bin has >2000 counts, and if more than 50% of those come from <1% of pixels, then it is considered to be noise-dominated and hence unusable.
| Quadrant | # 1 sec bins | Bins with >0 counts | Bins with >2000 counts | High rate bins dominated by noise | Noise dominated (total time) | Noise dominated (detector-on time) | Marked lightcurve |
|---|---|---|---|---|---|---|---|
| A | 7425 | 6110 | 0 | 0 | 0.00% | 0.00% | 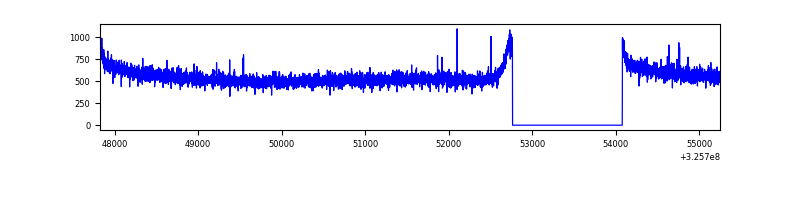 |
| B | 7425 | 6110 | 635 | 635 | 8.55% | 10.39% | 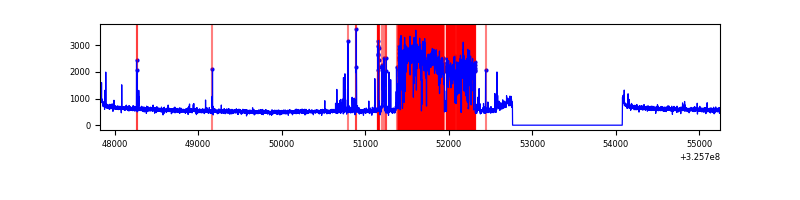 |
| C | 7425 | 6110 | 0 | 0 | 0.00% | 0.00% |  |
| D | 7425 | 6110 | 37 | 37 | 0.50% | 0.61% | 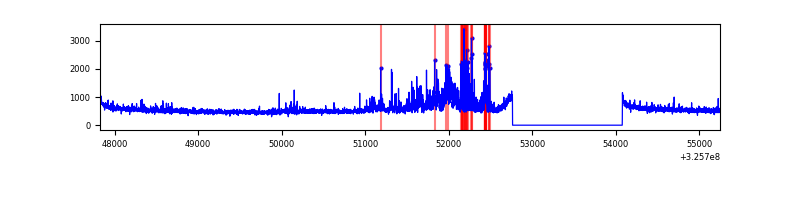 |
Top three noisy pixels from each quadrant. If the there are fewer than three noisy pixels in the level2.evt file, extra rows are filled as -1
| Pixel properties | Quadrant properties | ||||||
|---|---|---|---|---|---|---|---|
| Quadrant | DetID | PixID | Counts | Sigma | Mean | Median | Sigma |
| A | 13 | 254 | 8902 | 46.41 | 873 | 858 | 173.3 |
| A | 12 | 96 | 7935 | 40.83 | 873 | 858 | 173.3 |
| A | 0 | 226 | 7391 | 37.69 | 873 | 858 | 173.3 |
| B | 3 | 64 | 1832917 | 12004.1 | 820 | 803 | 152.6 |
| B | 12 | 111 | 18222 | 114.13 | 820 | 803 | 152.6 |
| B | 11 | 111 | 16560 | 103.24 | 820 | 803 | 152.6 |
| C | 14 | 238 | 132744 | 705.23 | 816 | 826 | 187.1 |
| C | 3 | 233 | 5982 | 27.56 | 816 | 826 | 187.1 |
| C | 13 | 61 | 5696 | 26.03 | 816 | 826 | 187.1 |
| D | 1 | 52 | 447642 | 2231.52 | 825 | 804 | 200.2 |
| D | 8 | 195 | 124226 | 616.37 | 825 | 804 | 200.2 |
| D | 2 | 234 | 21791 | 104.81 | 825 | 804 | 200.2 |
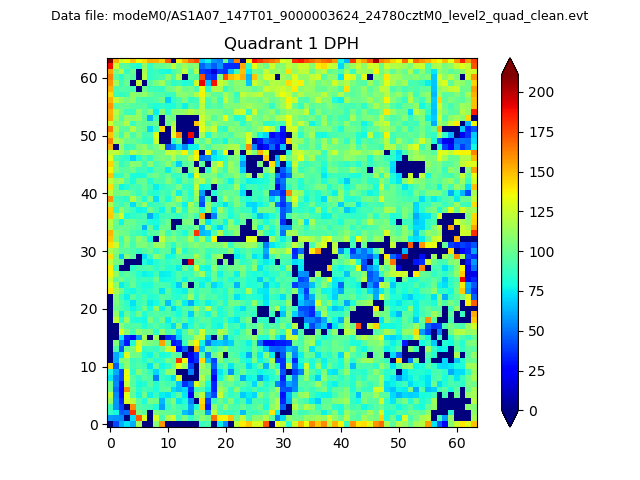
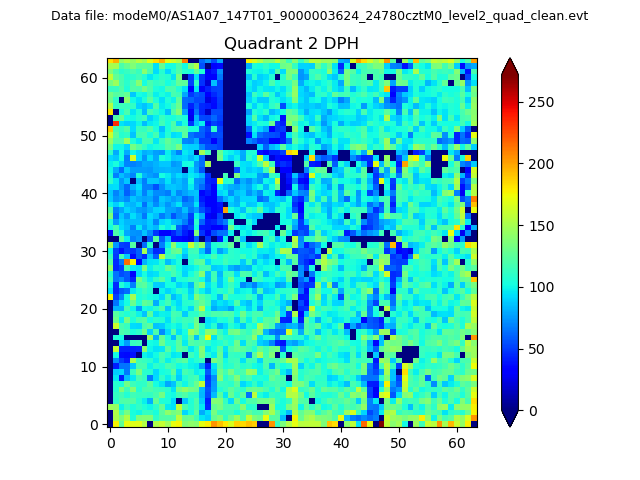
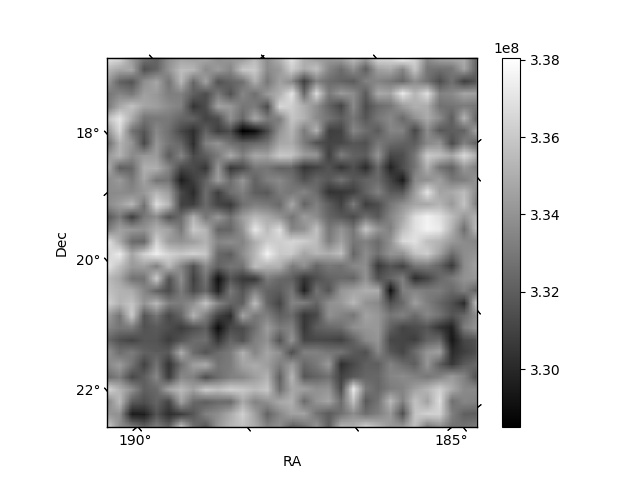
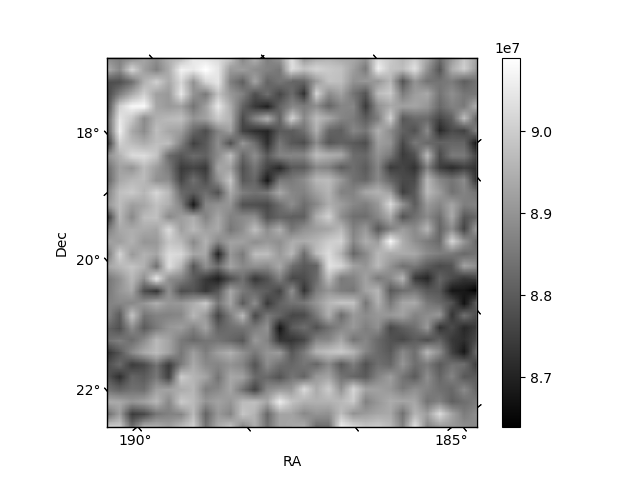
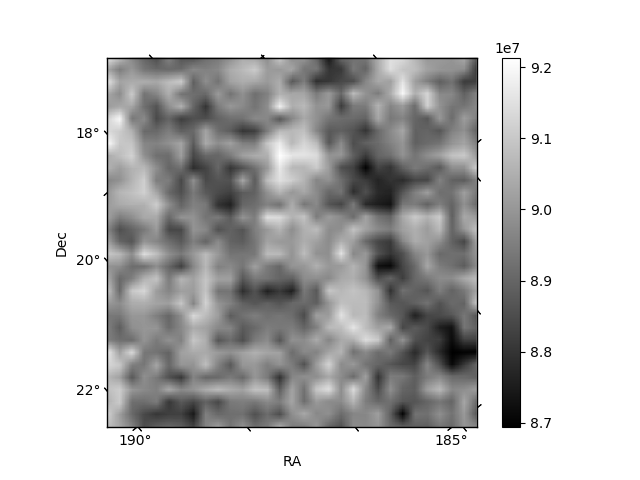
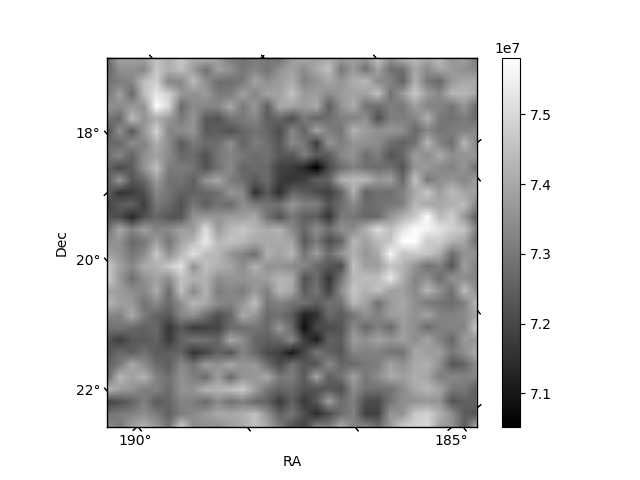
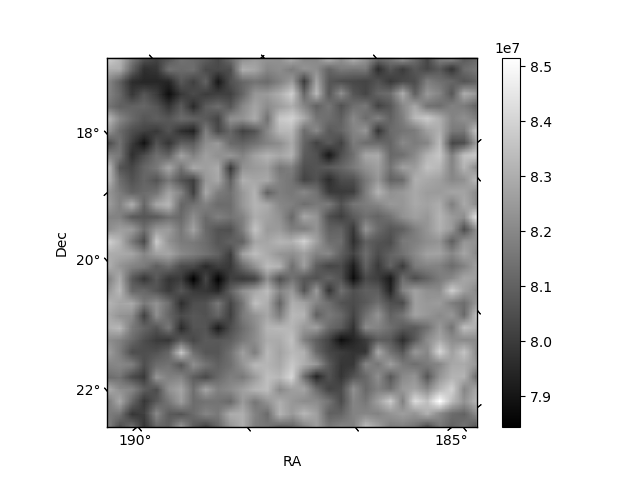
Histogram calculated using DETX and DETY for each event in the final _common_clean file
| Quadrant A | 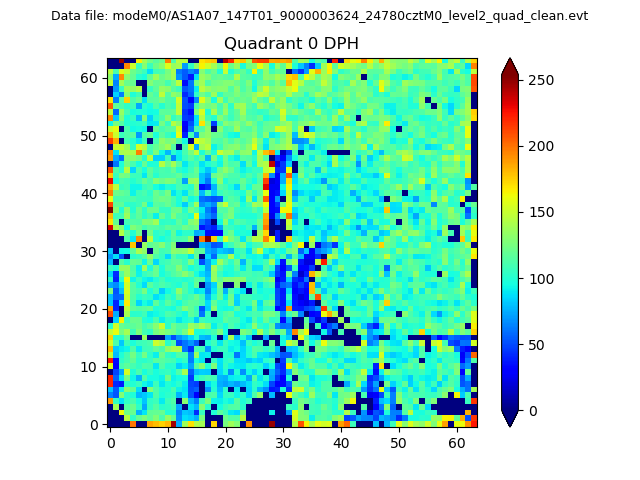 |
 |
Quadrant B |
|---|---|---|---|
| Quadrant D | 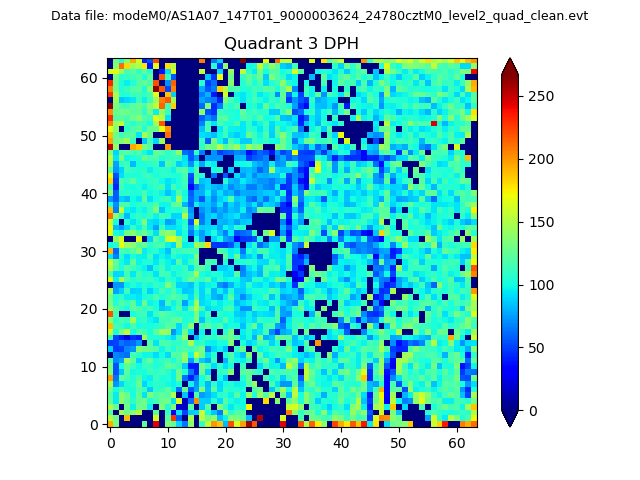 |
 |
Quadrant C |
| Plot type | Count rate plots | Images |
|---|---|---|
| Comparison with Poisson distribution Blue bars denote a histogram of data divided into 1 sec bins. Red curve is a Poisson curve with rate = median count rate of data. |
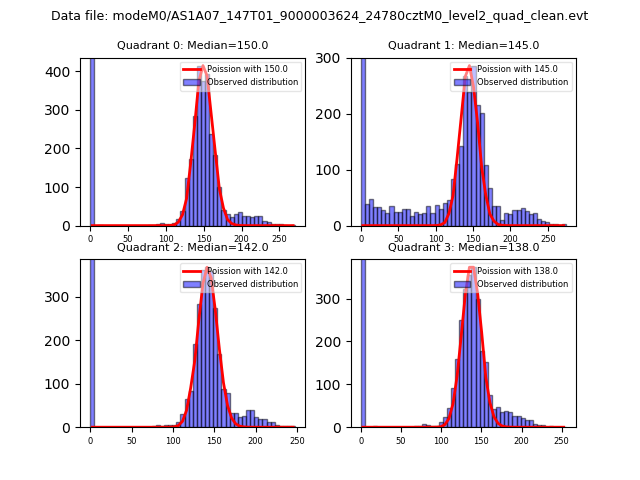 |
 |
| Quadrant-wise count rates Data is divided into 100 sec bins |
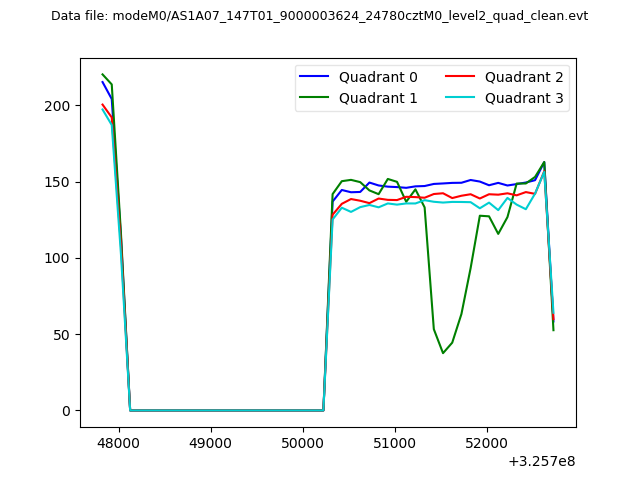 |
|
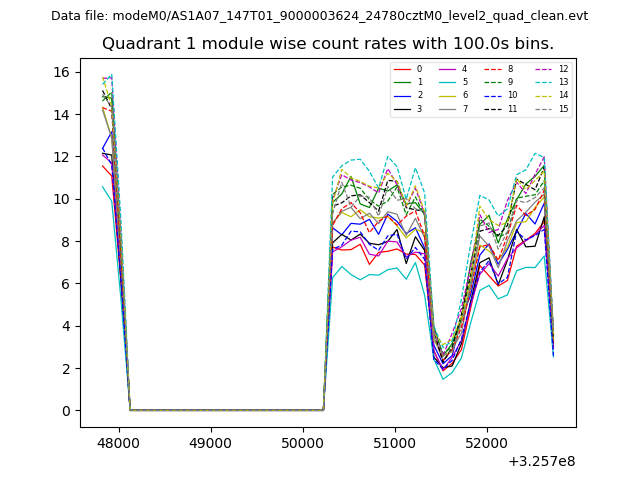
| Module-wise count rates for Quadrant A Data is divided into 100 sec bins |
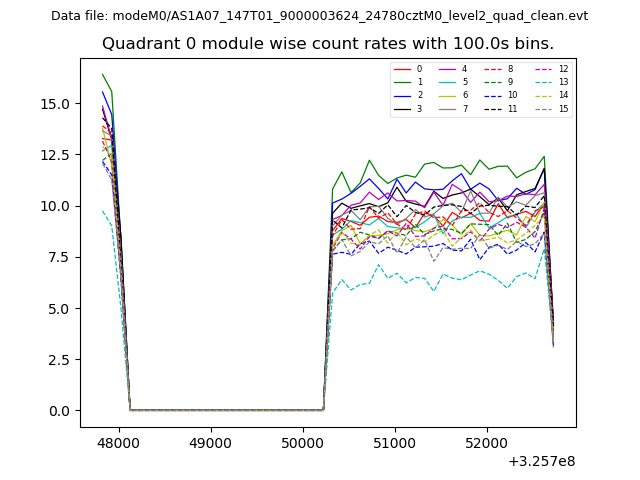 |
 |
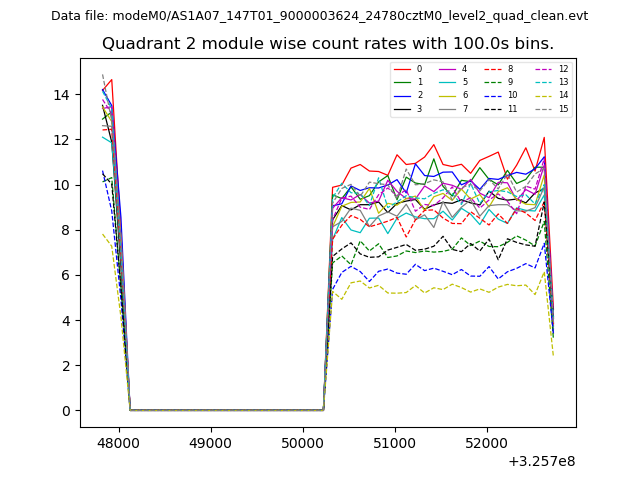
| Module-wise count rates for Quadrant B Data is divided into 100 sec bins |
 |
 |
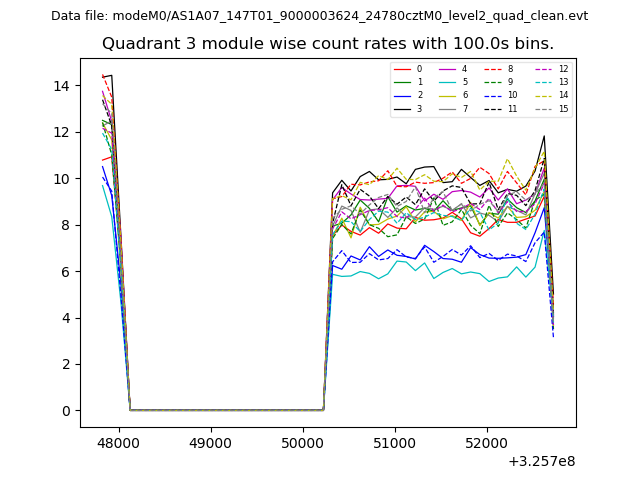
| Module-wise count rates for Quadrant C Data is divided into 100 sec bins |
 |
 |
| Module-wise count rates for Quadrant D Data is divided into 100 sec bins |
 |
 |
| Parameter | Plot |
|---|---|
| CZT HV Monitor | 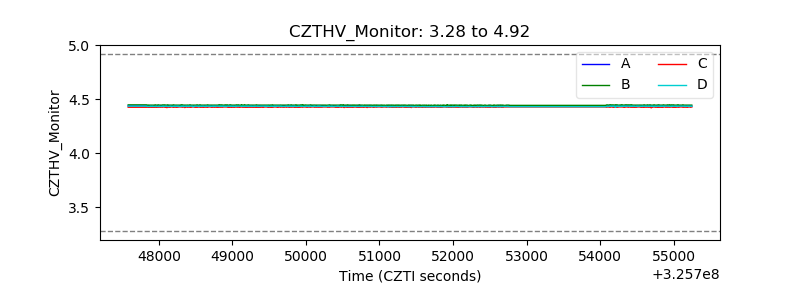 |
| D_VDD | 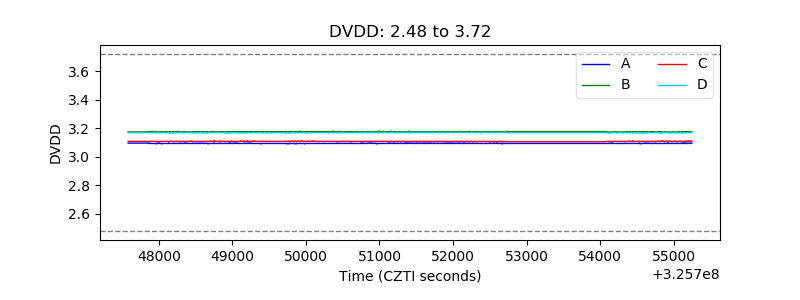 |
| Temperature 1 | 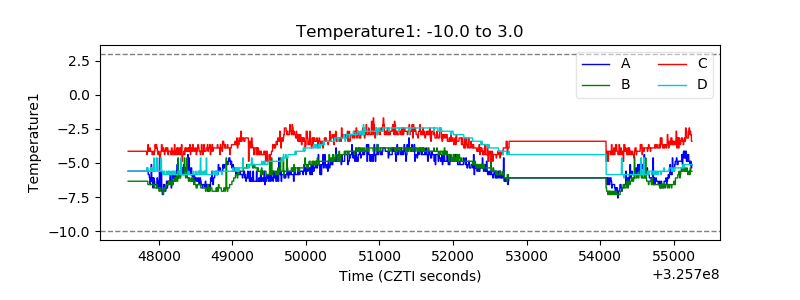 |
| Veto HV Monitor | 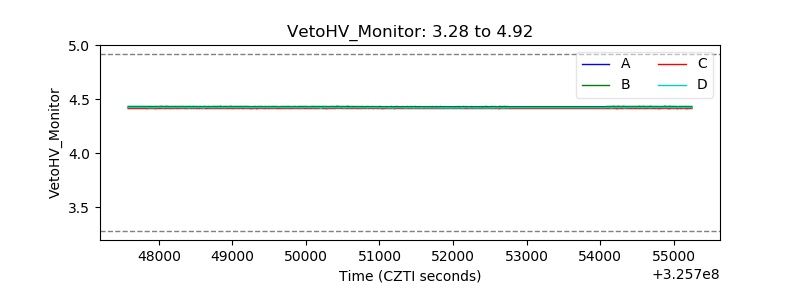 |
| Veto LLD | 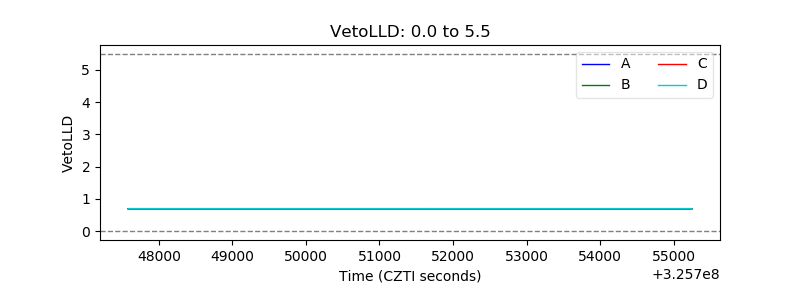 |
| Alpha Counter | 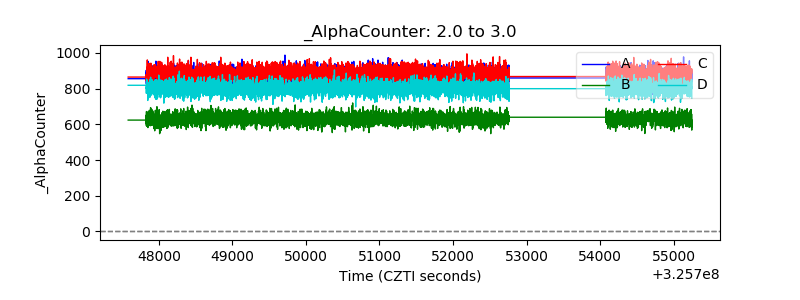 |
| _CPM_Rate | 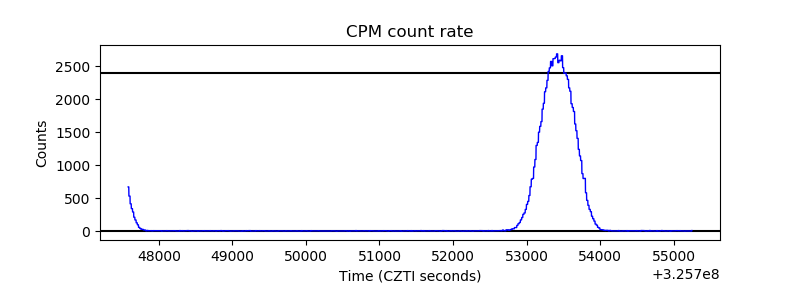 |
| CZT Counter | 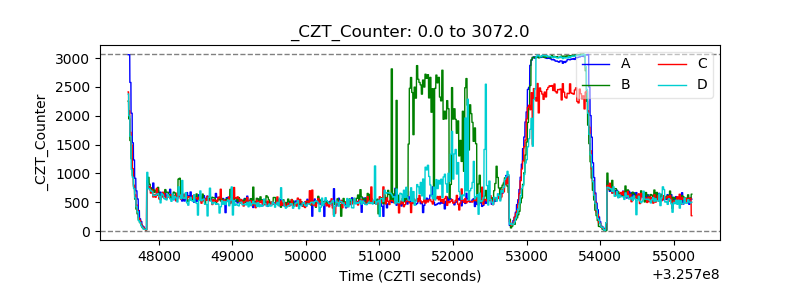 |
| +2.5 Volts monitor |  |
| +5 Volts monitor |  |
| _ROLL_ROT | 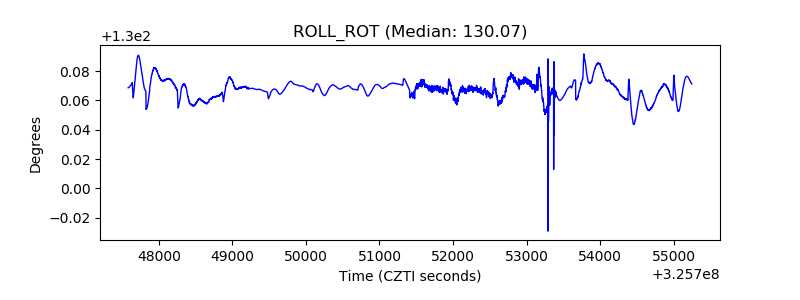 |
| _Roll_DEC | 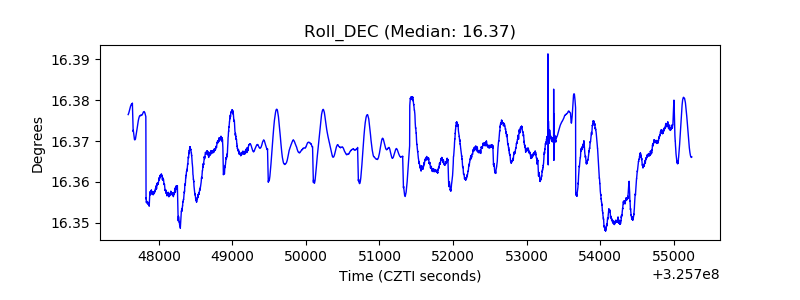 |
| _Roll_RA | 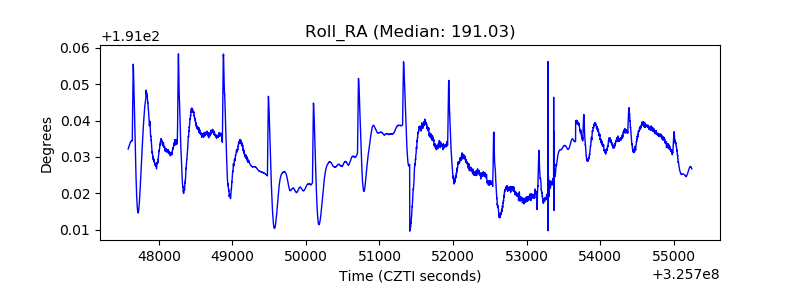 |
| Veto Counter | 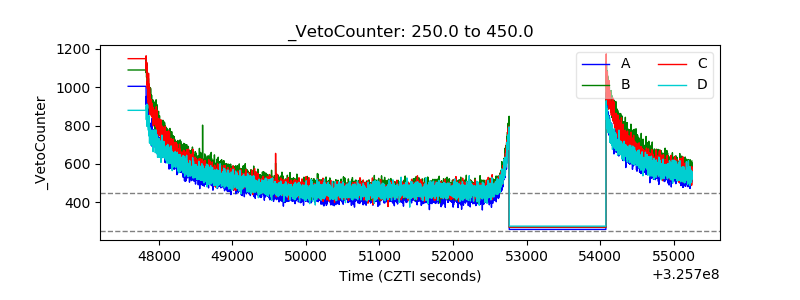 |