| Param | Original file | Final file |
|---|---|---|
| Filename | modeM0/AS1A07_147T01_9000003624_24781cztM0_level2.evt | modeM0/AS1A07_147T01_9000003624_24781cztM0_level2_quad_clean.evt |
| Size (bytes) | 519,975,360 | 67,478,400 |
| Size | 495.9 MB | 64.4 MB |
| Events in quadrant A | 3,479,293 | 429,393 |
| Events in quadrant B | 4,600,183 | 380,197 |
| Events in quadrant C | 3,429,881 | 403,357 |
| Events in quadrant D | 3,815,199 | 394,549 |
| Mode M0 | |||
|---|---|---|---|
| Quadrant | BADHDUFLAG | Total packets | Discarded packets |
| A | 0 | 13929 | 2 |
| B | 0 | 17484 | 3 |
| C | 0 | 13710 | 2 |
| D | 0 | 15160 | 2 |
| Mode SS | |||
|---|---|---|---|
| Quadrant | BADHDUFLAG | Total packets | Discarded packets |
| A | 0 | 128 | 0 |
| B | 0 | 128 | 0 |
| C | 0 | 128 | 0 |
| D | 0 | 128 | 0 |
| Mode M9 | |||
|---|---|---|---|
| Quadrant | BADHDUFLAG | Total packets | Discarded packets |
| A | 0 | 14 | 0 |
| B | 0 | 15 | 0 |
| C | 0 | 15 | 0 |
| D | 0 | 15 | 0 |
| Quadrant | Total seconds | Saturated seconds | Saturation percentage |
|---|---|---|---|
| A | 6234 | 91 | 1.459737% |
| B | 6233 | 570 | 9.144874% |
| C | 6233 | 108 | 1.732713% |
| D | 6233 | 109 | 1.748757% |
Noise dominated data is calculated using 1-second bins in cleaned event files. If a bin has >2000 counts, and if more than 50% of those come from <1% of pixels, then it is considered to be noise-dominated and hence unusable.
| Quadrant | # 1 sec bins | Bins with >0 counts | Bins with >2000 counts | High rate bins dominated by noise | Noise dominated (total time) | Noise dominated (detector-on time) | Marked lightcurve |
|---|---|---|---|---|---|---|---|
| A | 7533 | 6234 | 0 | 0 | 0.00% | 0.00% | 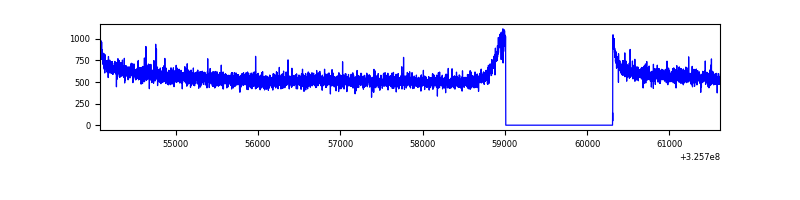 |
| B | 7532 | 6233 | 444 | 444 | 5.89% | 7.12% | 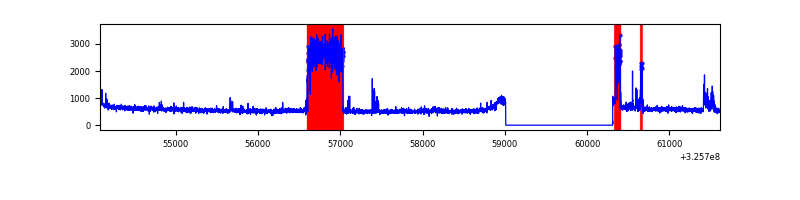 |
| C | 7532 | 6233 | 0 | 0 | 0.00% | 0.00% |  |
| D | 7532 | 6233 | 36 | 36 | 0.48% | 0.58% | 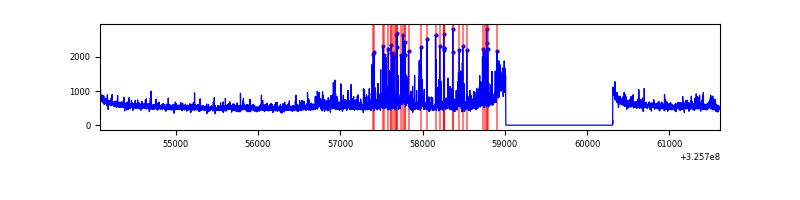 |
Top three noisy pixels from each quadrant. If the there are fewer than three noisy pixels in the level2.evt file, extra rows are filled as -1
| Pixel properties | Quadrant properties | ||||||
|---|---|---|---|---|---|---|---|
| Quadrant | DetID | PixID | Counts | Sigma | Mean | Median | Sigma |
| A | 13 | 254 | 9470 | 47.82 | 901 | 888 | 179.5 |
| A | 0 | 226 | 7734 | 38.15 | 901 | 888 | 179.5 |
| A | 3 | 137 | 7624 | 37.53 | 901 | 888 | 179.5 |
| B | 3 | 64 | 1309505 | 8293.62 | 840 | 823 | 157.8 |
| B | 12 | 111 | 18861 | 114.31 | 840 | 823 | 157.8 |
| B | 11 | 111 | 17301 | 104.43 | 840 | 823 | 157.8 |
| C | 14 | 238 | 136310 | 702.01 | 840 | 852 | 193.0 |
| C | 1 | 16 | 9849 | 46.63 | 840 | 852 | 193.0 |
| C | 13 | 61 | 5974 | 26.54 | 840 | 852 | 193.0 |
| D | 8 | 195 | 343231 | 1659.0 | 849 | 825 | 206.4 |
| D | 1 | 52 | 255309 | 1233.01 | 849 | 825 | 206.4 |
| D | 2 | 234 | 22470 | 104.87 | 849 | 825 | 206.4 |
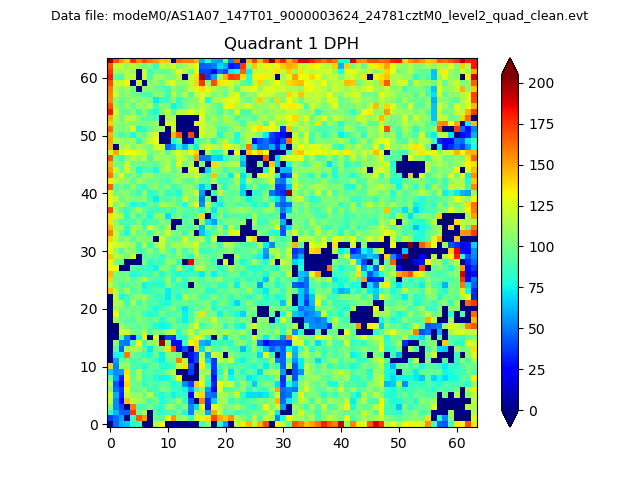
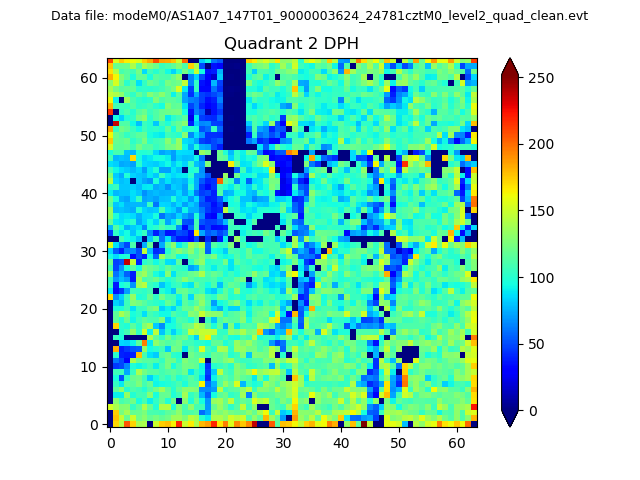
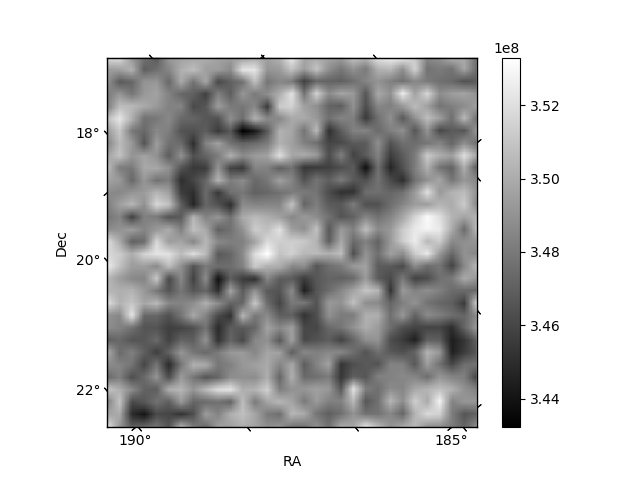
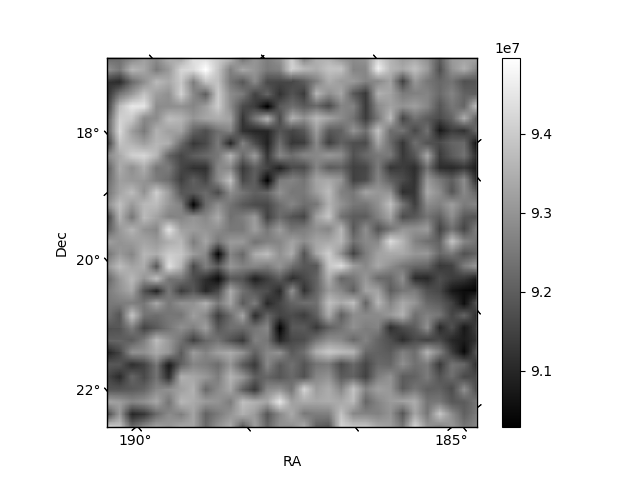
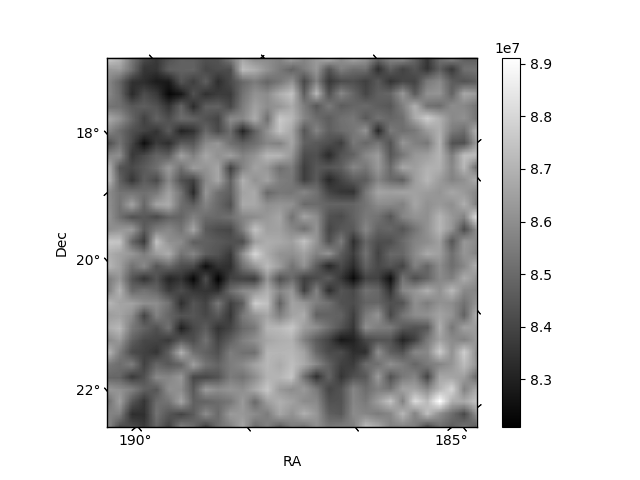
Histogram calculated using DETX and DETY for each event in the final _common_clean file
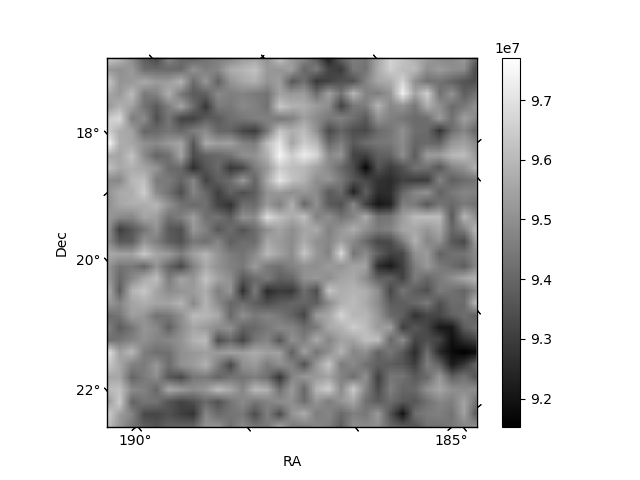
| Quadrant A | 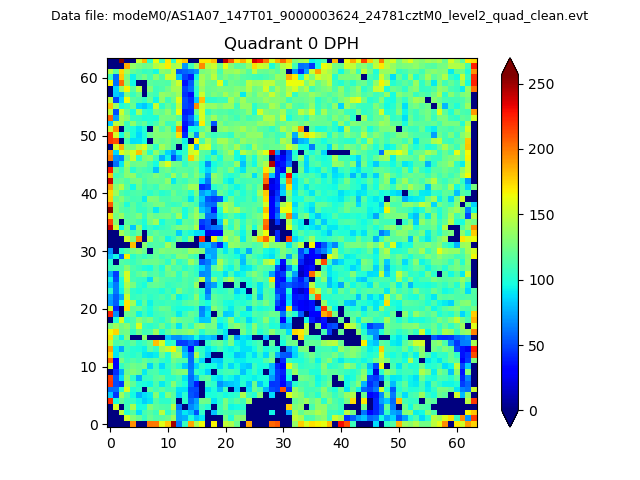 |
 |
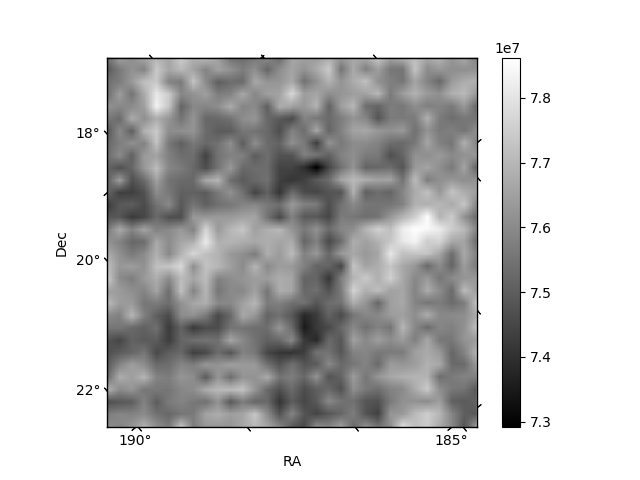
Quadrant B |
|---|---|---|---|
| Quadrant D | 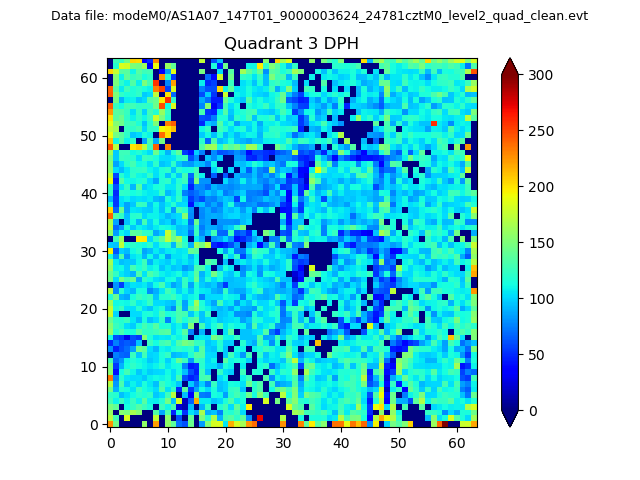 |
 |
Quadrant C |
| Plot type | Count rate plots | Images |
|---|---|---|
| Comparison with Poisson distribution Blue bars denote a histogram of data divided into 1 sec bins. Red curve is a Poisson curve with rate = median count rate of data. |
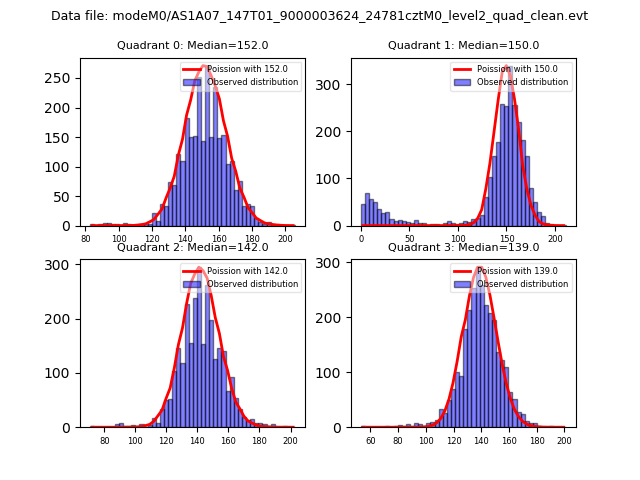 |
 |
| Quadrant-wise count rates Data is divided into 100 sec bins |
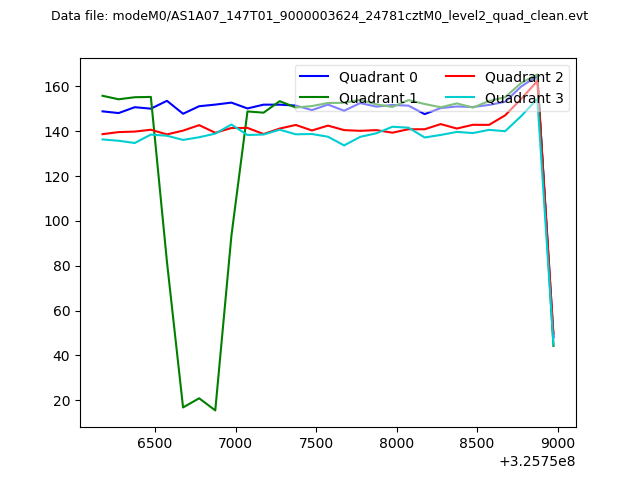 |
|
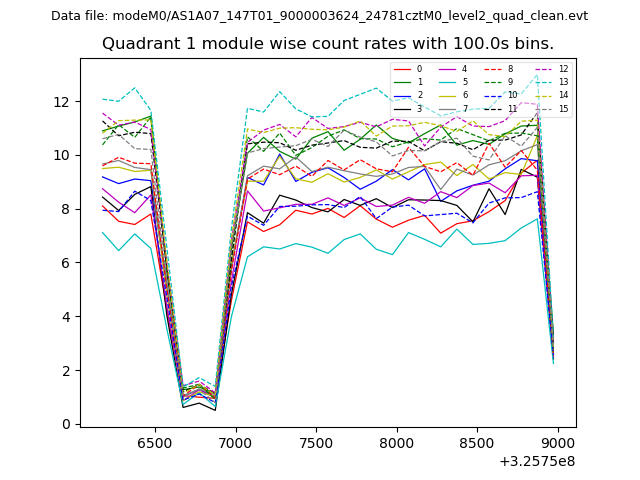
| Module-wise count rates for Quadrant A Data is divided into 100 sec bins |
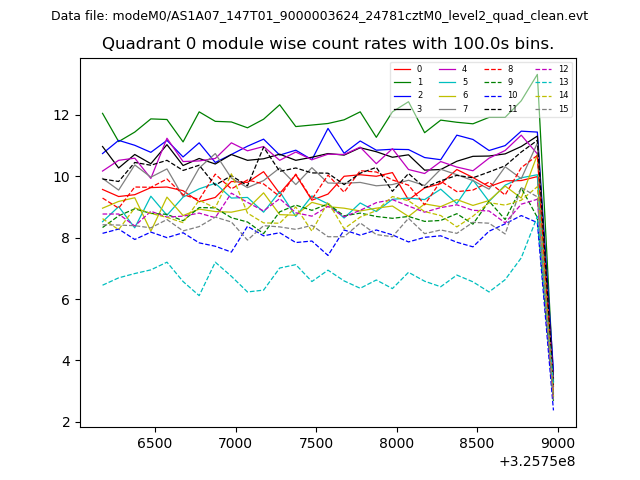 |
 |
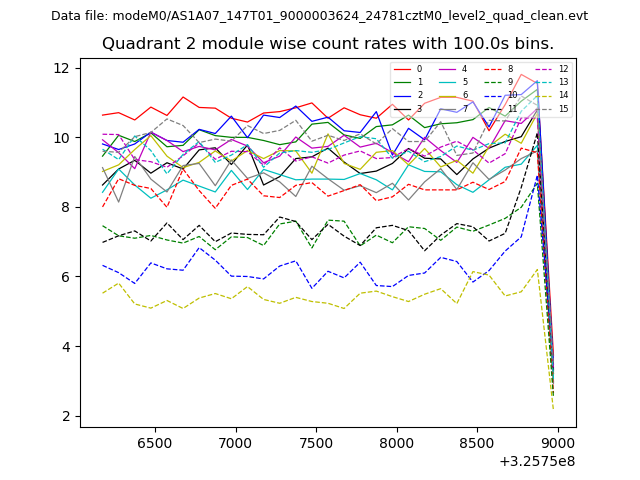
| Module-wise count rates for Quadrant B Data is divided into 100 sec bins |
 |
 |
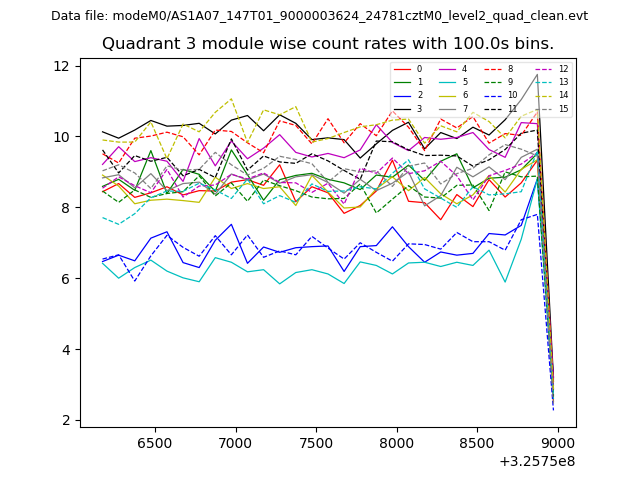
| Module-wise count rates for Quadrant C Data is divided into 100 sec bins |
 |
 |
| Module-wise count rates for Quadrant D Data is divided into 100 sec bins |
 |
 |
| Parameter | Plot |
|---|---|
| CZT HV Monitor | 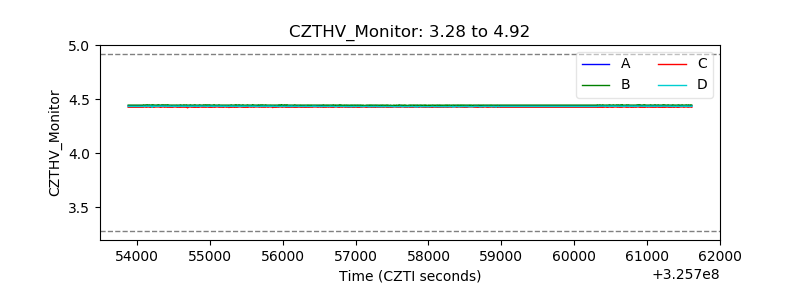 |
| D_VDD | 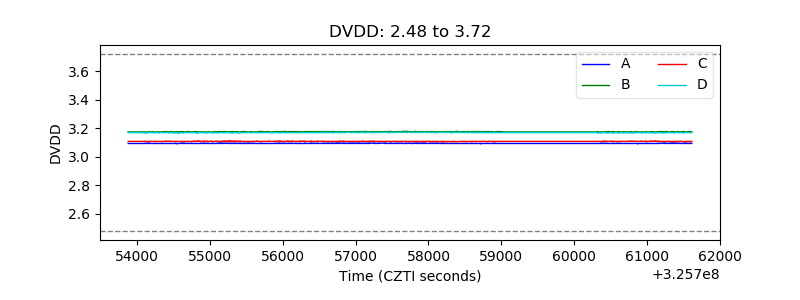 |
| Temperature 1 | 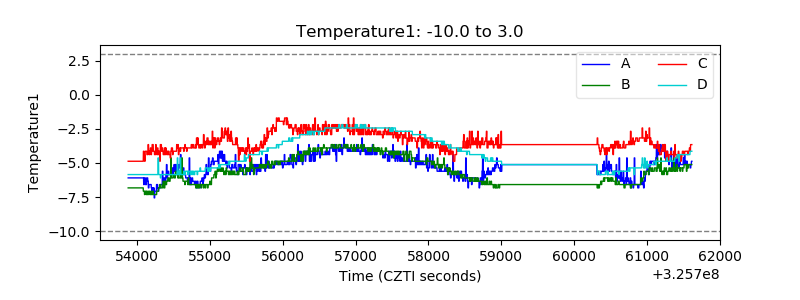 |
| Veto HV Monitor |  |
| Veto LLD | 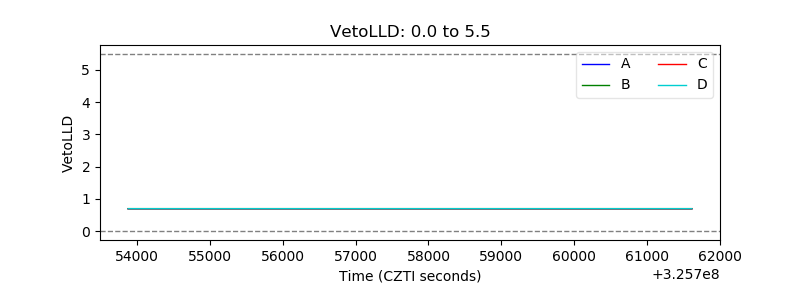 |
| Alpha Counter | 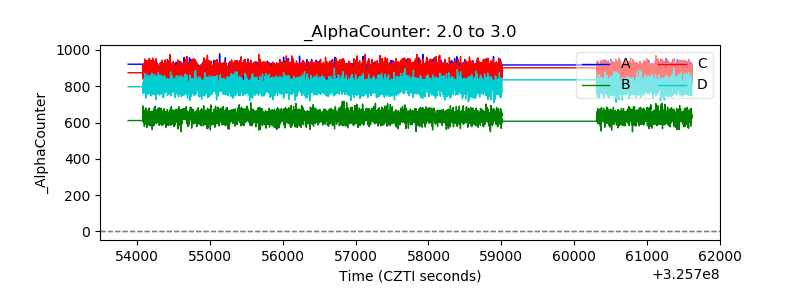 |
| _CPM_Rate | 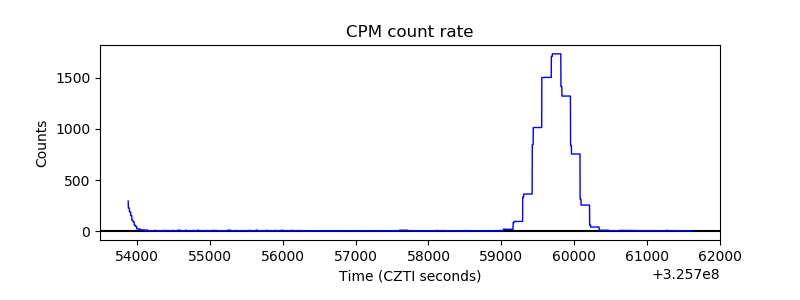 |
| CZT Counter | 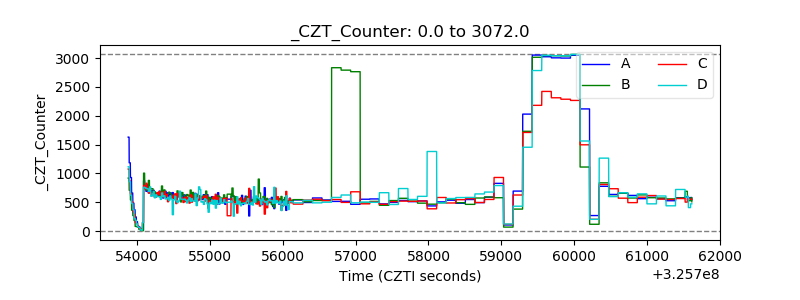 |
| +2.5 Volts monitor |  |
| +5 Volts monitor |  |
| _ROLL_ROT | 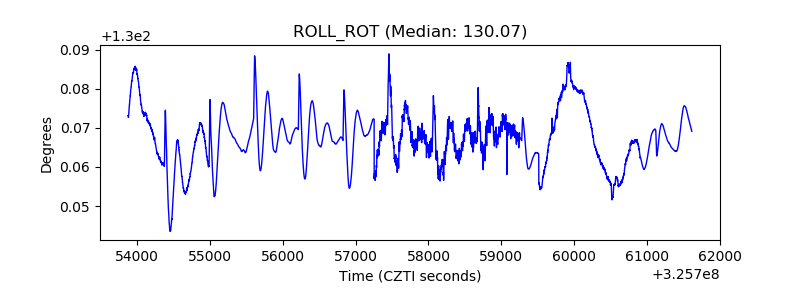 |
| _Roll_DEC |  |
| _Roll_RA | 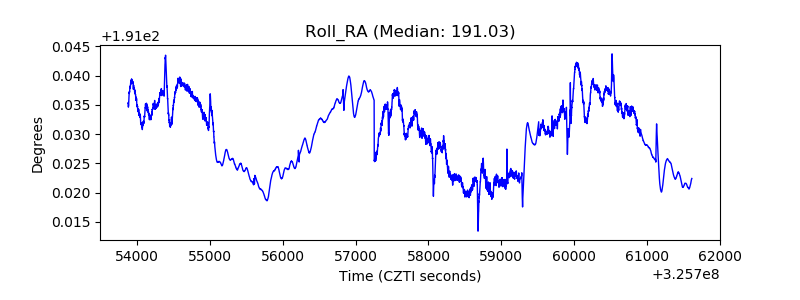 |
| Veto Counter | 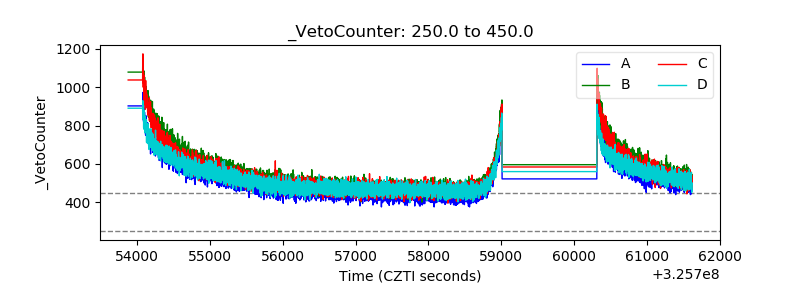 |