| Param | Original file | Final file |
|---|---|---|
| Filename | modeM0/AS1A07_147T01_9000003624_24783cztM0_level2.evt | modeM0/AS1A07_147T01_9000003624_24783cztM0_level2_quad_clean.evt |
| Size (bytes) | 555,125,760 | 93,260,160 |
| Size | 529.4 MB | 88.9 MB |
| Events in quadrant A | 3,594,274 | 608,091 |
| Events in quadrant B | 5,128,921 | 586,121 |
| Events in quadrant C | 3,748,451 | 573,750 |
| Events in quadrant D | 3,866,371 | 569,672 |
| Mode M0 | |||
|---|---|---|---|
| Quadrant | BADHDUFLAG | Total packets | Discarded packets |
| A | 0 | 14654 | 2 |
| B | 0 | 19539 | 2 |
| C | 0 | 15132 | 2 |
| D | 0 | 15637 | 2 |
| Mode SS | |||
|---|---|---|---|
| Quadrant | BADHDUFLAG | Total packets | Discarded packets |
| A | 0 | 144 | 0 |
| B | 0 | 144 | 0 |
| C | 0 | 144 | 0 |
| D | 0 | 144 | 0 |
| Mode M9 | |||
|---|---|---|---|
| Quadrant | BADHDUFLAG | Total packets | Discarded packets |
| A | 0 | 21 | 0 |
| B | 0 | 21 | 0 |
| C | 0 | 21 | 0 |
| D | 0 | 21 | 0 |
| Quadrant | Total seconds | Saturated seconds | Saturation percentage |
|---|---|---|---|
| A | 6984 | 161 | 2.305269% |
| B | 6984 | 709 | 10.151775% |
| C | 6985 | 211 | 3.020759% |
| D | 6985 | 133 | 1.904080% |
Noise dominated data is calculated using 1-second bins in cleaned event files. If a bin has >2000 counts, and if more than 50% of those come from <1% of pixels, then it is considered to be noise-dominated and hence unusable.
| Quadrant | # 1 sec bins | Bins with >0 counts | Bins with >2000 counts | High rate bins dominated by noise | Noise dominated (total time) | Noise dominated (detector-on time) | Marked lightcurve |
|---|---|---|---|---|---|---|---|
| A | 9099 | 6987 | 0 | 0 | 0.00% | 0.00% | 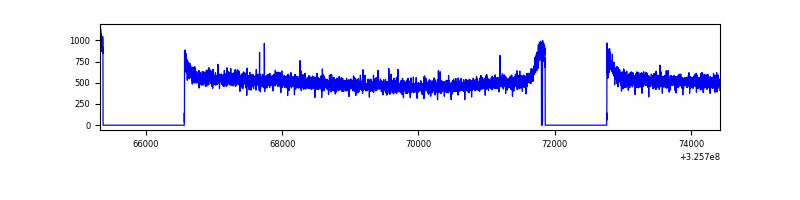 |
| B | 9099 | 6987 | 349 | 349 | 3.84% | 4.99% | 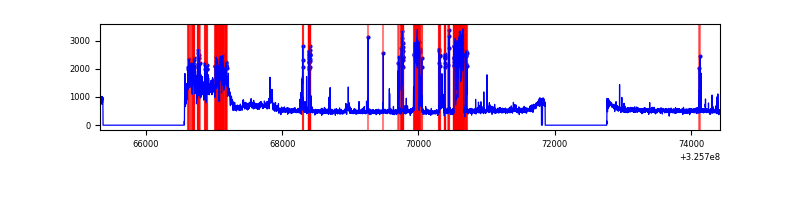 |
| C | 9100 | 6988 | 0 | 0 | 0.00% | 0.00% | 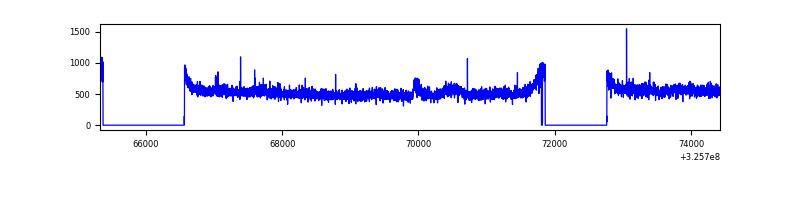 |
| D | 9100 | 6988 | 4 | 4 | 0.04% | 0.06% | 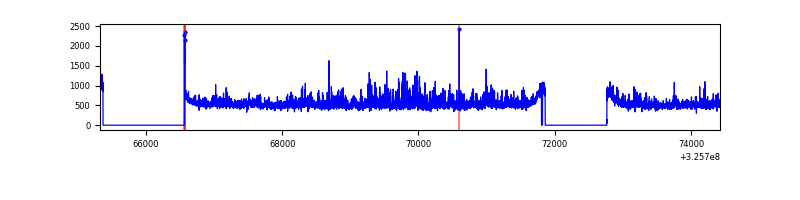 |
Top three noisy pixels from each quadrant. If the there are fewer than three noisy pixels in the level2.evt file, extra rows are filled as -1
| Pixel properties | Quadrant properties | ||||||
|---|---|---|---|---|---|---|---|
| Quadrant | DetID | PixID | Counts | Sigma | Mean | Median | Sigma |
| A | 13 | 254 | 8906 | 42.93 | 933 | 916 | 186.1 |
| A | 3 | 137 | 8512 | 40.82 | 933 | 916 | 186.1 |
| A | 0 | 226 | 8064 | 38.41 | 933 | 916 | 186.1 |
| B | 3 | 64 | 1622426 | 9451.36 | 891 | 870 | 171.6 |
| B | 12 | 111 | 21328 | 119.24 | 891 | 870 | 171.6 |
| B | 11 | 111 | 19595 | 109.14 | 891 | 870 | 171.6 |
| C | 14 | 238 | 141363 | 683.28 | 879 | 885 | 205.6 |
| C | 10 | 91 | 85041 | 409.33 | 879 | 885 | 205.6 |
| C | 8 | 208 | 54520 | 260.88 | 879 | 885 | 205.6 |
| D | 8 | 195 | 450375 | 2045.86 | 900 | 873 | 219.7 |
| D | 2 | 234 | 24882 | 109.27 | 900 | 873 | 219.7 |
| D | 1 | 52 | 11365 | 47.75 | 900 | 873 | 219.7 |
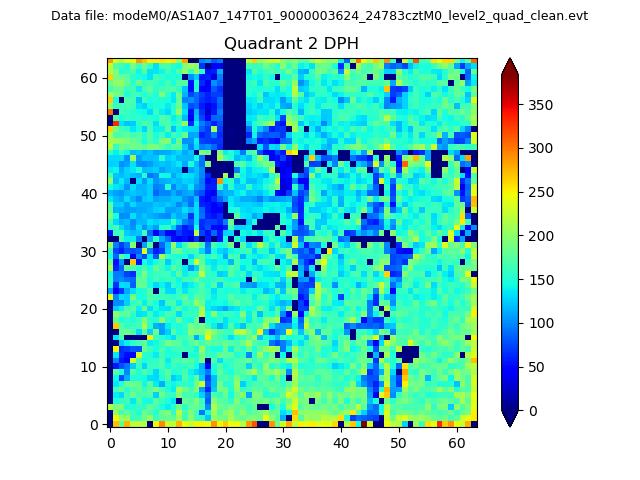
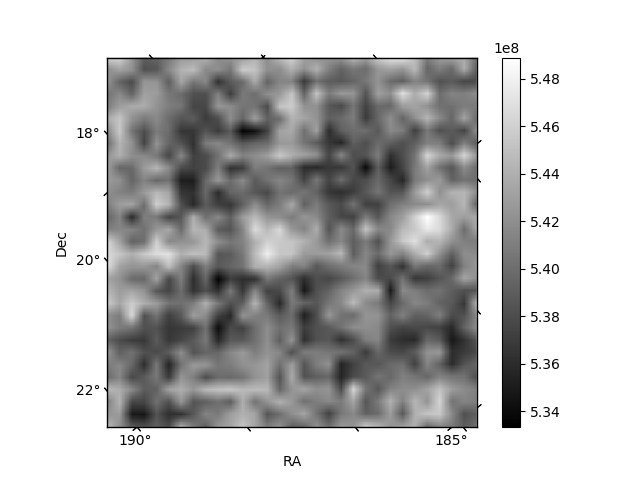
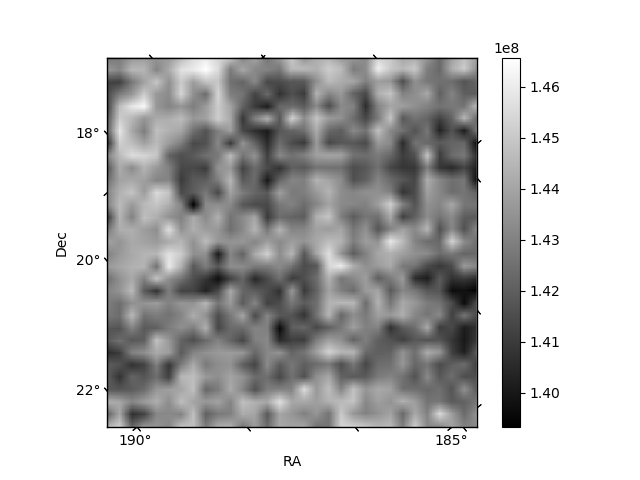
Histogram calculated using DETX and DETY for each event in the final _common_clean file
| Quadrant A | 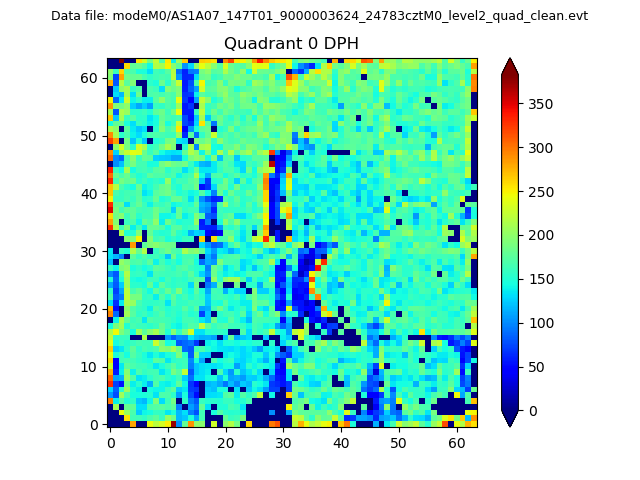 |
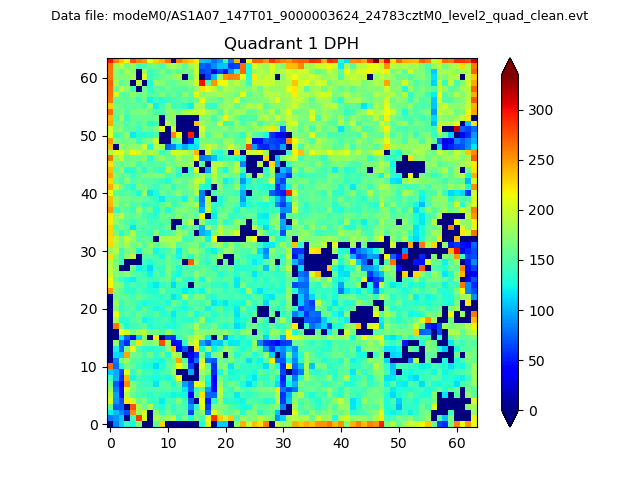 |
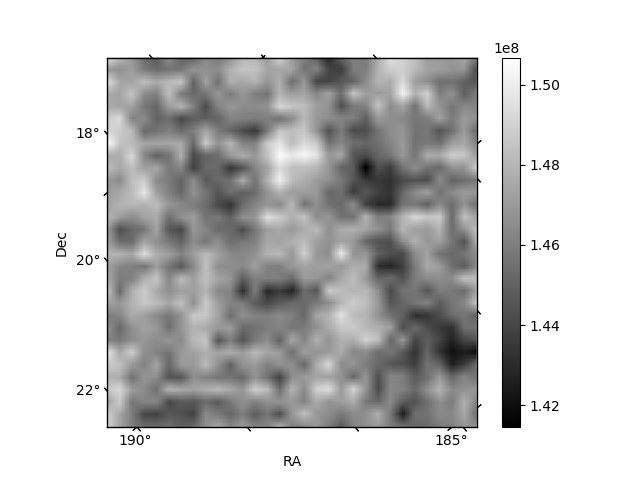
Quadrant B |
|---|---|---|---|
| Quadrant D | 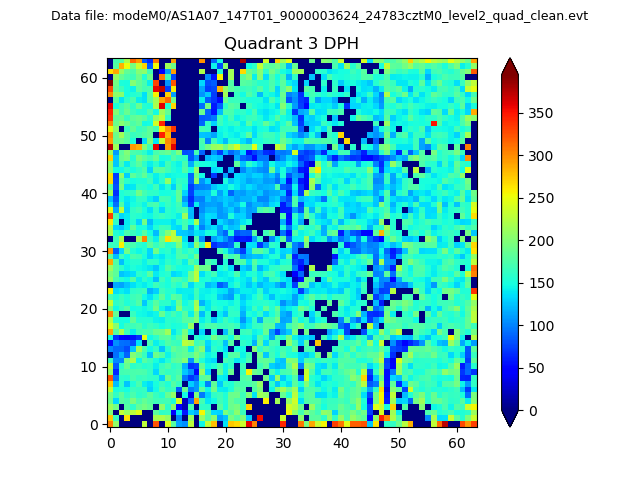 |
 |
Quadrant C |
| Plot type | Count rate plots | Images |
|---|---|---|
| Comparison with Poisson distribution Blue bars denote a histogram of data divided into 1 sec bins. Red curve is a Poisson curve with rate = median count rate of data. |
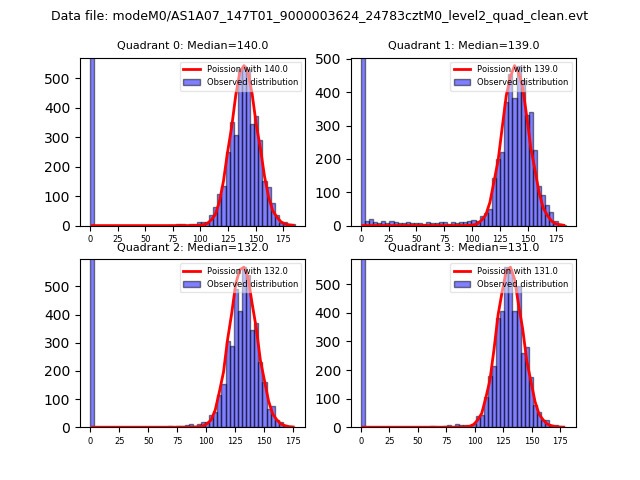 |
 |
| Quadrant-wise count rates Data is divided into 100 sec bins |
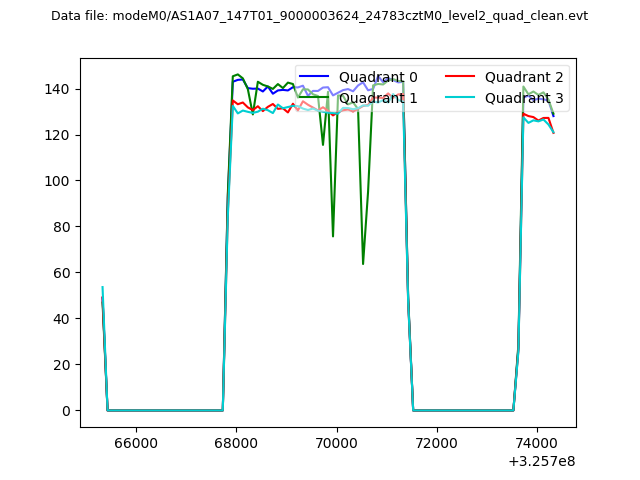 |
|
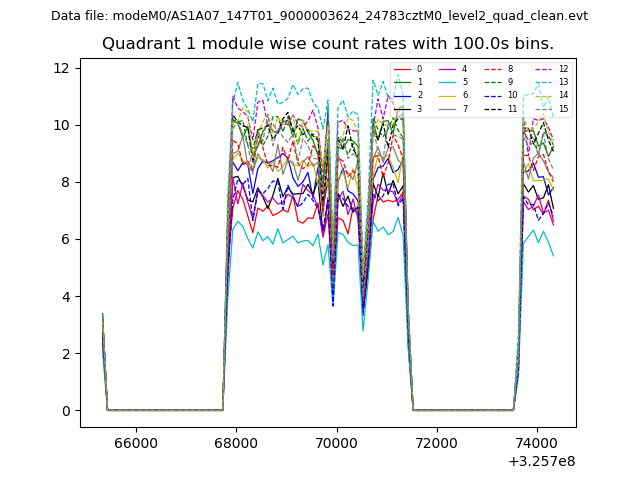
| Module-wise count rates for Quadrant A Data is divided into 100 sec bins |
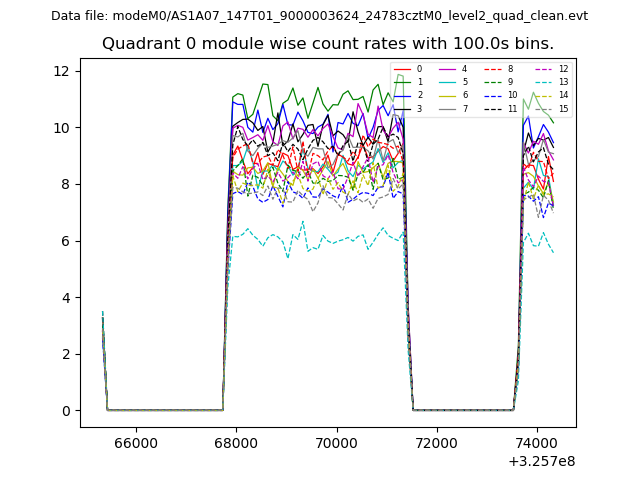 |
 |
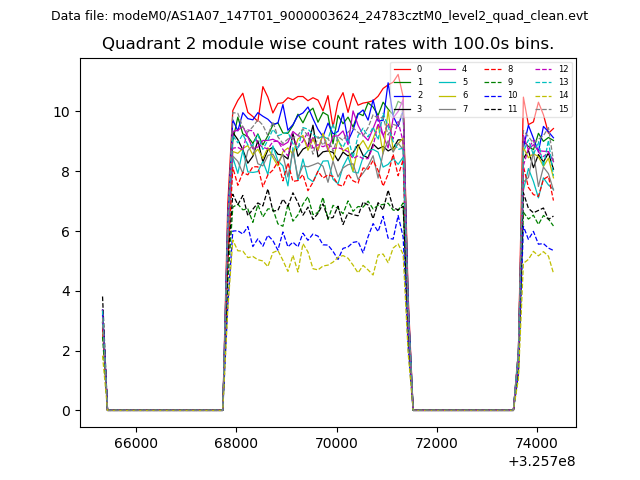
| Module-wise count rates for Quadrant B Data is divided into 100 sec bins |
 |
 |
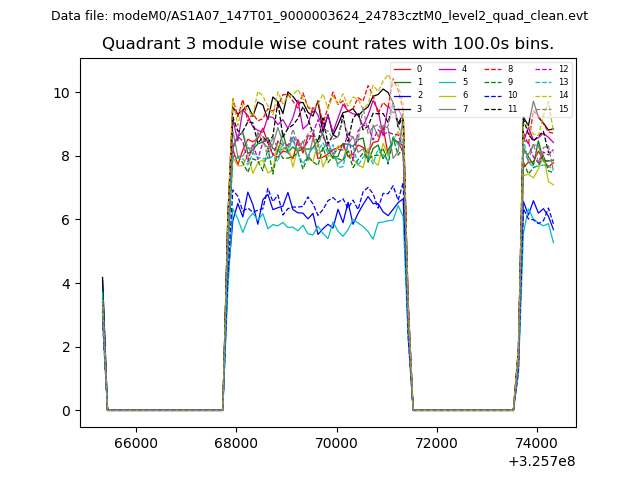
| Module-wise count rates for Quadrant C Data is divided into 100 sec bins |
 |
 |
| Module-wise count rates for Quadrant D Data is divided into 100 sec bins |
 |
 |
| Parameter | Plot |
|---|---|
| CZT HV Monitor | 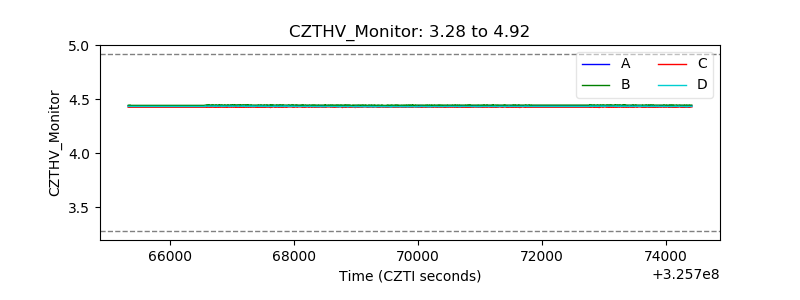 |
| D_VDD | 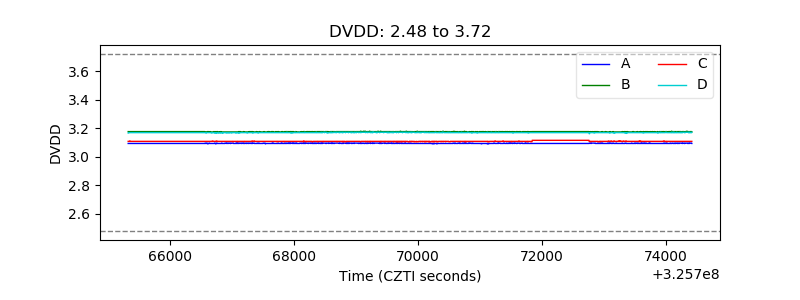 |
| Temperature 1 | 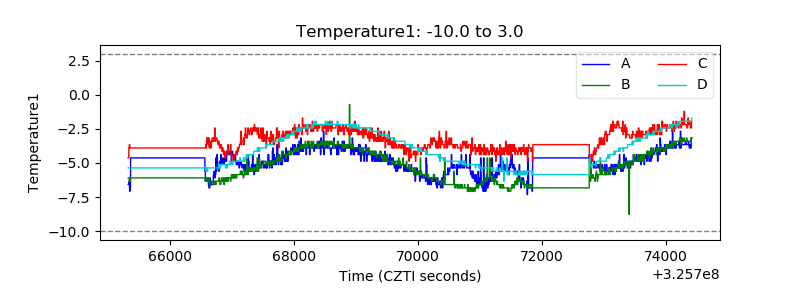 |
| Veto HV Monitor | 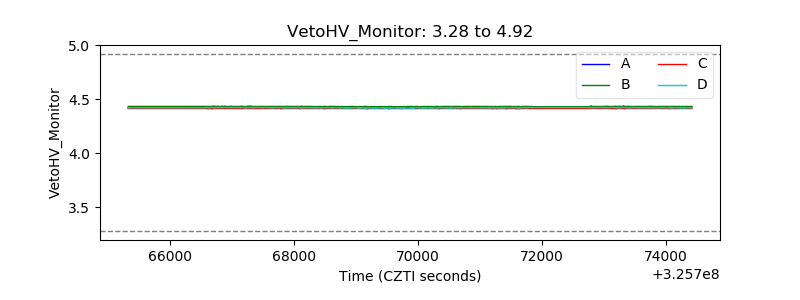 |
| Veto LLD | 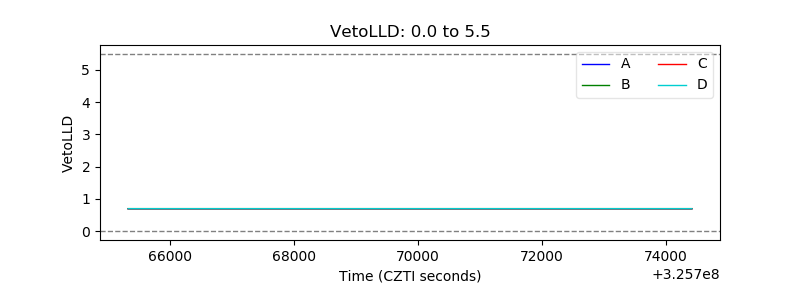 |
| Alpha Counter |  |
| _CPM_Rate | 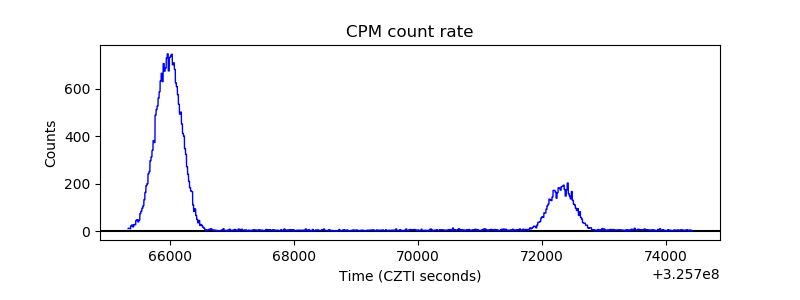 |
| CZT Counter | 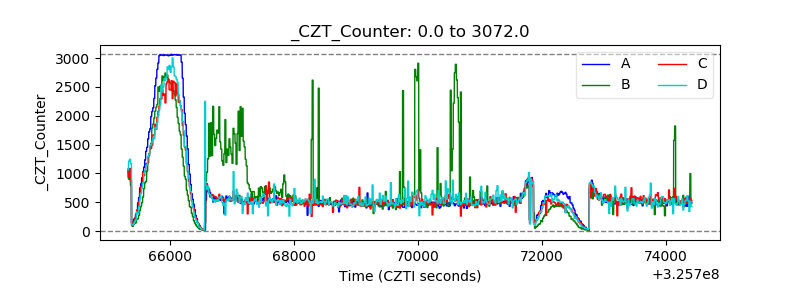 |
| +2.5 Volts monitor |  |
| +5 Volts monitor |  |
| _ROLL_ROT |  |
| _Roll_DEC | 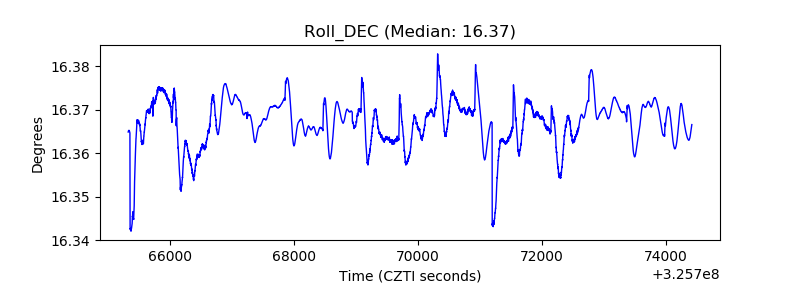 |
| _Roll_RA | 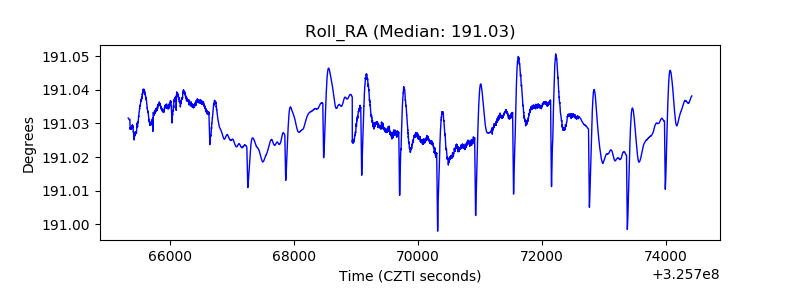 |
| Veto Counter | 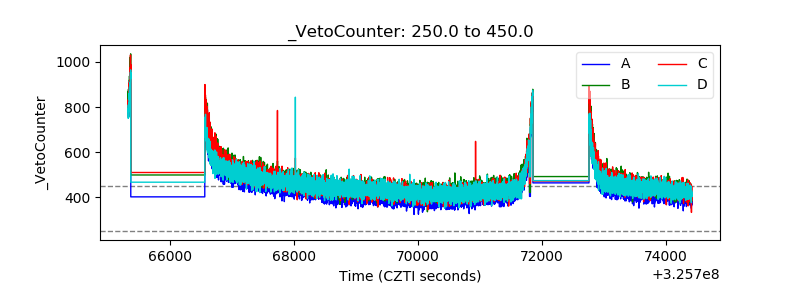 |