| Param | Original file | Final file |
|---|---|---|
| Filename | modeM0/AS1A07_147T01_9000003624_24784cztM0_level2.evt | modeM0/AS1A07_147T01_9000003624_24784cztM0_level2_quad_clean.evt |
| Size (bytes) | 660,778,560 | 91,969,920 |
| Size | 630.2 MB | 87.7 MB |
| Events in quadrant A | 3,565,418 | 619,728 |
| Events in quadrant B | 8,196,287 | 492,954 |
| Events in quadrant C | 3,992,800 | 584,595 |
| Events in quadrant D | 3,766,075 | 582,416 |
| Mode M0 | |||
|---|---|---|---|
| Quadrant | BADHDUFLAG | Total packets | Discarded packets |
| A | 0 | 15006 | 1 |
| B | 0 | 28952 | 1 |
| C | 0 | 16302 | 1 |
| D | 0 | 15681 | 1 |
| Mode SS | |||
|---|---|---|---|
| Quadrant | BADHDUFLAG | Total packets | Discarded packets |
| A | 0 | 146 | 0 |
| B | 0 | 146 | 0 |
| C | 0 | 146 | 0 |
| D | 0 | 146 | 0 |
| Mode M9 | |||
|---|---|---|---|
| Quadrant | BADHDUFLAG | Total packets | Discarded packets |
| A | 0 | 6 | 0 |
| B | 0 | 6 | 0 |
| C | 0 | 6 | 0 |
| D | 0 | 6 | 0 |
| Quadrant | Total seconds | Saturated seconds | Saturation percentage |
|---|---|---|---|
| A | 7252 | 105 | 1.447876% |
| B | 7253 | 1948 | 26.857852% |
| C | 7253 | 168 | 2.316283% |
| D | 7253 | 72 | 0.992693% |
Noise dominated data is calculated using 1-second bins in cleaned event files. If a bin has >2000 counts, and if more than 50% of those come from <1% of pixels, then it is considered to be noise-dominated and hence unusable.
| Quadrant | # 1 sec bins | Bins with >0 counts | Bins with >2000 counts | High rate bins dominated by noise | Noise dominated (total time) | Noise dominated (detector-on time) | Marked lightcurve |
|---|---|---|---|---|---|---|---|
| A | 7807 | 7253 | 0 | 0 | 0.00% | 0.00% | 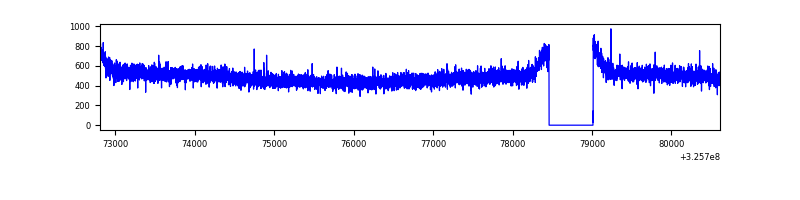 |
| B | 7808 | 7254 | 1558 | 1558 | 19.95% | 21.48% | 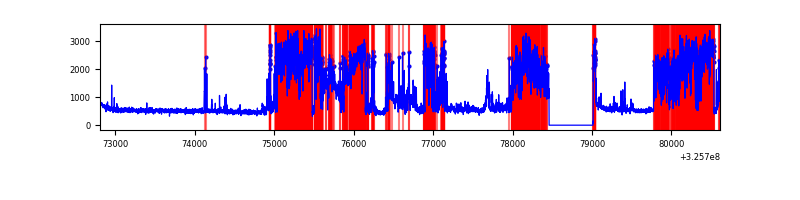 |
| C | 7808 | 7254 | 0 | 0 | 0.00% | 0.00% | 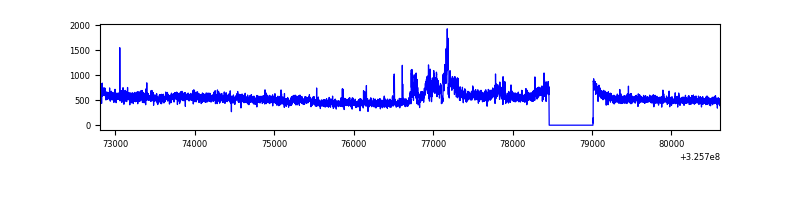 |
| D | 7808 | 7254 | 1 | 1 | 0.01% | 0.01% | 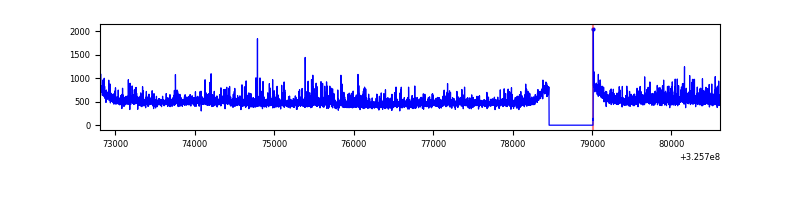 |
Top three noisy pixels from each quadrant. If the there are fewer than three noisy pixels in the level2.evt file, extra rows are filled as -1
| Pixel properties | Quadrant properties | ||||||
|---|---|---|---|---|---|---|---|
| Quadrant | DetID | PixID | Counts | Sigma | Mean | Median | Sigma |
| A | 13 | 254 | 10814 | 53.42 | 925 | 905 | 185.5 |
| A | 3 | 137 | 8718 | 42.12 | 925 | 905 | 185.5 |
| A | 0 | 226 | 7980 | 38.14 | 925 | 905 | 185.5 |
| B | 3 | 64 | 5127650 | 34187.26 | 777 | 757 | 150.0 |
| B | 12 | 111 | 19145 | 122.62 | 777 | 757 | 150.0 |
| B | 11 | 111 | 16945 | 107.95 | 777 | 757 | 150.0 |
| C | 2 | 16 | 255159 | 1238.66 | 876 | 880 | 205.3 |
| C | 10 | 91 | 155990 | 755.58 | 876 | 880 | 205.3 |
| C | 14 | 238 | 140945 | 682.29 | 876 | 880 | 205.3 |
| D | 8 | 195 | 355489 | 1625.21 | 893 | 868 | 218.2 |
| D | 2 | 234 | 25911 | 114.77 | 893 | 868 | 218.2 |
| D | 1 | 52 | 22779 | 100.42 | 893 | 868 | 218.2 |
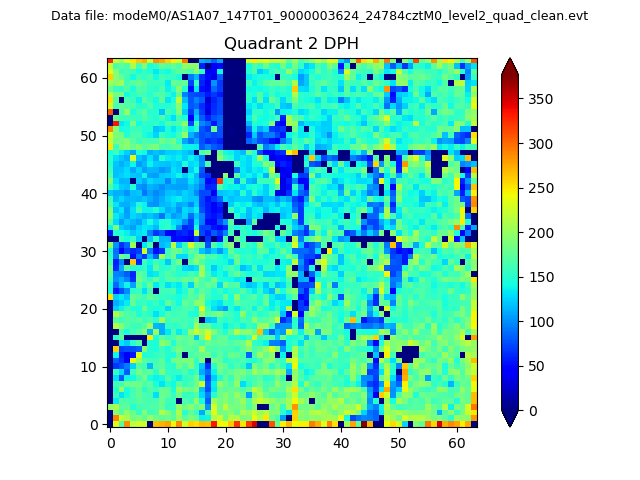
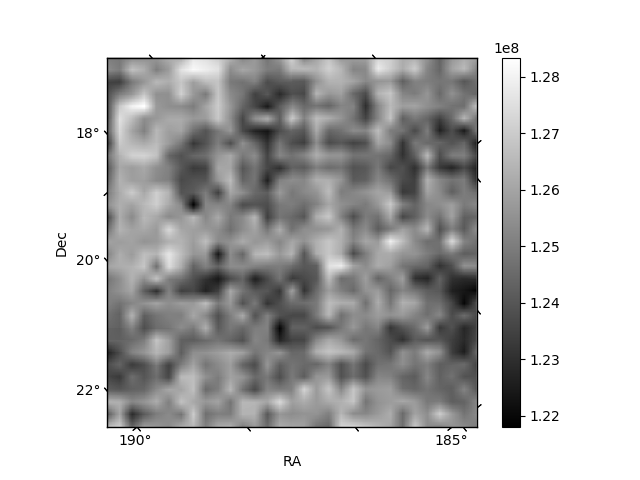
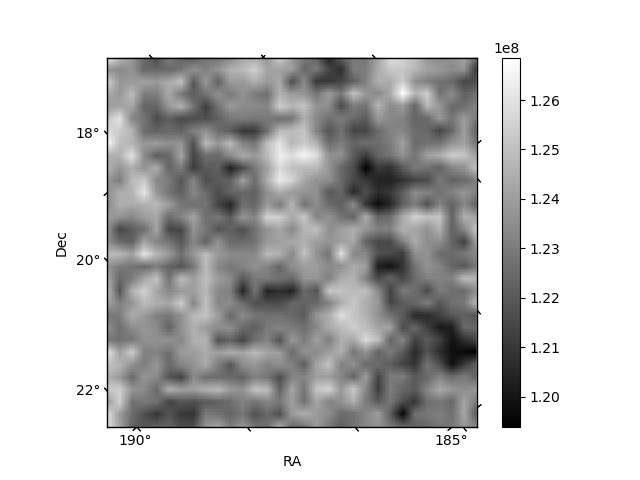
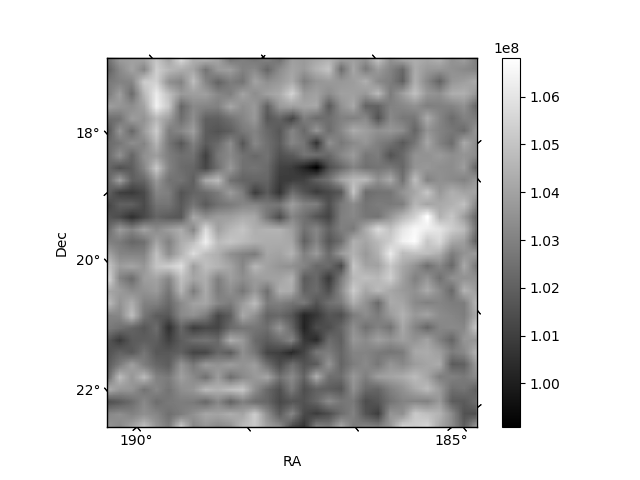
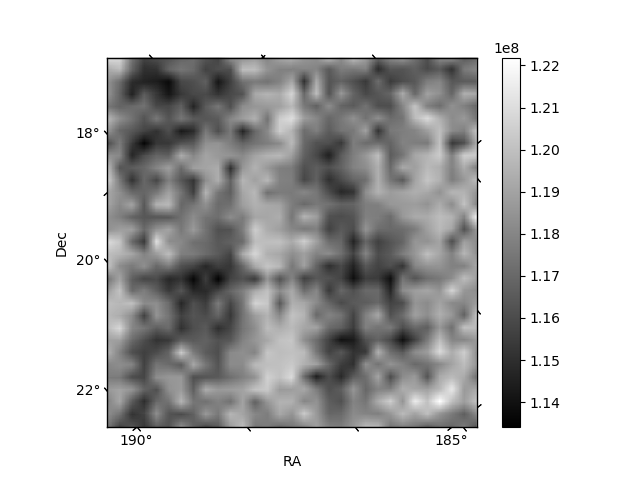
Histogram calculated using DETX and DETY for each event in the final _common_clean file
| Quadrant A | 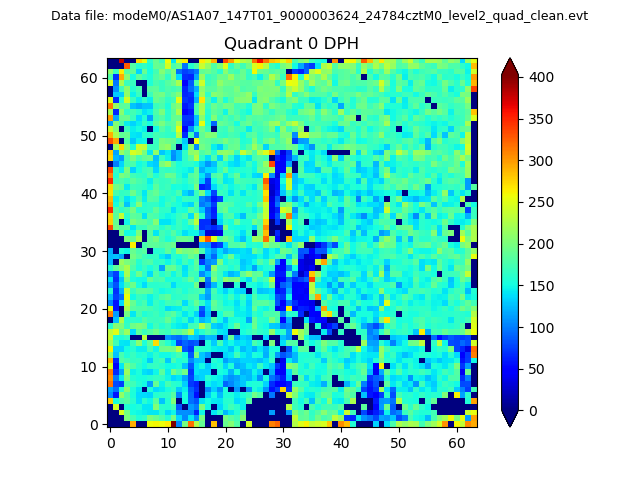 |
 |
Quadrant B |
|---|---|---|---|
| Quadrant D |  |
 |
Quadrant C |
| Plot type | Count rate plots | Images |
|---|---|---|
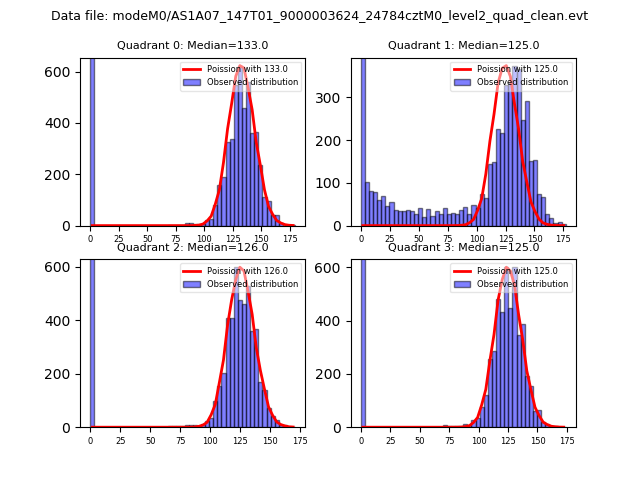
| Comparison with Poisson distribution Blue bars denote a histogram of data divided into 1 sec bins. Red curve is a Poisson curve with rate = median count rate of data. |
 |
 |
| Quadrant-wise count rates Data is divided into 100 sec bins |
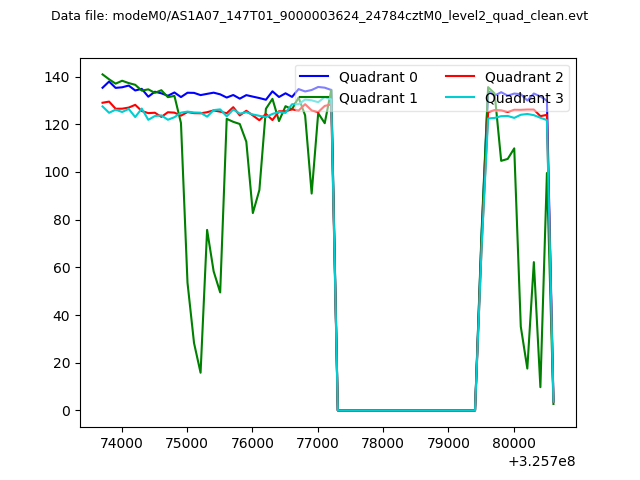 |
|
| Module-wise count rates for Quadrant A Data is divided into 100 sec bins |
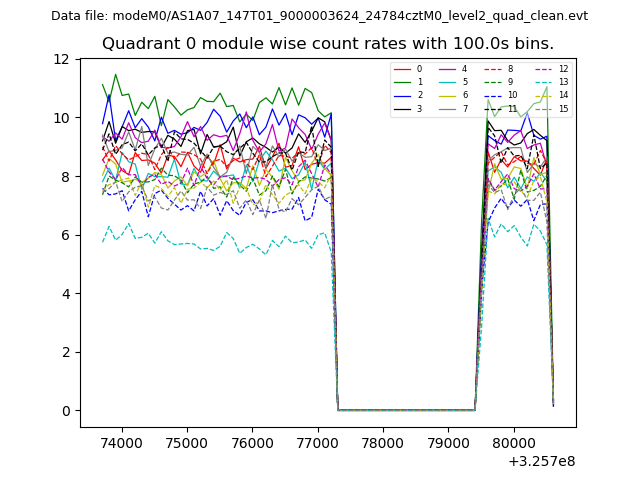 |
 |
| Module-wise count rates for Quadrant B Data is divided into 100 sec bins |
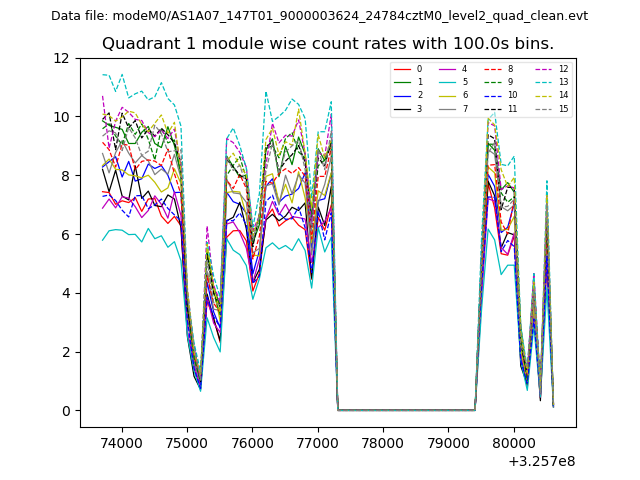 |
 |
| Module-wise count rates for Quadrant C Data is divided into 100 sec bins |
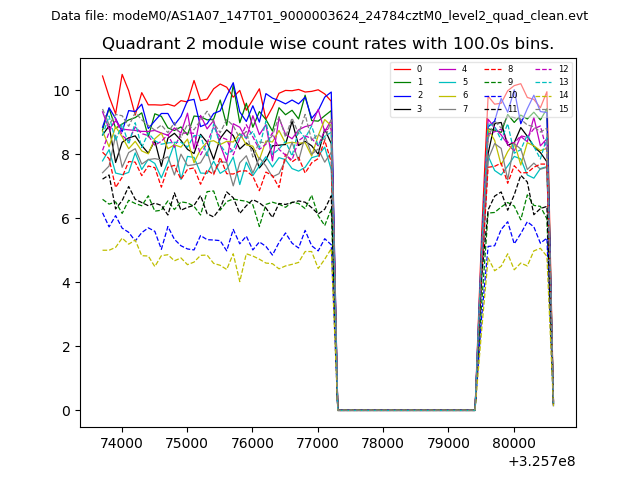 |
 |
| Module-wise count rates for Quadrant D Data is divided into 100 sec bins |
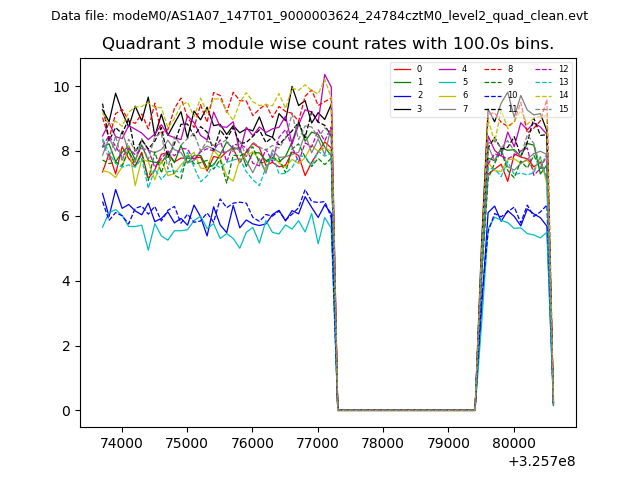 |
 |
| Parameter | Plot |
|---|---|
| CZT HV Monitor | 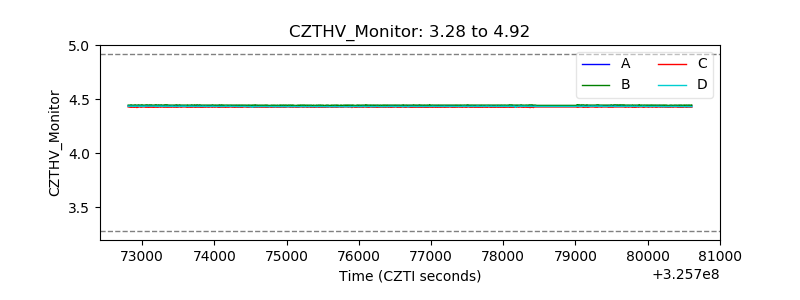 |
| D_VDD | 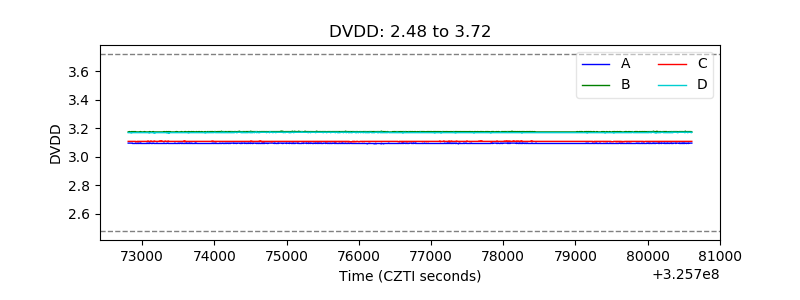 |
| Temperature 1 |  |
| Veto HV Monitor | 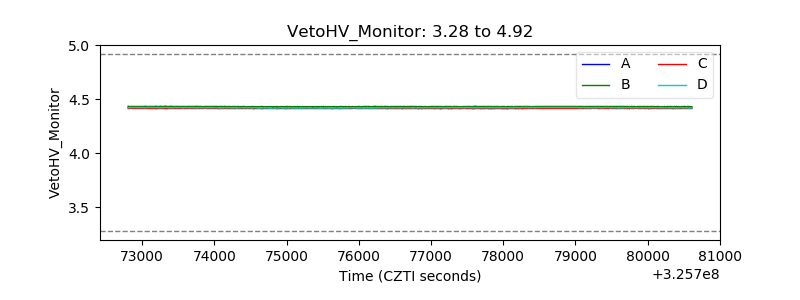 |
| Veto LLD | 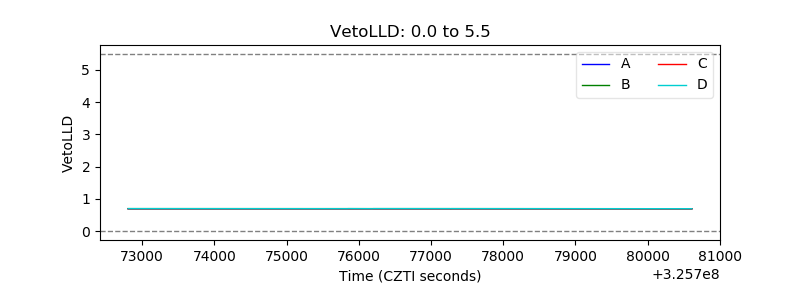 |
| Alpha Counter | 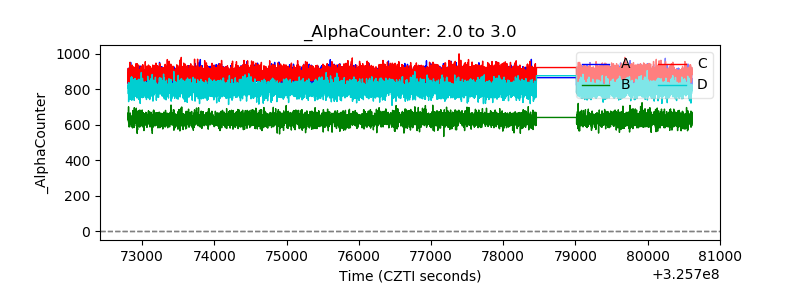 |
| _CPM_Rate | 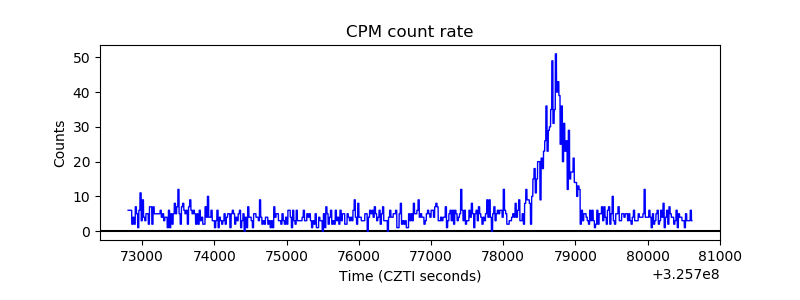 |
| CZT Counter | 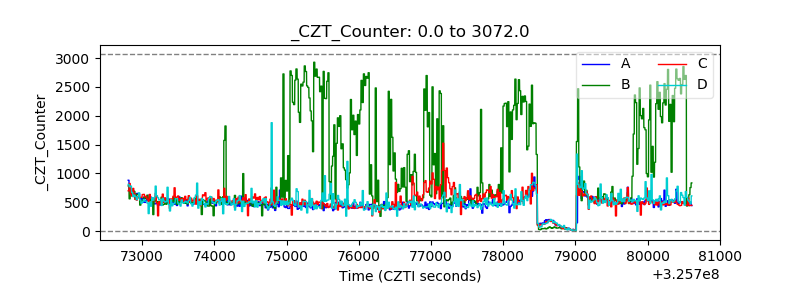 |
| +2.5 Volts monitor |  |
| +5 Volts monitor |  |
| _ROLL_ROT | 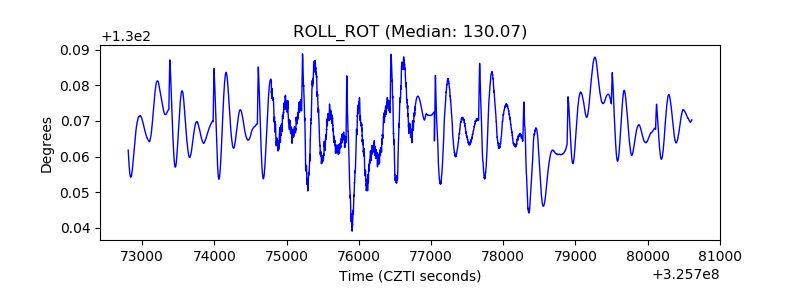 |
| _Roll_DEC | 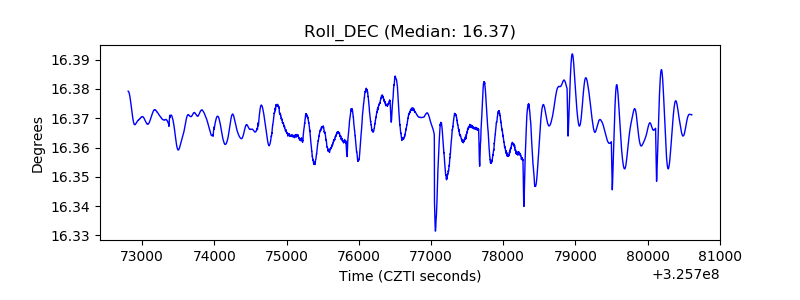 |
| _Roll_RA | 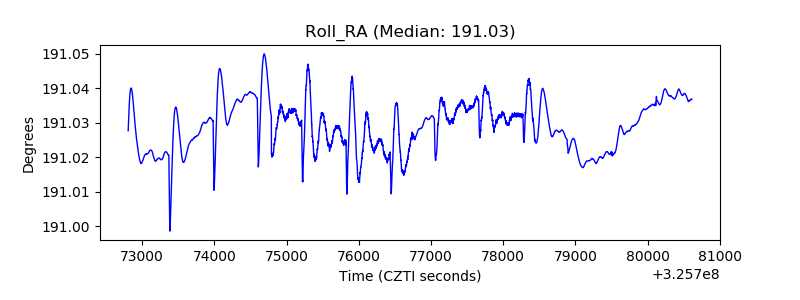 |
| Veto Counter | 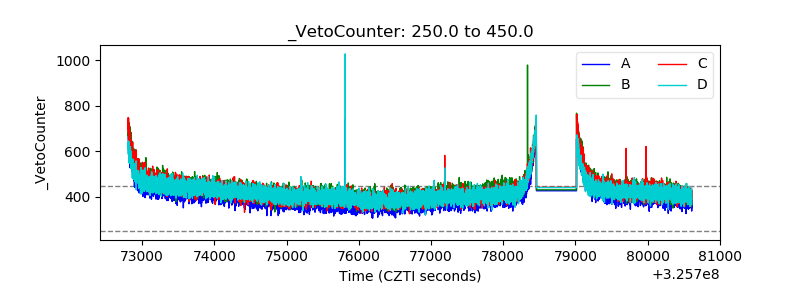 |