| Param | Original file | Final file |
|---|---|---|
| Filename | modeM0/AS1T03_197T01_9000003626_24786cztM0_level2.evt | modeM0/AS1T03_197T01_9000003626_24786cztM0_level2_quad_clean.evt |
| Size (bytes) | 326,450,880 | 58,599,360 |
| Size | 311.3 MB | 55.9 MB |
| Events in quadrant A | 2,237,134 | 366,446 |
| Events in quadrant B | 2,477,347 | 368,340 |
| Events in quadrant C | 2,380,427 | 356,675 |
| Events in quadrant D | 2,470,668 | 352,064 |
| Mode M9 | |||
|---|---|---|---|
| Quadrant | BADHDUFLAG | Total packets | Discarded packets |
| A | 0 | 4 | 0 |
| B | 0 | 4 | 0 |
| C | 0 | 4 | 0 |
| D | 0 | 4 | 0 |
| Mode SS | |||
|---|---|---|---|
| Quadrant | BADHDUFLAG | Total packets | Discarded packets |
| A | 0 | 96 | 0 |
| B | 0 | 96 | 0 |
| C | 0 | 96 | 0 |
| D | 0 | 96 | 0 |
| Mode M0 | |||
|---|---|---|---|
| Quadrant | BADHDUFLAG | Total packets | Discarded packets |
| A | 0 | 9660 | 1 |
| B | 0 | 10314 | 1 |
| C | 0 | 9867 | 1 |
| D | 0 | 10413 | 1 |
| Quadrant | Total seconds | Saturated seconds | Saturation percentage |
|---|---|---|---|
| A | 4709 | 27 | 0.573370% |
| B | 4709 | 113 | 2.399660% |
| C | 4709 | 78 | 1.656403% |
| D | 4709 | 32 | 0.679550% |
Noise dominated data is calculated using 1-second bins in cleaned event files. If a bin has >2000 counts, and if more than 50% of those come from <1% of pixels, then it is considered to be noise-dominated and hence unusable.
| Quadrant | # 1 sec bins | Bins with >0 counts | Bins with >2000 counts | High rate bins dominated by noise | Noise dominated (total time) | Noise dominated (detector-on time) | Marked lightcurve |
|---|---|---|---|---|---|---|---|
| A | 5084 | 4710 | 0 | 0 | 0.00% | 0.00% | 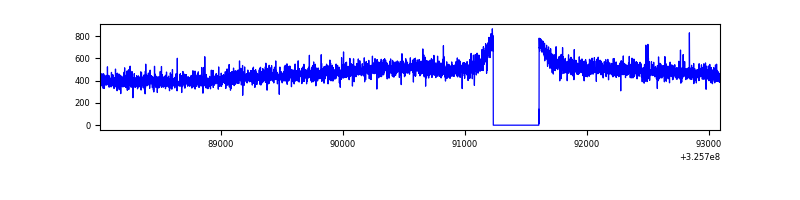 |
| B | 5084 | 4710 | 25 | 25 | 0.49% | 0.53% | 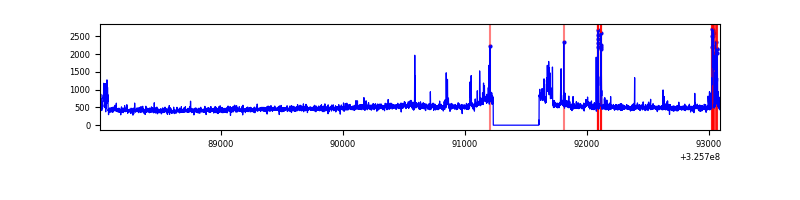 |
| C | 5084 | 4710 | 0 | 0 | 0.00% | 0.00% | 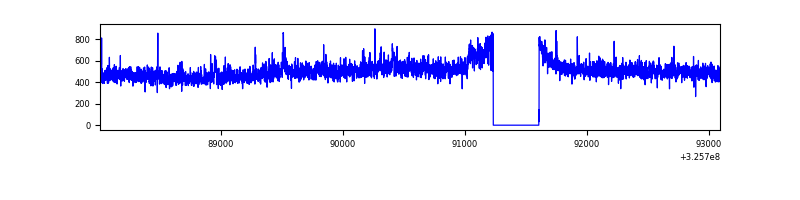 |
| D | 5084 | 4710 | 3 | 3 | 0.06% | 0.06% | 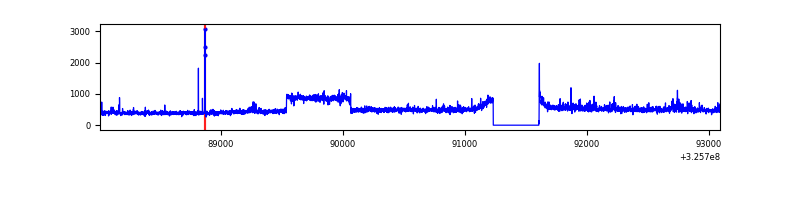 |
Top three noisy pixels from each quadrant. If the there are fewer than three noisy pixels in the level2.evt file, extra rows are filled as -1
| Pixel properties | Quadrant properties | ||||||
|---|---|---|---|---|---|---|---|
| Quadrant | DetID | PixID | Counts | Sigma | Mean | Median | Sigma |
| A | 13 | 254 | 7878 | 61.75 | 580 | 567 | 118.4 |
| A | 3 | 137 | 5477 | 41.47 | 580 | 567 | 118.4 |
| A | 0 | 226 | 4856 | 36.23 | 580 | 567 | 118.4 |
| B | 3 | 64 | 186305 | 1664.39 | 572 | 557 | 111.6 |
| B | 4 | 52 | 22038 | 192.48 | 572 | 557 | 111.6 |
| B | 12 | 111 | 13753 | 118.24 | 572 | 557 | 111.6 |
| C | 10 | 91 | 116903 | 901.81 | 550 | 552 | 129.0 |
| C | 14 | 238 | 86156 | 663.5 | 550 | 552 | 129.0 |
| C | 8 | 208 | 16650 | 124.77 | 550 | 552 | 129.0 |
| D | 1 | 52 | 235969 | 1696.93 | 561 | 543 | 138.7 |
| D | 8 | 195 | 93146 | 667.47 | 561 | 543 | 138.7 |
| D | 2 | 234 | 19523 | 136.81 | 561 | 543 | 138.7 |
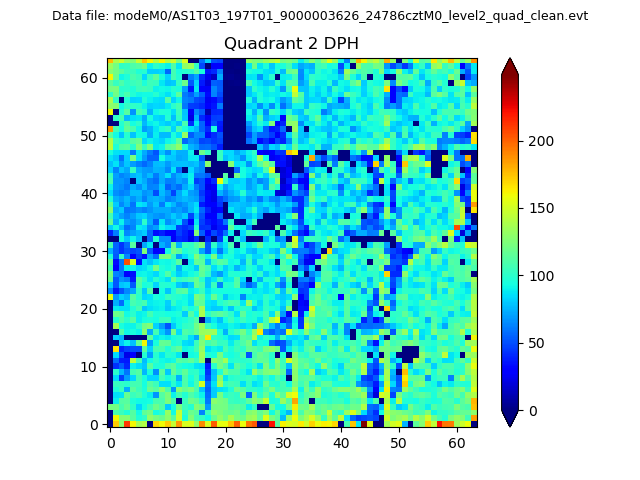
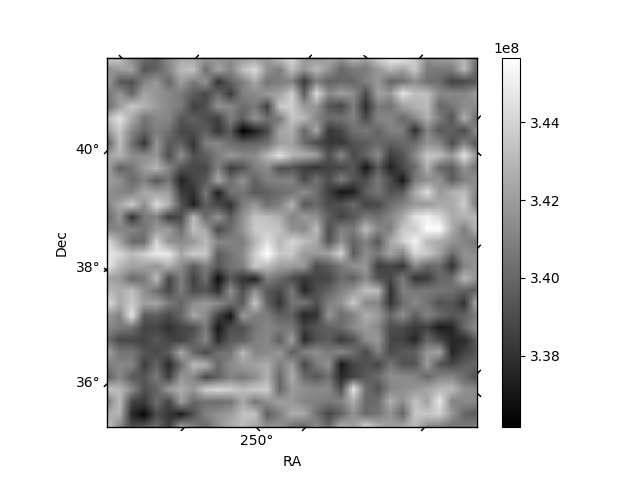
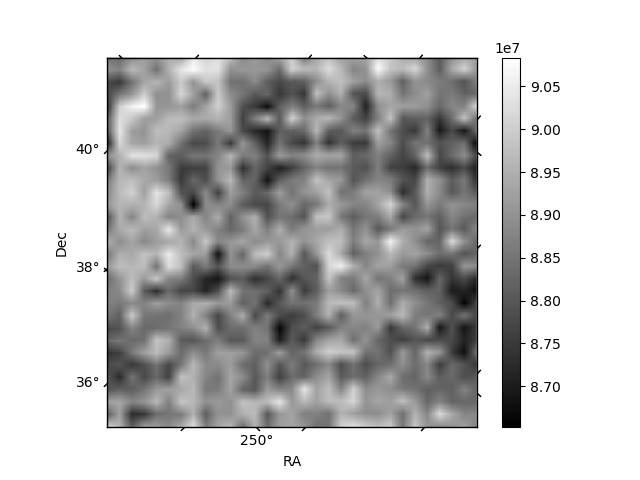
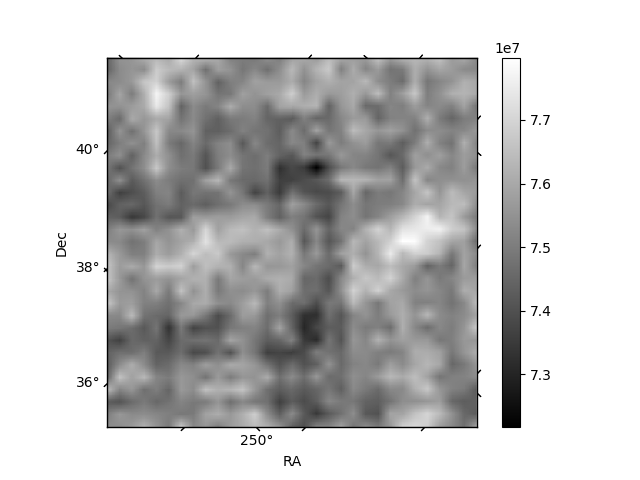
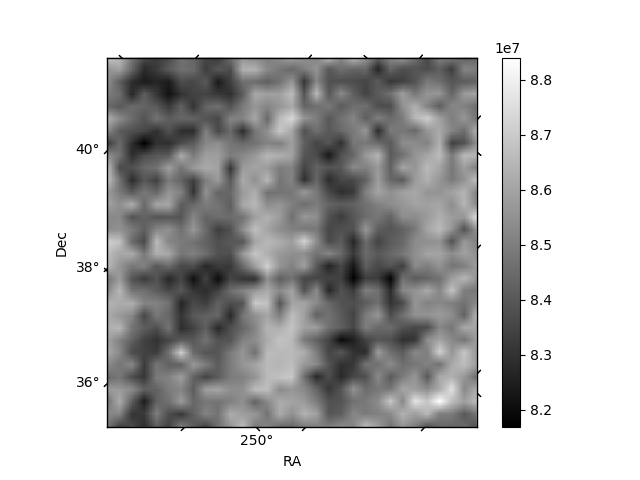
Histogram calculated using DETX and DETY for each event in the final _common_clean file
| Quadrant A | 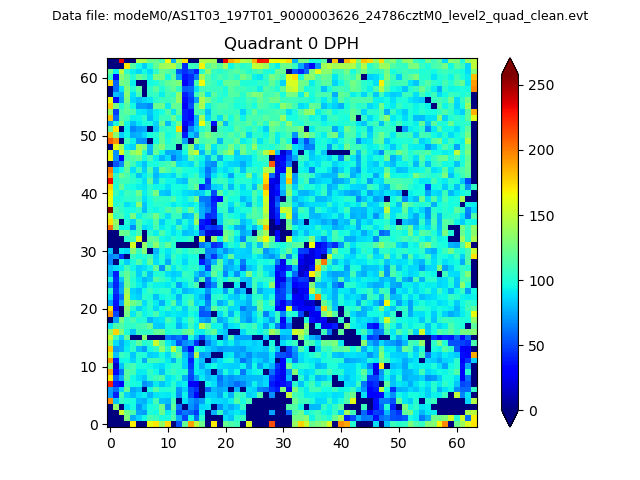 |
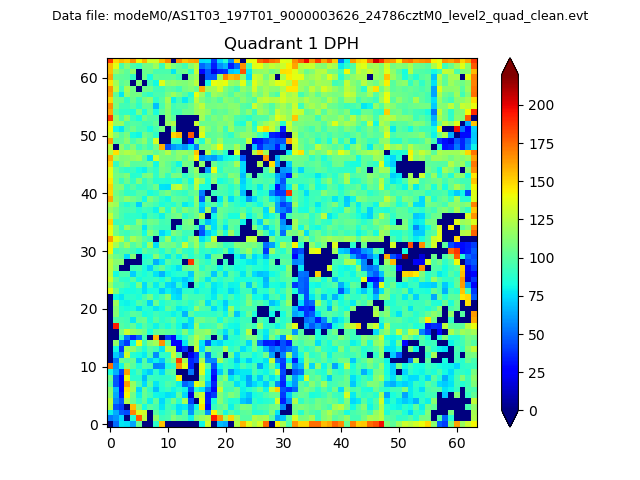 |
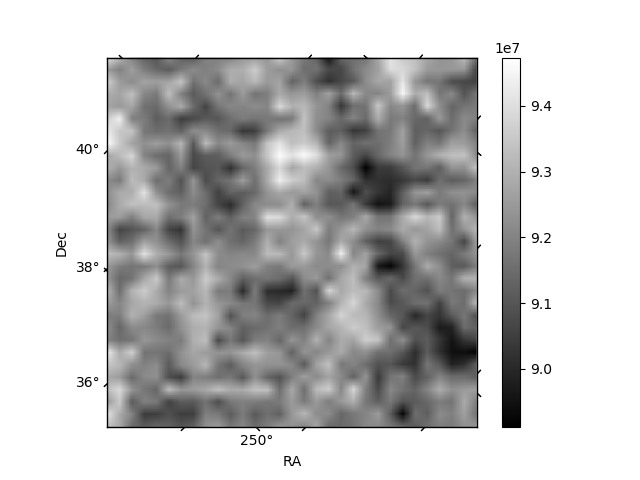
Quadrant B |
|---|---|---|---|
| Quadrant D | 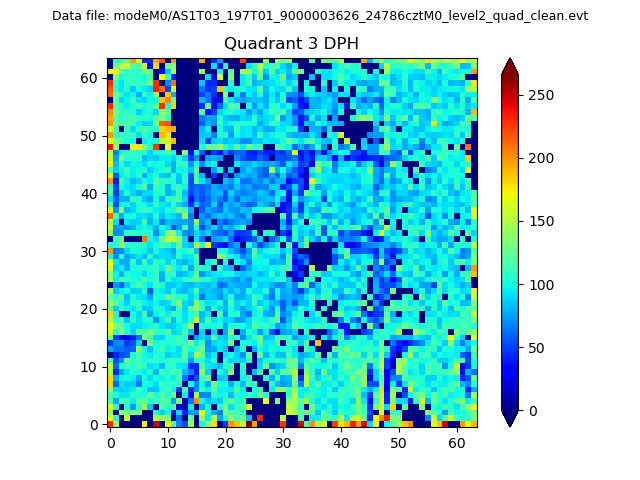 |
 |
Quadrant C |
| Plot type | Count rate plots | Images |
|---|---|---|
| Comparison with Poisson distribution Blue bars denote a histogram of data divided into 1 sec bins. Red curve is a Poisson curve with rate = median count rate of data. |
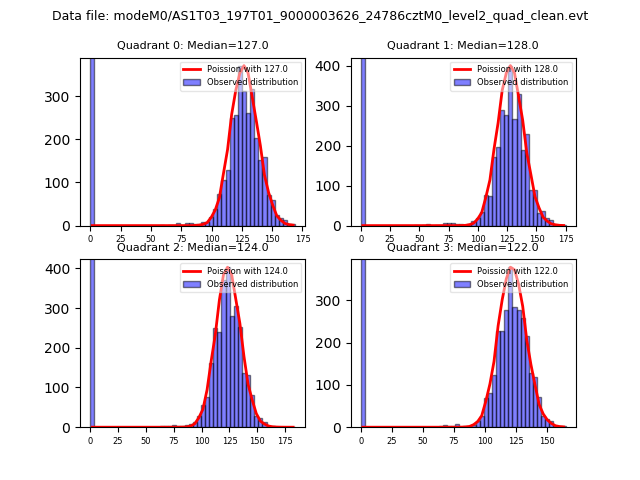 |
 |
| Quadrant-wise count rates Data is divided into 100 sec bins |
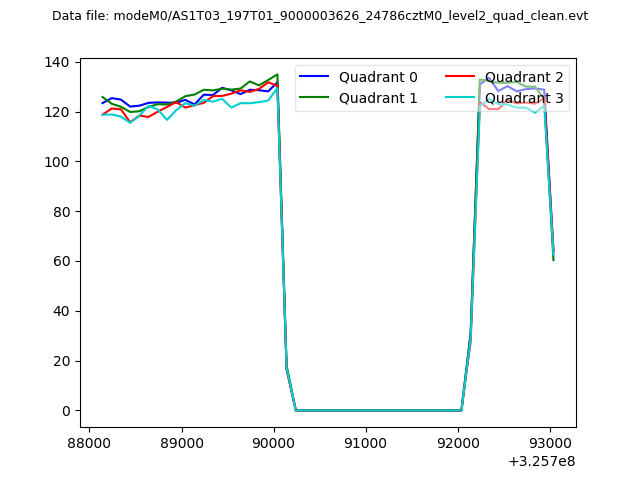 |
|
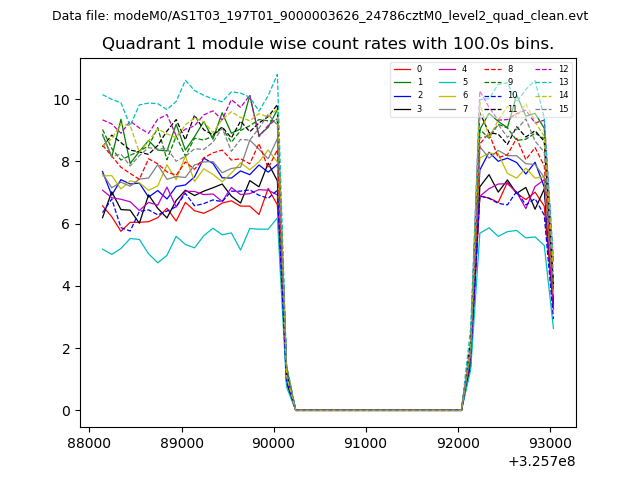
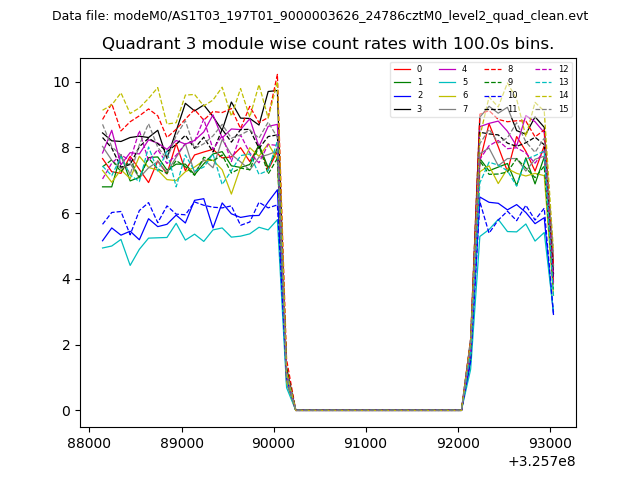
| Module-wise count rates for Quadrant A Data is divided into 100 sec bins |
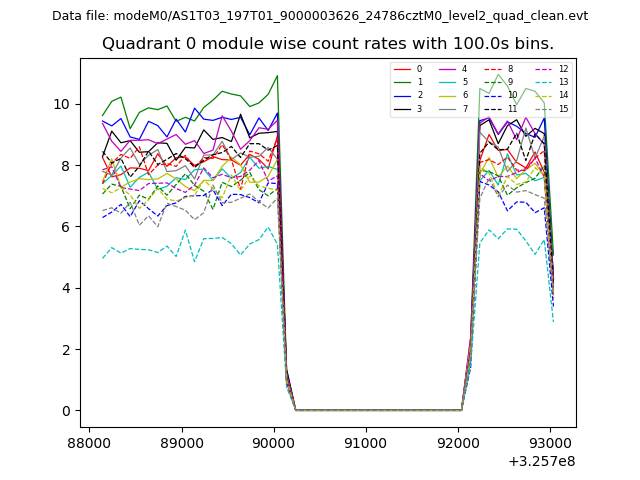 |
 |
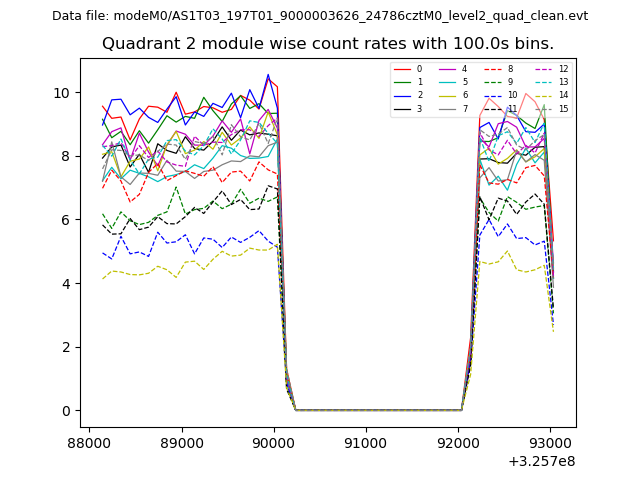
| Module-wise count rates for Quadrant B Data is divided into 100 sec bins |
 |
 |
| Module-wise count rates for Quadrant C Data is divided into 100 sec bins |
 |
 |
| Module-wise count rates for Quadrant D Data is divided into 100 sec bins |
 |
 |
| Parameter | Plot |
|---|---|
| CZT HV Monitor | 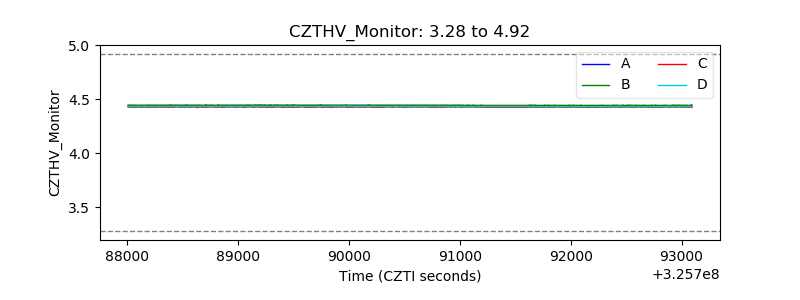 |
| D_VDD | 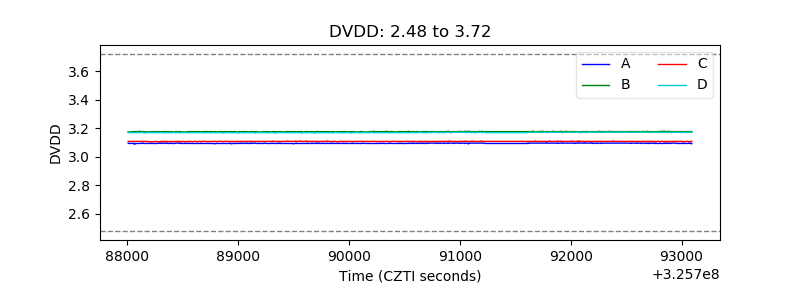 |
| Temperature 1 | 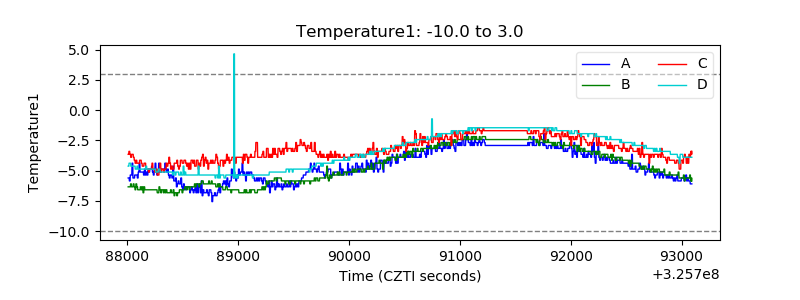 |
| Veto HV Monitor | 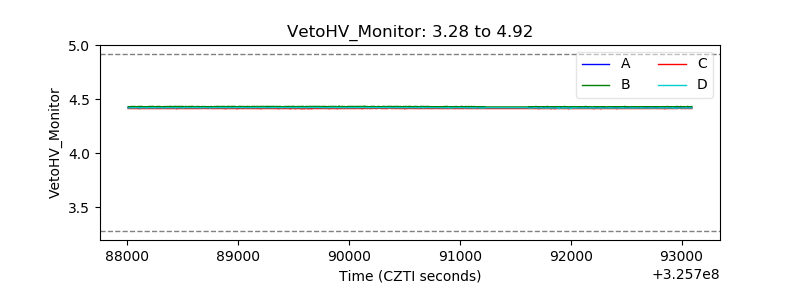 |
| Veto LLD | 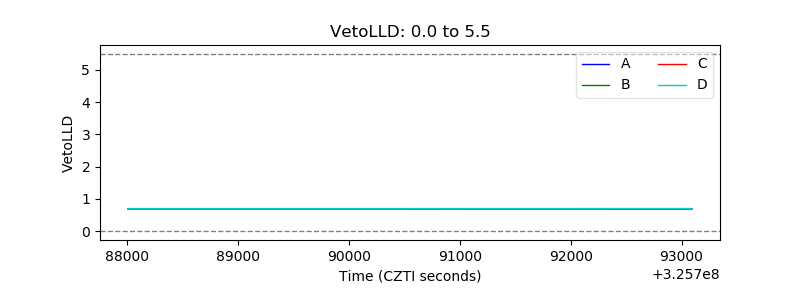 |
| Alpha Counter | 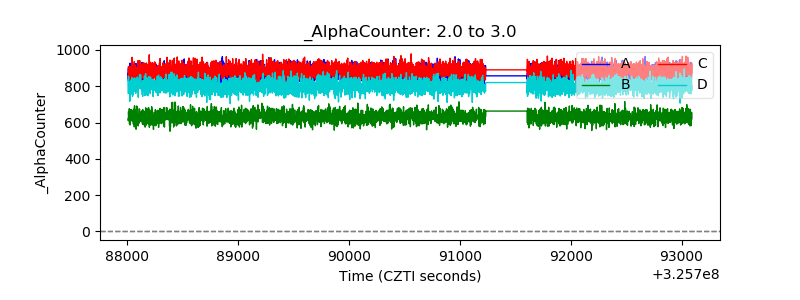 |
| _CPM_Rate | 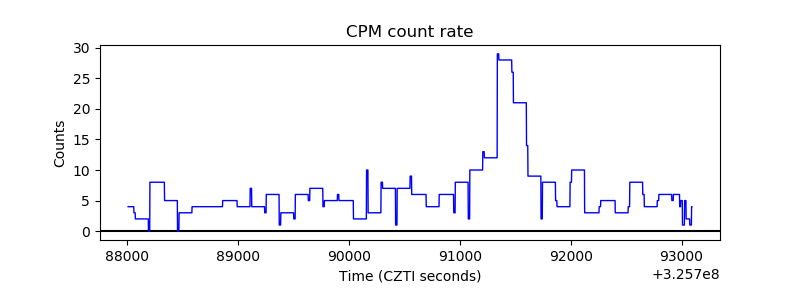 |
| CZT Counter | 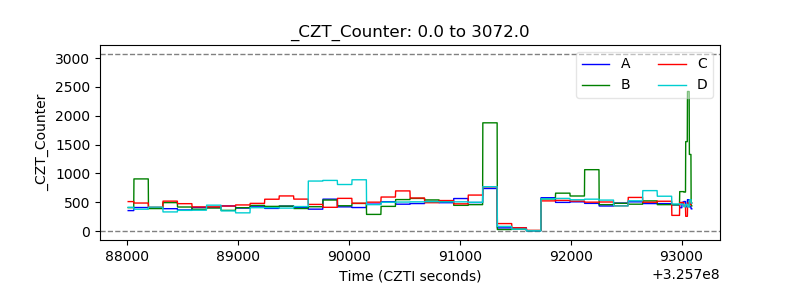 |
| +2.5 Volts monitor |  |
| +5 Volts monitor | 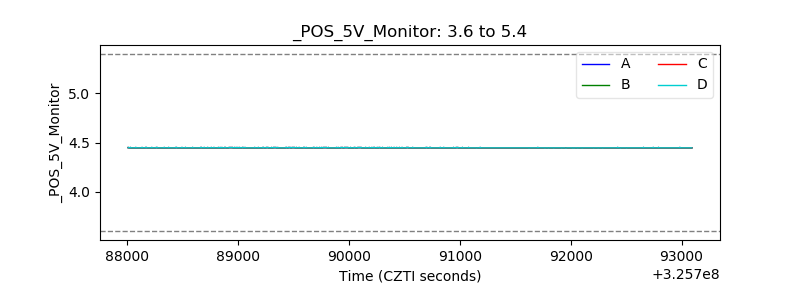 |
| _ROLL_ROT | 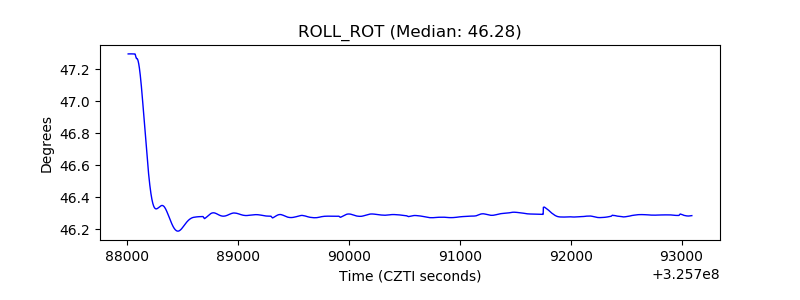 |
| _Roll_DEC | 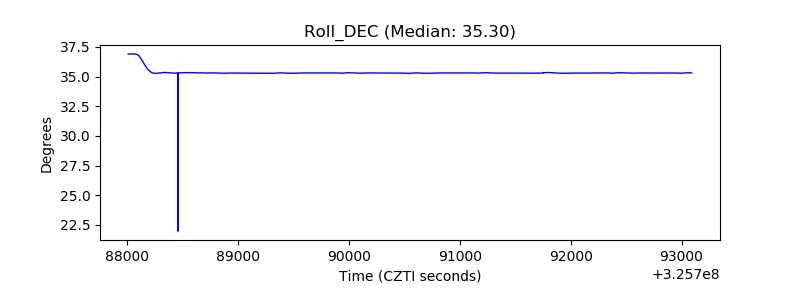 |
| _Roll_RA | 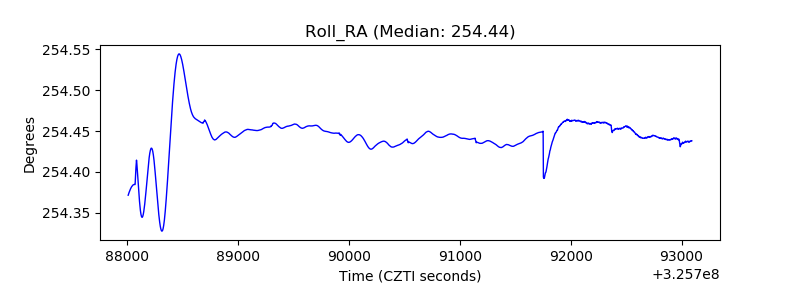 |
| Veto Counter | 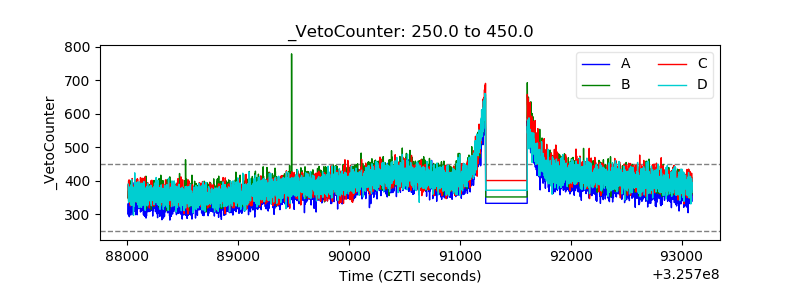 |