| Param | Original file | Final file |
|---|---|---|
| Filename | modeM0/AS1T03_197T01_9000003626_24789cztM0_level2.evt | modeM0/AS1T03_197T01_9000003626_24789cztM0_level2_quad_clean.evt |
| Size (bytes) | 1,458,305,280 | 245,044,800 |
| Size | 1.4 GB | 233.7 MB |
| Events in quadrant A | 8,514,961 | 1,585,156 |
| Events in quadrant B | 16,289,916 | 1,489,167 |
| Events in quadrant C | 9,209,800 | 1,550,650 |
| Events in quadrant D | 8,903,882 | 1,525,091 |
| Mode M9 | |||
|---|---|---|---|
| Quadrant | BADHDUFLAG | Total packets | Discarded packets |
| A | 0 | 20 | 0 |
| B | 0 | 20 | 0 |
| C | 0 | 20 | 0 |
| D | 0 | 20 | 0 |
| Mode SS | |||
|---|---|---|---|
| Quadrant | BADHDUFLAG | Total packets | Discarded packets |
| A | 0 | 376 | 0 |
| B | 0 | 376 | 0 |
| C | 0 | 376 | 0 |
| D | 0 | 376 | 0 |
| Mode M0 | |||
|---|---|---|---|
| Quadrant | BADHDUFLAG | Total packets | Discarded packets |
| A | 0 | 37651 | 4 |
| B | 0 | 60693 | 4 |
| C | 0 | 39040 | 4 |
| D | 0 | 39045 | 4 |
| Quadrant | Total seconds | Saturated seconds | Saturation percentage |
|---|---|---|---|
| A | 18447 | 62 | 0.336098% |
| B | 18446 | 2822 | 15.298710% |
| C | 18447 | 258 | 1.398601% |
| D | 18447 | 71 | 0.384886% |
Noise dominated data is calculated using 1-second bins in cleaned event files. If a bin has >2000 counts, and if more than 50% of those come from <1% of pixels, then it is considered to be noise-dominated and hence unusable.
| Quadrant | # 1 sec bins | Bins with >0 counts | Bins with >2000 counts | High rate bins dominated by noise | Noise dominated (total time) | Noise dominated (detector-on time) | Marked lightcurve |
|---|---|---|---|---|---|---|---|
| A | 20437 | 18450 | 0 | 0 | 0.00% | 0.00% | 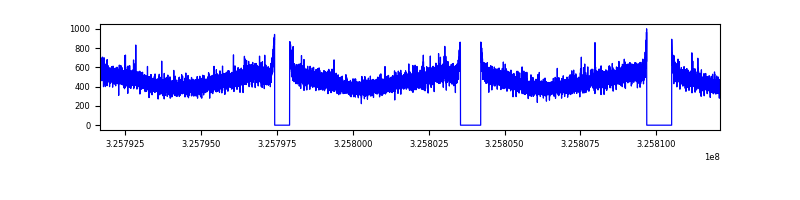 |
| B | 20436 | 18449 | 1799 | 1799 | 8.80% | 9.75% | 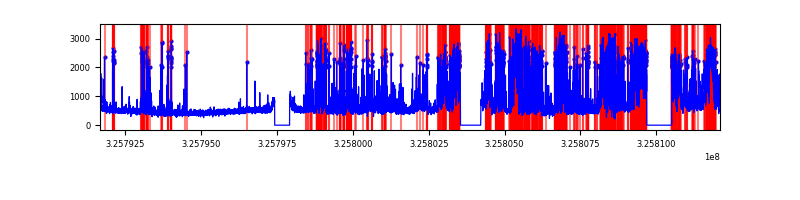 |
| C | 20437 | 18450 | 6 | 6 | 0.03% | 0.03% | 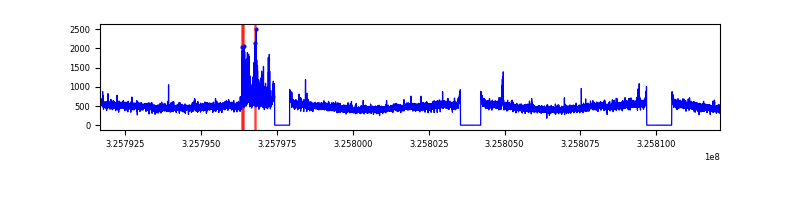 |
| D | 20437 | 18450 | 19 | 19 | 0.09% | 0.10% | 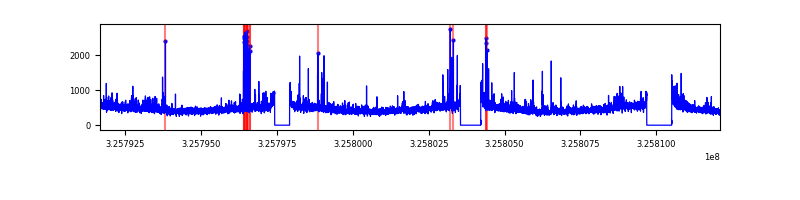 |
Top three noisy pixels from each quadrant. If the there are fewer than three noisy pixels in the level2.evt file, extra rows are filled as -1
| Pixel properties | Quadrant properties | ||||||
|---|---|---|---|---|---|---|---|
| Quadrant | DetID | PixID | Counts | Sigma | Mean | Median | Sigma |
| A | 13 | 254 | 28793 | 60.34 | 2209 | 2164 | 441.3 |
| A | 3 | 137 | 21135 | 42.99 | 2209 | 2164 | 441.3 |
| A | 0 | 226 | 18561 | 37.16 | 2209 | 2164 | 441.3 |
| B | 3 | 64 | 8128442 | 21152.44 | 2020 | 1966 | 384.2 |
| B | 0 | 189 | 79558 | 201.96 | 2020 | 1966 | 384.2 |
| B | 12 | 111 | 48341 | 120.71 | 2020 | 1966 | 384.2 |
| C | 14 | 238 | 335170 | 673.59 | 2122 | 2133 | 494.4 |
| C | 5 | 112 | 281267 | 564.57 | 2122 | 2133 | 494.4 |
| C | 10 | 91 | 253232 | 507.86 | 2122 | 2133 | 494.4 |
| D | 1 | 52 | 443138 | 851.0 | 2146 | 2088 | 518.3 |
| D | 8 | 195 | 299721 | 574.28 | 2146 | 2088 | 518.3 |
| D | 2 | 234 | 77023 | 144.59 | 2146 | 2088 | 518.3 |
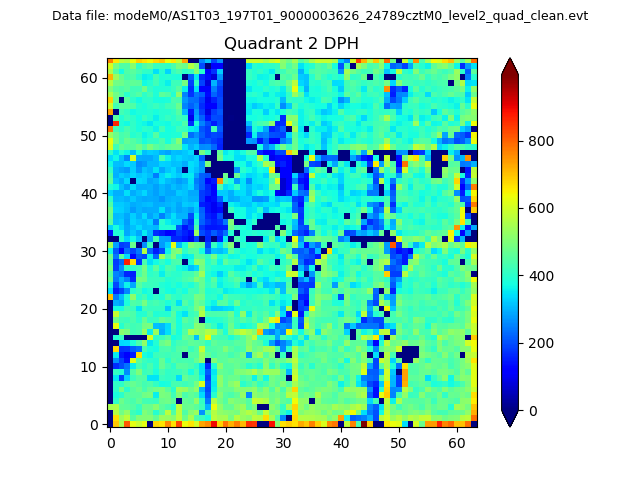
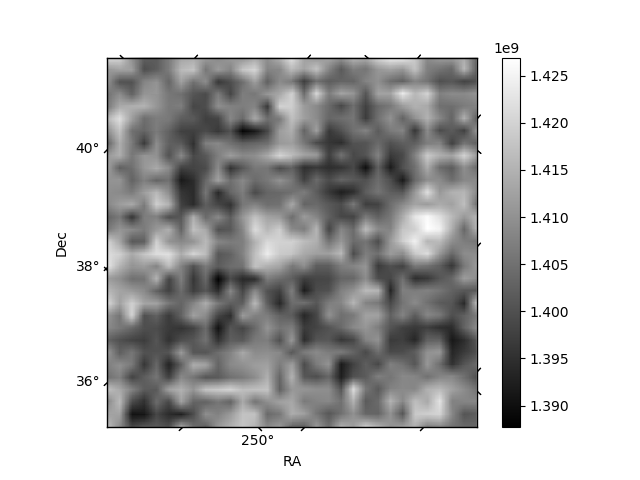
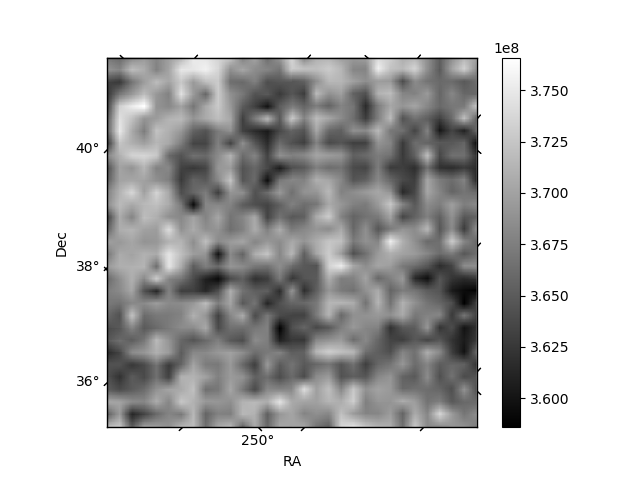
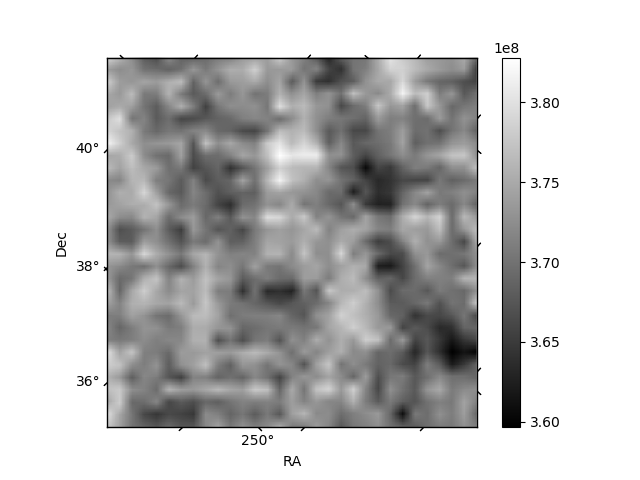
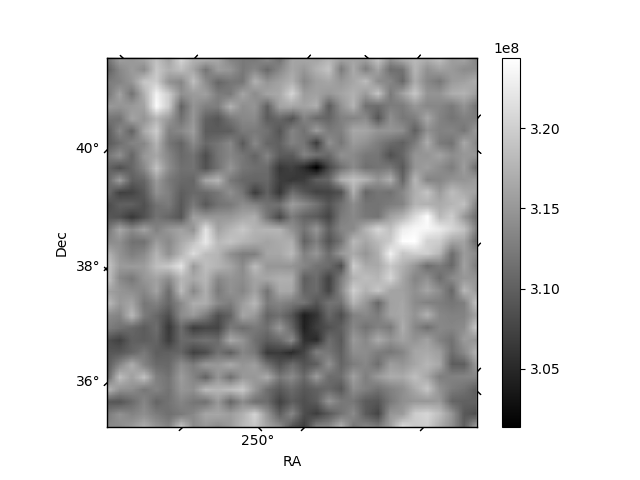
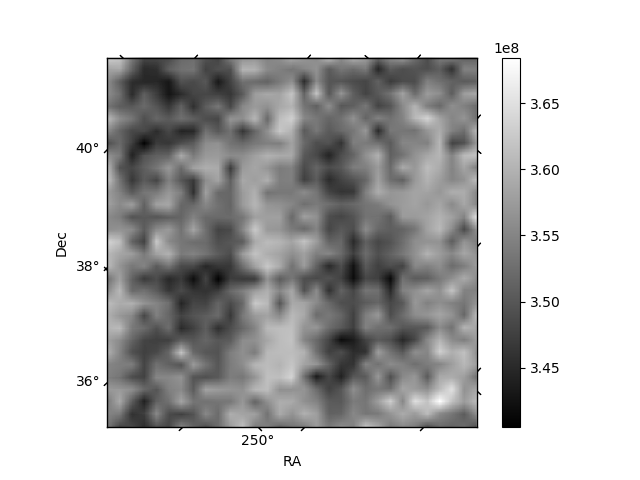
Histogram calculated using DETX and DETY for each event in the final _common_clean file
| Quadrant A | 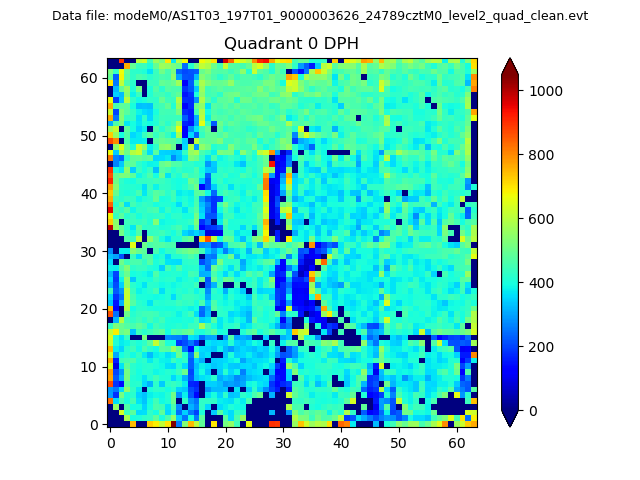 |
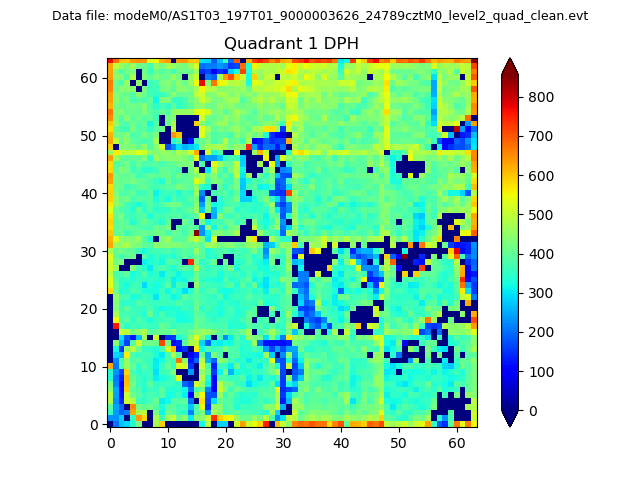 |
Quadrant B |
|---|---|---|---|
| Quadrant D | 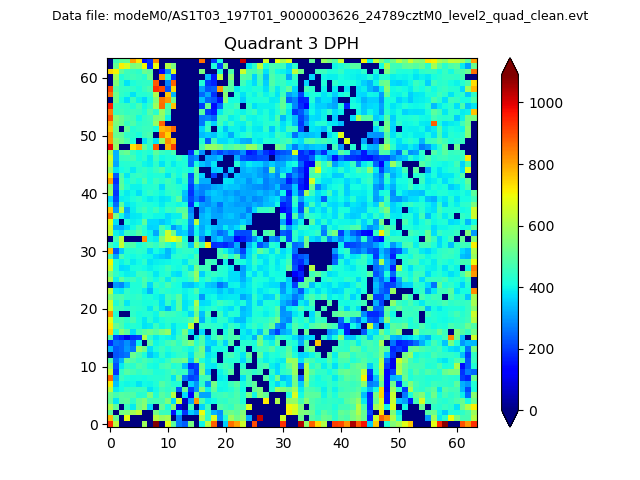 |
 |
Quadrant C |
| Plot type | Count rate plots | Images |
|---|---|---|
| Comparison with Poisson distribution Blue bars denote a histogram of data divided into 1 sec bins. Red curve is a Poisson curve with rate = median count rate of data. |
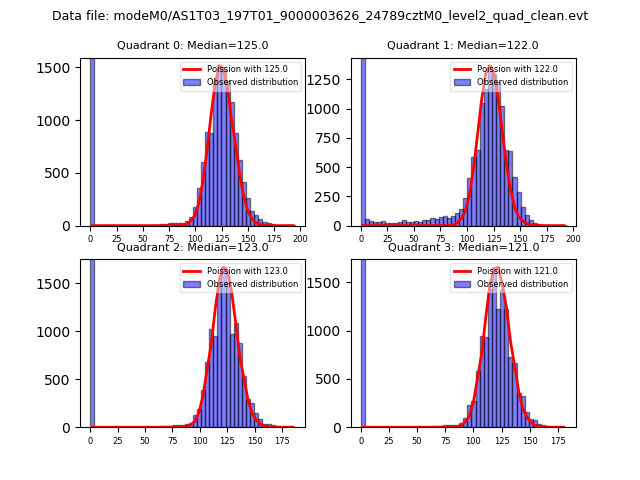 |
 |
| Quadrant-wise count rates Data is divided into 100 sec bins |
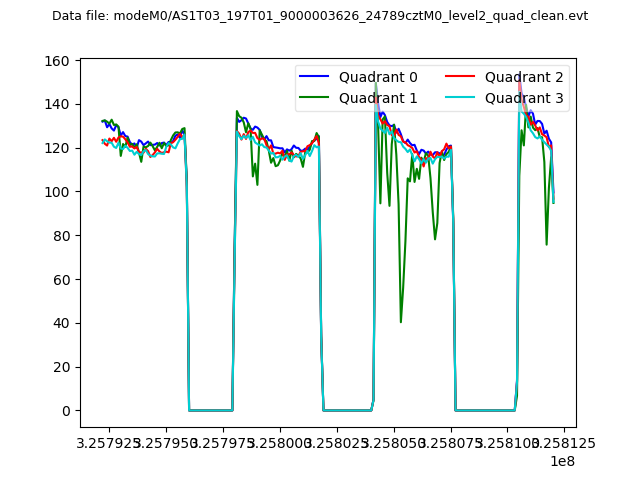 |
|
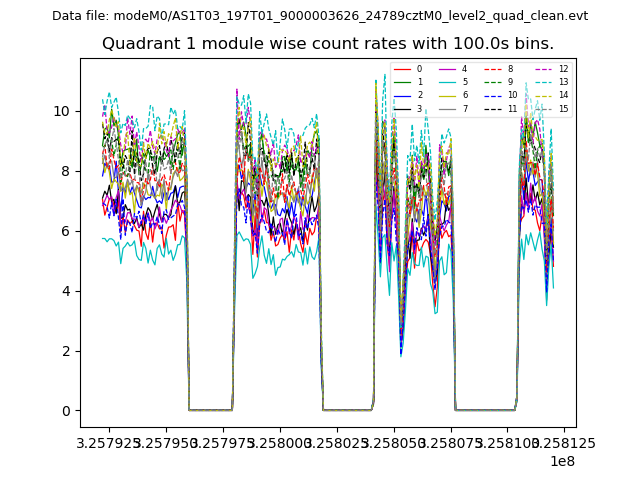
| Module-wise count rates for Quadrant A Data is divided into 100 sec bins |
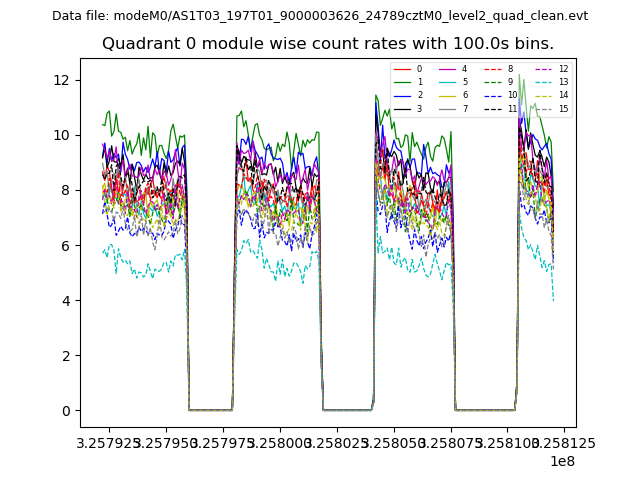 |
 |
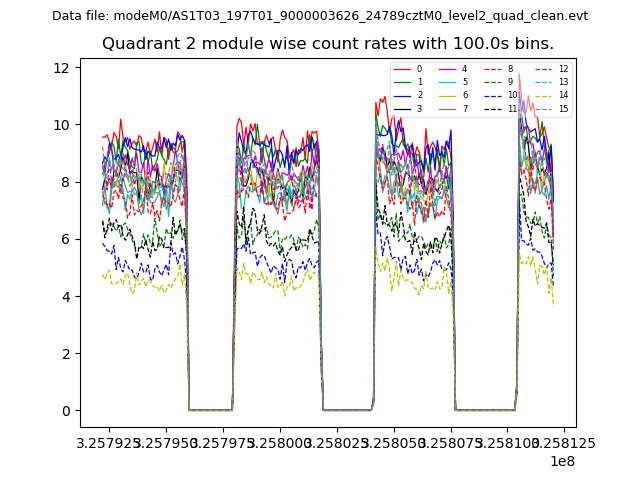
| Module-wise count rates for Quadrant B Data is divided into 100 sec bins |
 |
 |
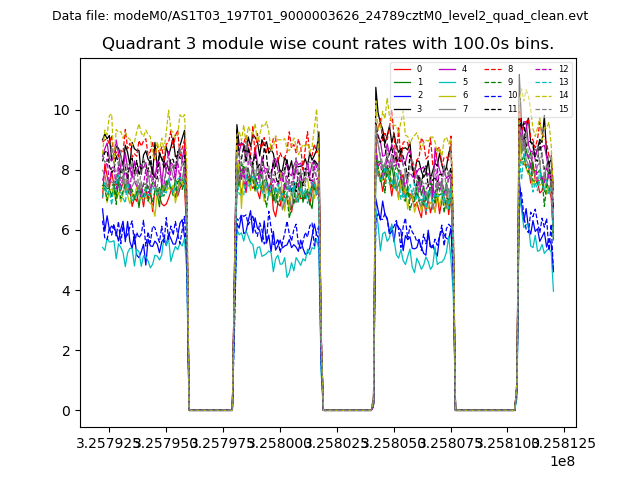
| Module-wise count rates for Quadrant C Data is divided into 100 sec bins |
 |
 |
| Module-wise count rates for Quadrant D Data is divided into 100 sec bins |
 |
 |
| Parameter | Plot |
|---|---|
| CZT HV Monitor | 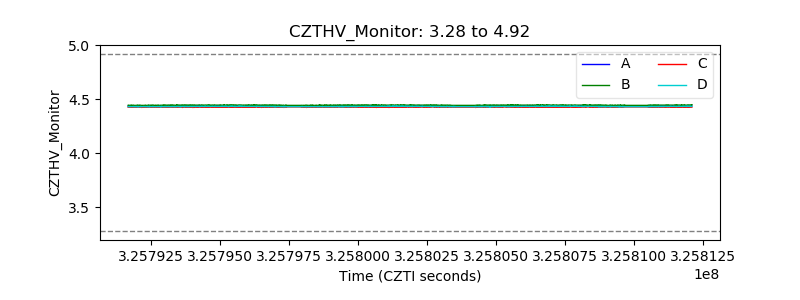 |
| D_VDD | 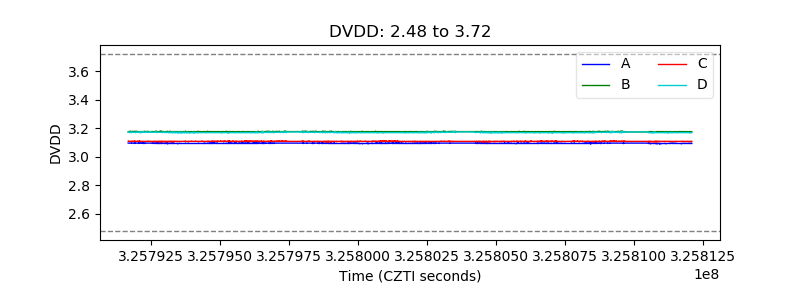 |
| Temperature 1 | 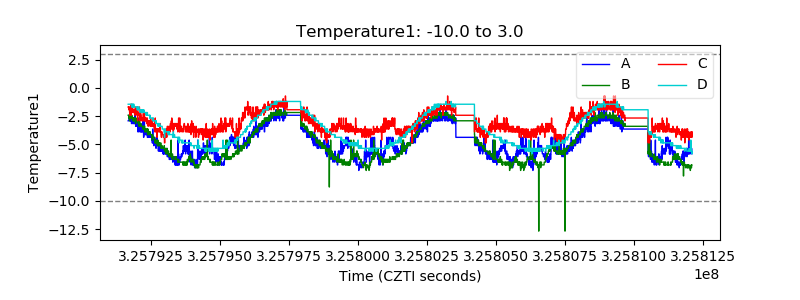 |
| Veto HV Monitor | 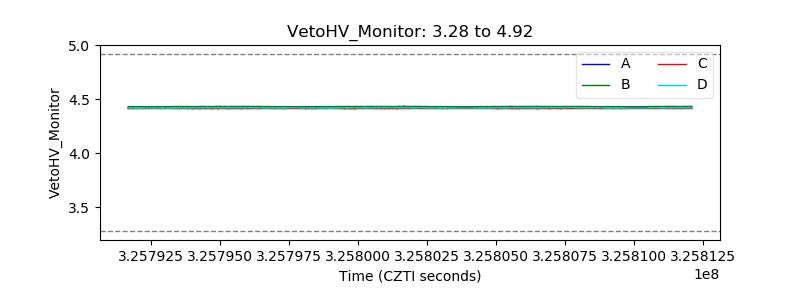 |
| Veto LLD | 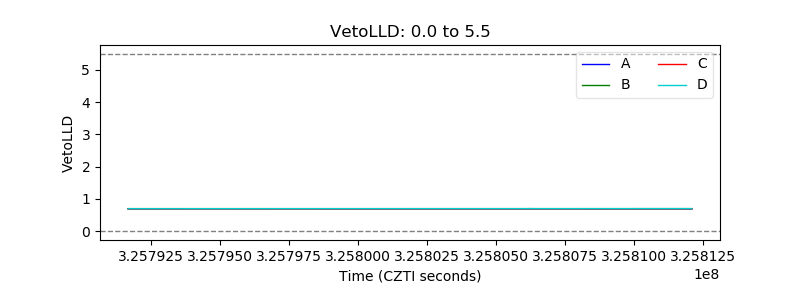 |
| Alpha Counter | 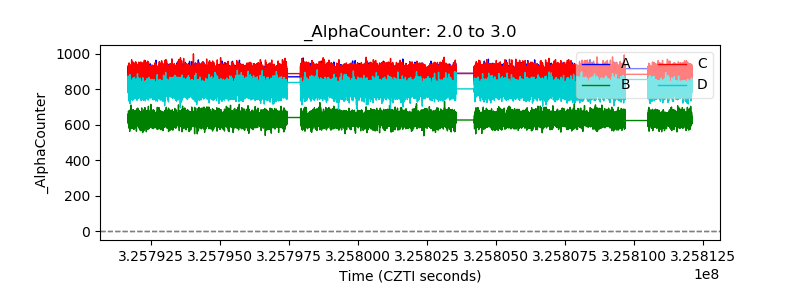 |
| _CPM_Rate | 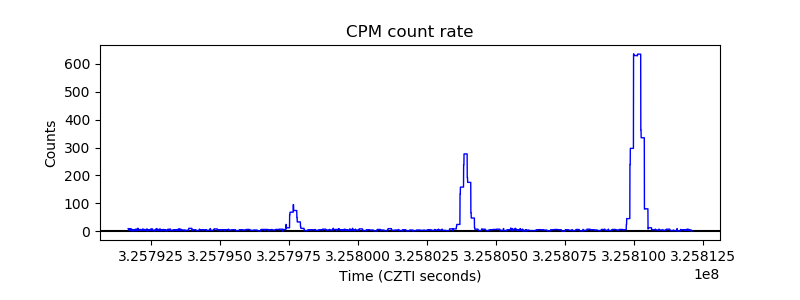 |
| CZT Counter | 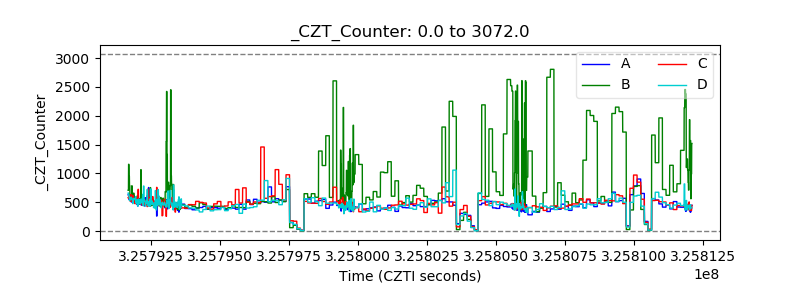 |
| +2.5 Volts monitor | 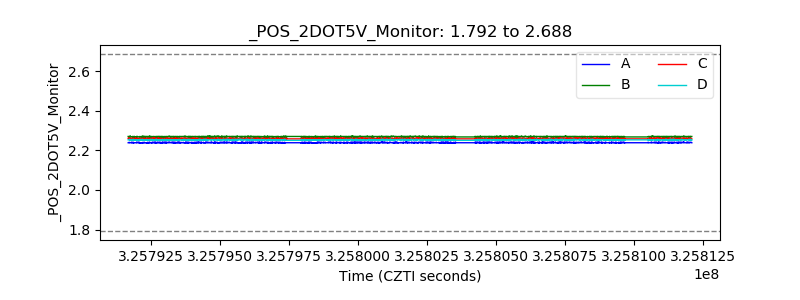 |
| +5 Volts monitor | 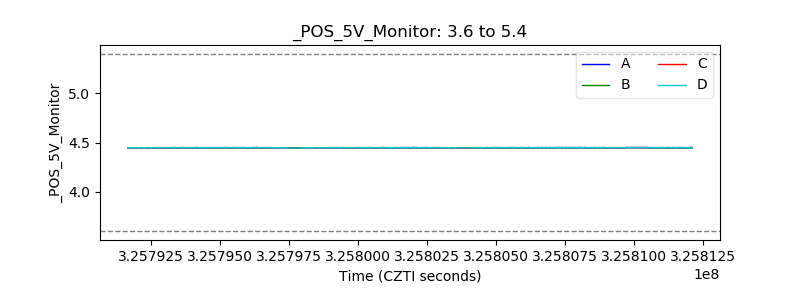 |
| _ROLL_ROT | 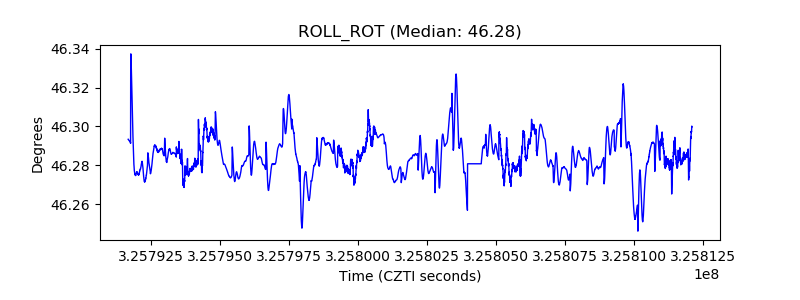 |
| _Roll_DEC | 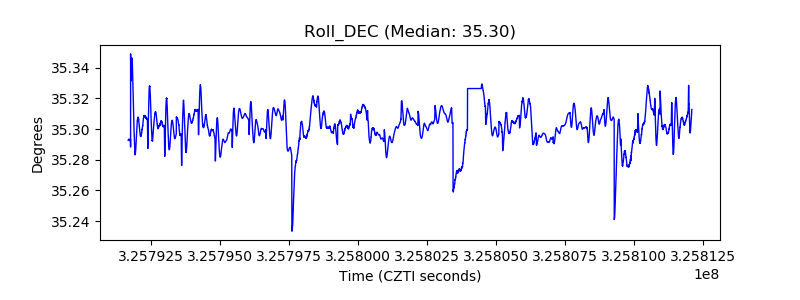 |
| _Roll_RA | 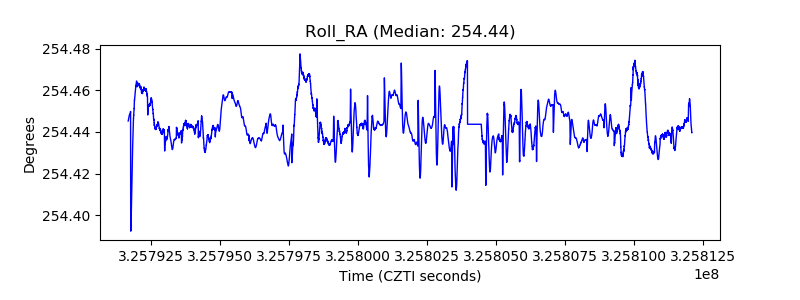 |
| Veto Counter | 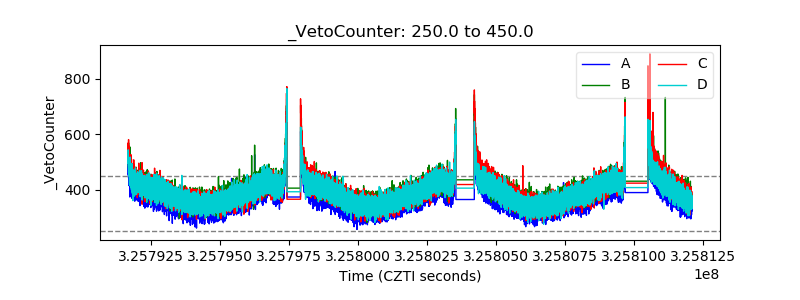 |