| Param | Original file | Final file |
|---|---|---|
| Filename | modeM0/AS1T03_197T01_9000003626_24792cztM0_level2.evt | modeM0/AS1T03_197T01_9000003626_24792cztM0_level2_quad_clean.evt |
| Size (bytes) | 555,580,800 | 98,562,240 |
| Size | 529.8 MB | 94.0 MB |
| Events in quadrant A | 3,216,422 | 654,990 |
| Events in quadrant B | 6,756,053 | 599,515 |
| Events in quadrant C | 3,282,998 | 635,966 |
| Events in quadrant D | 3,111,279 | 623,099 |
| Mode M9 | |||
|---|---|---|---|
| Quadrant | BADHDUFLAG | Total packets | Discarded packets |
| A | 0 | 20 | 0 |
| B | 0 | 20 | 0 |
| C | 0 | 20 | 0 |
| D | 0 | 20 | 0 |
| Mode SS | |||
|---|---|---|---|
| Quadrant | BADHDUFLAG | Total packets | Discarded packets |
| A | 0 | 138 | 0 |
| B | 0 | 138 | 0 |
| C | 0 | 138 | 0 |
| D | 0 | 138 | 0 |
| Mode M0 | |||
|---|---|---|---|
| Quadrant | BADHDUFLAG | Total packets | Discarded packets |
| A | 0 | 13894 | 6 |
| B | 0 | 24521 | 23 |
| C | 0 | 14135 | 6 |
| D | 0 | 13917 | 4 |
| Quadrant | Total seconds | Saturated seconds | Saturation percentage |
|---|---|---|---|
| A | 6756 | 27 | 0.399645% |
| B | 6755 | 1603 | 23.730570% |
| C | 6756 | 71 | 1.050918% |
| D | 6758 | 15 | 0.221959% |
Noise dominated data is calculated using 1-second bins in cleaned event files. If a bin has >2000 counts, and if more than 50% of those come from <1% of pixels, then it is considered to be noise-dominated and hence unusable.
| Quadrant | # 1 sec bins | Bins with >0 counts | Bins with >2000 counts | High rate bins dominated by noise | Noise dominated (total time) | Noise dominated (detector-on time) | Marked lightcurve |
|---|---|---|---|---|---|---|---|
| A | 8833 | 6760 | 0 | 0 | 0.00% | 0.00% | 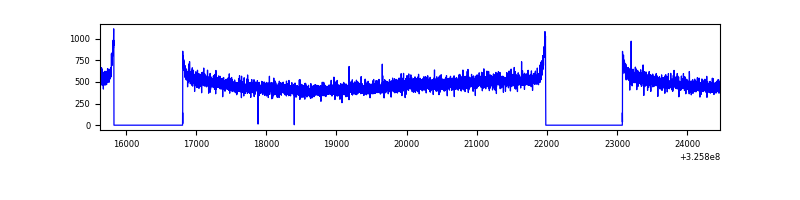 |
| B | 8833 | 6760 | 1353 | 1353 | 15.32% | 20.01% | 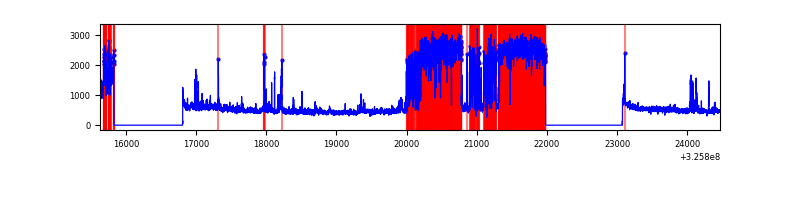 |
| C | 8833 | 6760 | 2 | 2 | 0.02% | 0.03% | 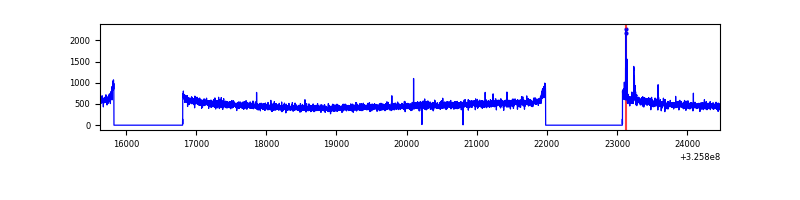 |
| D | 8834 | 6761 | 0 | 0 | 0.00% | 0.00% | 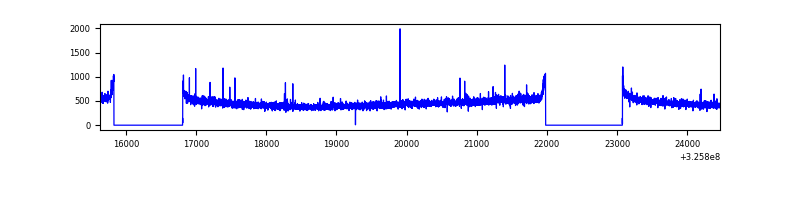 |
Top three noisy pixels from each quadrant. If the there are fewer than three noisy pixels in the level2.evt file, extra rows are filled as -1
| Pixel properties | Quadrant properties | ||||||
|---|---|---|---|---|---|---|---|
| Quadrant | DetID | PixID | Counts | Sigma | Mean | Median | Sigma |
| A | 13 | 254 | 10290 | 56.45 | 834 | 815 | 167.8 |
| A | 3 | 137 | 7671 | 40.85 | 834 | 815 | 167.8 |
| A | 0 | 226 | 7007 | 36.89 | 834 | 815 | 167.8 |
| B | 3 | 64 | 3862135 | 29000.16 | 702 | 685 | 133.2 |
| B | 0 | 189 | 110780 | 826.83 | 702 | 685 | 133.2 |
| B | 12 | 111 | 16219 | 116.66 | 702 | 685 | 133.2 |
| C | 14 | 238 | 127530 | 682.75 | 799 | 803 | 185.6 |
| C | 2 | 16 | 26579 | 138.87 | 799 | 803 | 185.6 |
| C | 10 | 91 | 9261 | 45.57 | 799 | 803 | 185.6 |
| D | 8 | 195 | 44580 | 222.87 | 807 | 783 | 196.5 |
| D | 2 | 234 | 24397 | 120.16 | 807 | 783 | 196.5 |
| D | 1 | 52 | 19929 | 97.43 | 807 | 783 | 196.5 |
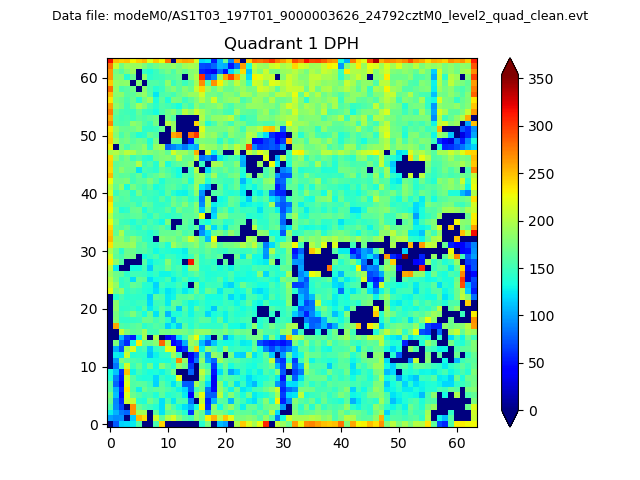
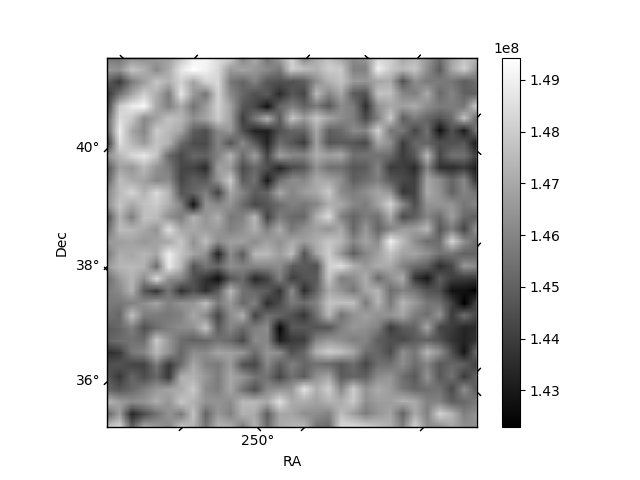
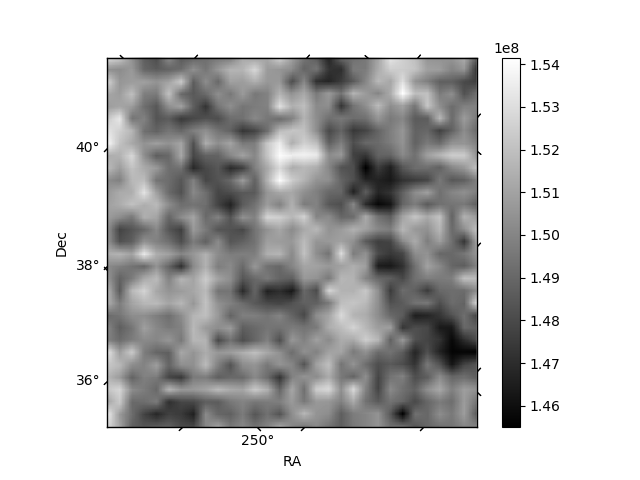
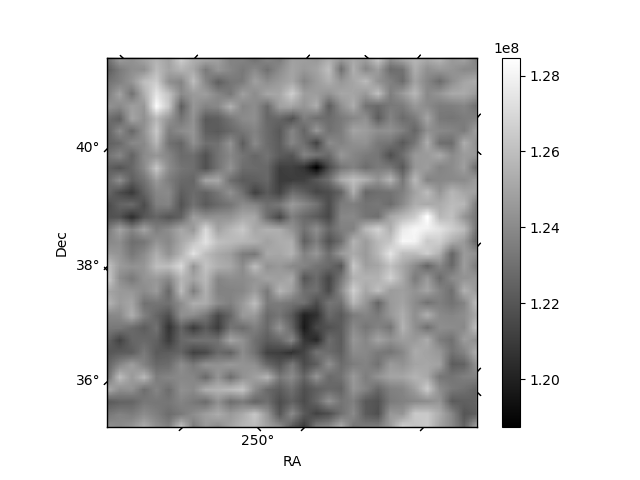
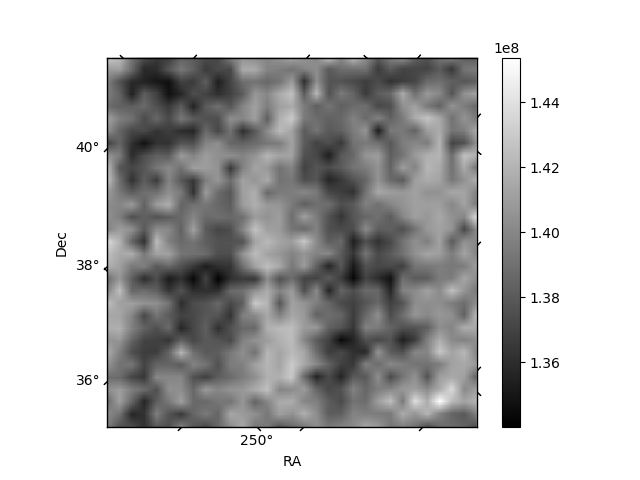
Histogram calculated using DETX and DETY for each event in the final _common_clean file
| Quadrant A |  |
 |
Quadrant B |
|---|---|---|---|
| Quadrant D |  |
 |
Quadrant C |
| Plot type | Count rate plots | Images |
|---|---|---|
| Comparison with Poisson distribution Blue bars denote a histogram of data divided into 1 sec bins. Red curve is a Poisson curve with rate = median count rate of data. |
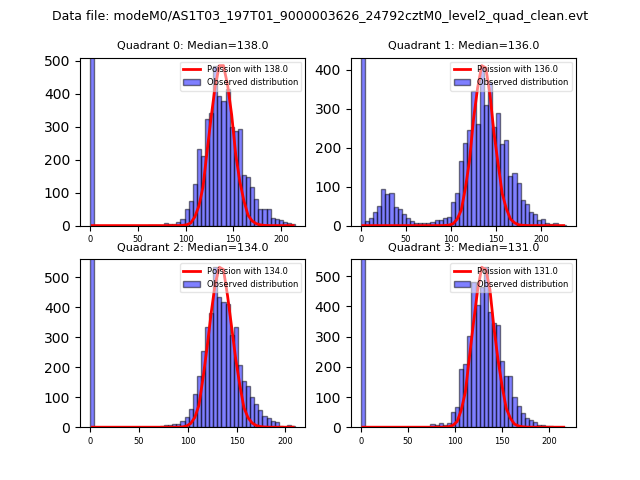 |
 |
| Quadrant-wise count rates Data is divided into 100 sec bins |
 |
|
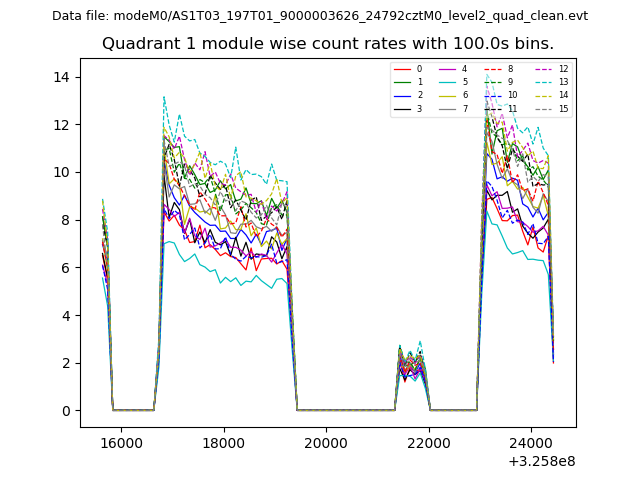
| Module-wise count rates for Quadrant A Data is divided into 100 sec bins |
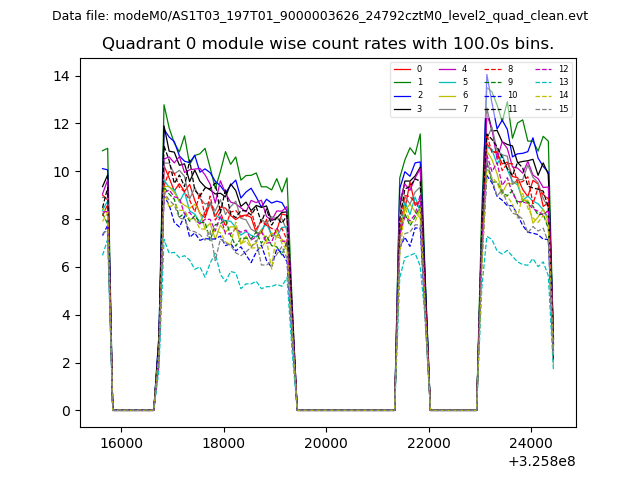 |
 |
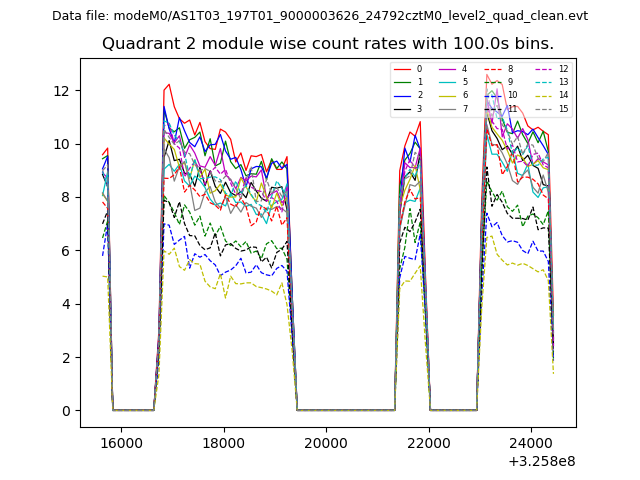
| Module-wise count rates for Quadrant B Data is divided into 100 sec bins |
 |
 |
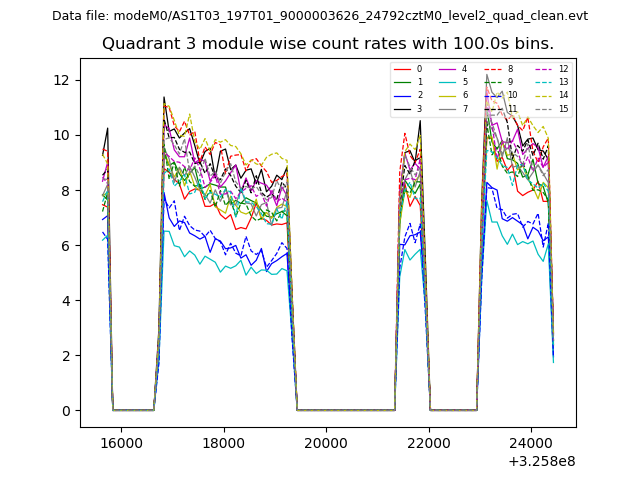
| Module-wise count rates for Quadrant C Data is divided into 100 sec bins |
 |
 |
| Module-wise count rates for Quadrant D Data is divided into 100 sec bins |
 |
 |
| Parameter | Plot |
|---|---|
| CZT HV Monitor | 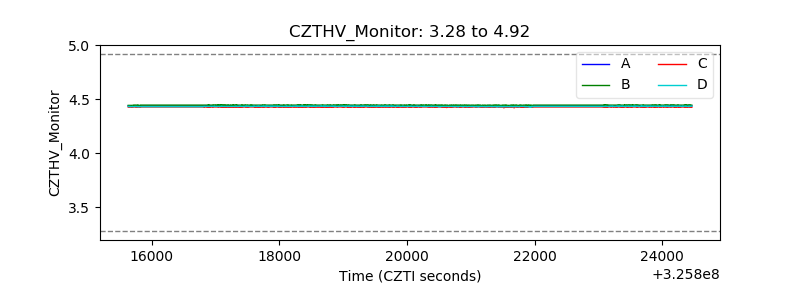 |
| D_VDD | 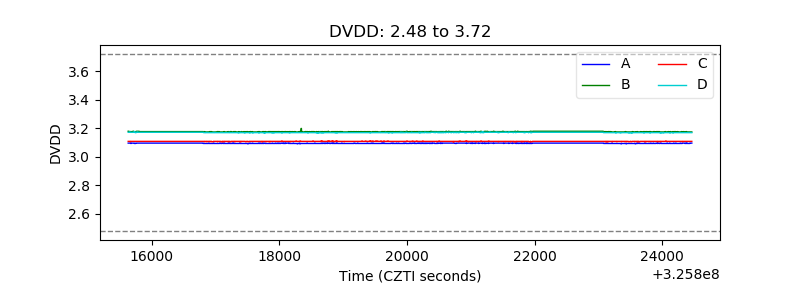 |
| Temperature 1 | 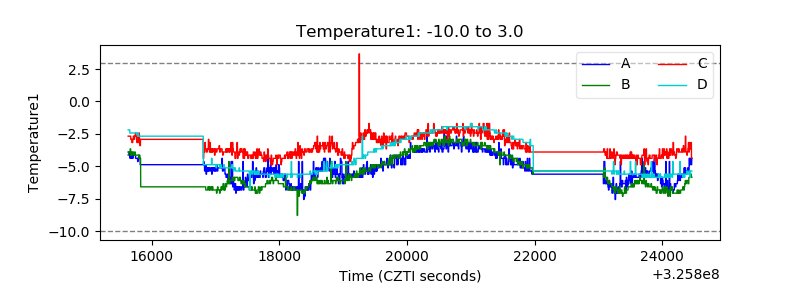 |
| Veto HV Monitor | 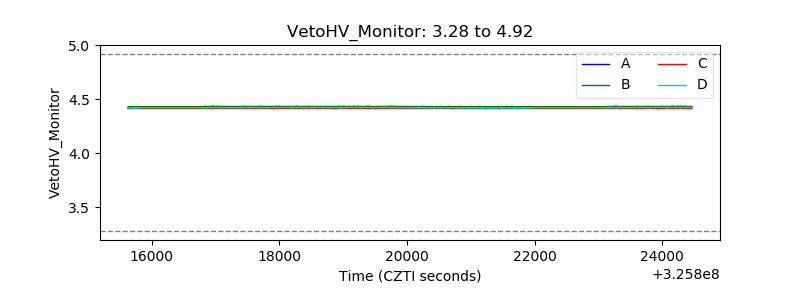 |
| Veto LLD | 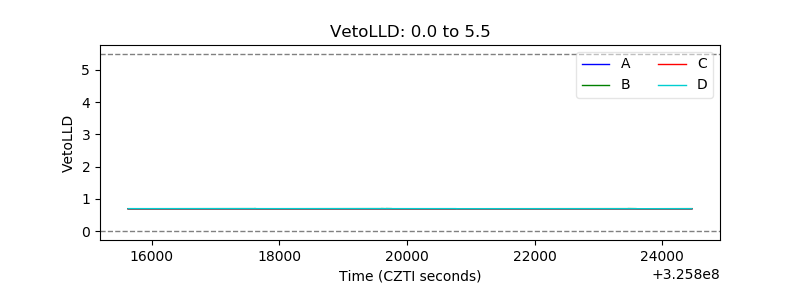 |
| Alpha Counter | 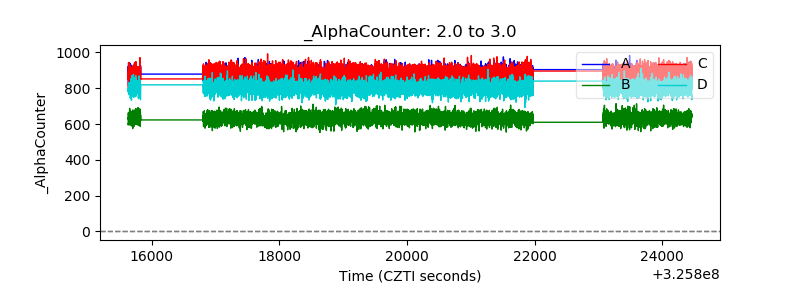 |
| _CPM_Rate | 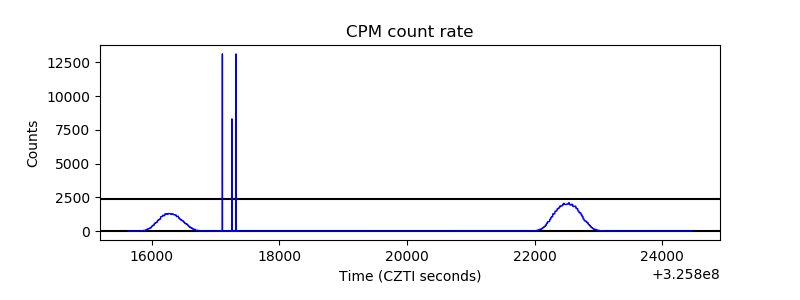 |
| CZT Counter |  |
| +2.5 Volts monitor |  |
| +5 Volts monitor |  |
| _ROLL_ROT | 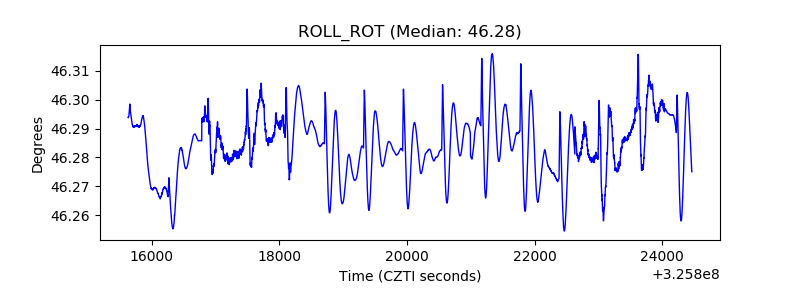 |
| _Roll_DEC | 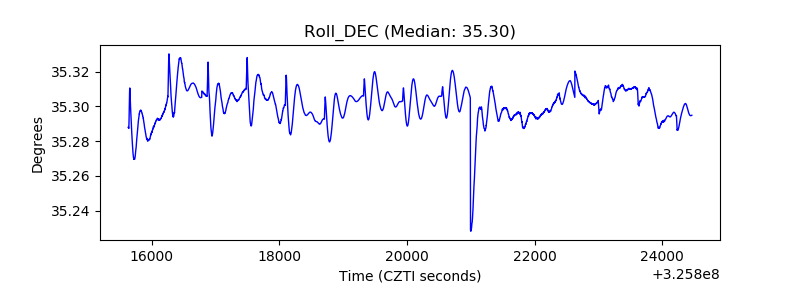 |
| _Roll_RA | 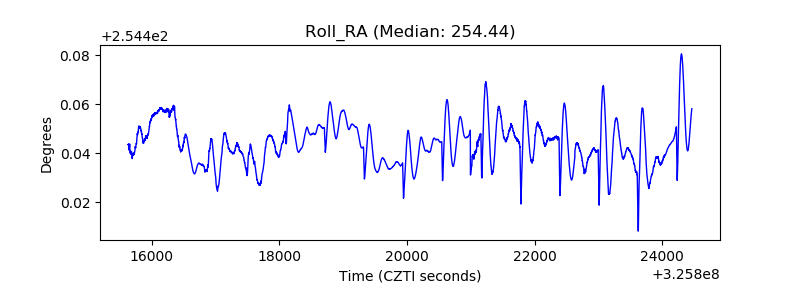 |
| Veto Counter | 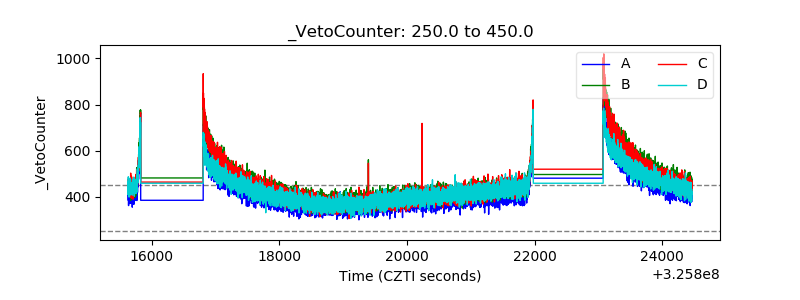 |