| Param | Original file | Final file |
|---|---|---|
| Filename | modeM0/AS1T03_197T01_9000003626_24793cztM0_level2.evt | modeM0/AS1T03_197T01_9000003626_24793cztM0_level2_quad_clean.evt |
| Size (bytes) | 579,525,120 | 100,471,680 |
| Size | 552.7 MB | 95.8 MB |
| Events in quadrant A | 3,245,249 | 684,974 |
| Events in quadrant B | 7,427,085 | 592,944 |
| Events in quadrant C | 3,281,264 | 655,965 |
| Events in quadrant D | 3,149,364 | 648,041 |
| Mode M9 | |||
|---|---|---|---|
| Quadrant | BADHDUFLAG | Total packets | Discarded packets |
| A | 0 | 16 | 0 |
| B | 0 | 17 | 0 |
| C | 0 | 17 | 0 |
| D | 0 | 17 | 0 |
| Mode SS | |||
|---|---|---|---|
| Quadrant | BADHDUFLAG | Total packets | Discarded packets |
| A | 0 | 136 | 0 |
| B | 0 | 136 | 0 |
| C | 0 | 136 | 0 |
| D | 0 | 136 | 0 |
| Mode M0 | |||
|---|---|---|---|
| Quadrant | BADHDUFLAG | Total packets | Discarded packets |
| A | 0 | 13628 | 2 |
| B | 0 | 26460 | 2 |
| C | 0 | 13842 | 2 |
| D | 0 | 13683 | 2 |
| Quadrant | Total seconds | Saturated seconds | Saturation percentage |
|---|---|---|---|
| A | 6596 | 19 | 0.288053% |
| B | 6596 | 1622 | 24.590661% |
| C | 6596 | 52 | 0.788357% |
| D | 6596 | 10 | 0.151607% |
Noise dominated data is calculated using 1-second bins in cleaned event files. If a bin has >2000 counts, and if more than 50% of those come from <1% of pixels, then it is considered to be noise-dominated and hence unusable.
| Quadrant | # 1 sec bins | Bins with >0 counts | Bins with >2000 counts | High rate bins dominated by noise | Noise dominated (total time) | Noise dominated (detector-on time) | Marked lightcurve |
|---|---|---|---|---|---|---|---|
| A | 7806 | 6597 | 0 | 0 | 0.00% | 0.00% | 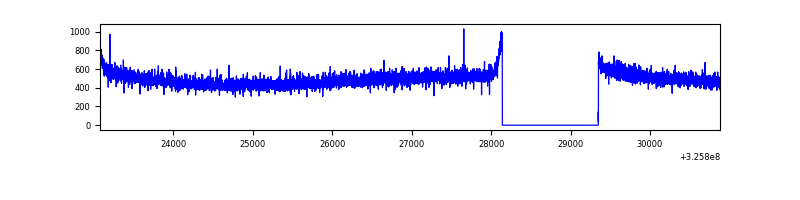 |
| B | 7806 | 6597 | 1403 | 1403 | 17.97% | 21.27% | 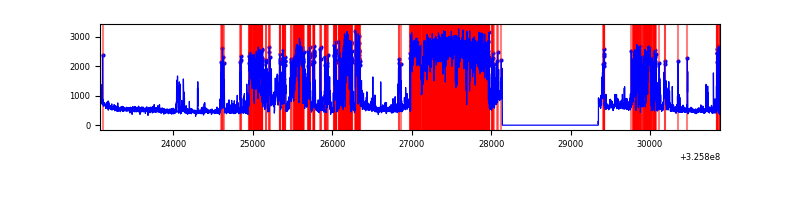 |
| C | 7806 | 6597 | 2 | 2 | 0.03% | 0.03% | 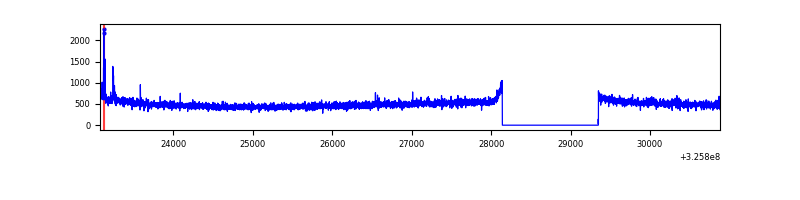 |
| D | 7806 | 6597 | 1 | 1 | 0.01% | 0.02% | 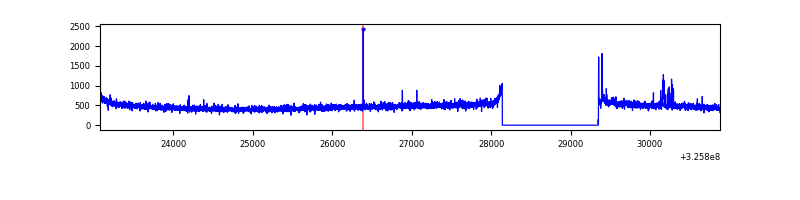 |
Top three noisy pixels from each quadrant. If the there are fewer than three noisy pixels in the level2.evt file, extra rows are filled as -1
| Pixel properties | Quadrant properties | ||||||
|---|---|---|---|---|---|---|---|
| Quadrant | DetID | PixID | Counts | Sigma | Mean | Median | Sigma |
| A | 13 | 254 | 9281 | 50.71 | 842 | 826 | 166.7 |
| A | 3 | 137 | 7435 | 39.63 | 842 | 826 | 166.7 |
| A | 0 | 226 | 7029 | 37.2 | 842 | 826 | 166.7 |
| B | 3 | 64 | 4455223 | 33580.62 | 702 | 685 | 132.7 |
| B | 0 | 189 | 193006 | 1449.82 | 702 | 685 | 132.7 |
| B | 12 | 111 | 15832 | 114.19 | 702 | 685 | 132.7 |
| C | 14 | 238 | 128333 | 692.28 | 798 | 803 | 184.2 |
| C | 2 | 16 | 26343 | 138.64 | 798 | 803 | 184.2 |
| C | 10 | 91 | 7876 | 38.39 | 798 | 803 | 184.2 |
| D | 1 | 52 | 37601 | 190.77 | 809 | 786 | 193.0 |
| D | 2 | 244 | 31936 | 161.41 | 809 | 786 | 193.0 |
| D | 8 | 195 | 24812 | 124.5 | 809 | 786 | 193.0 |
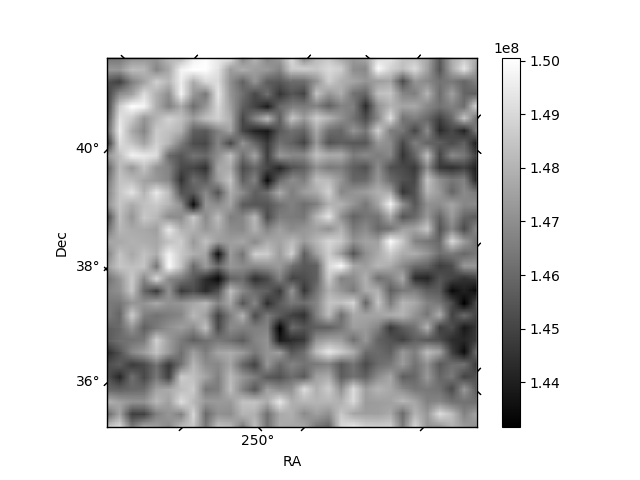
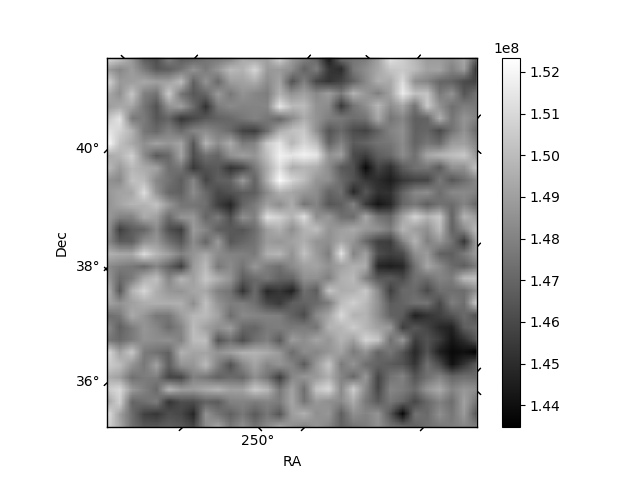
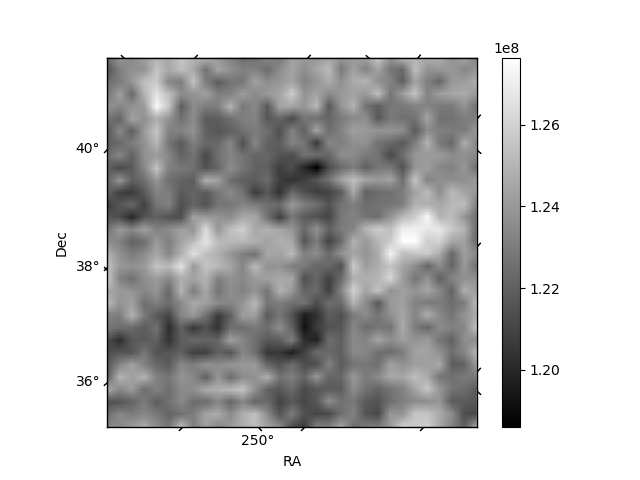
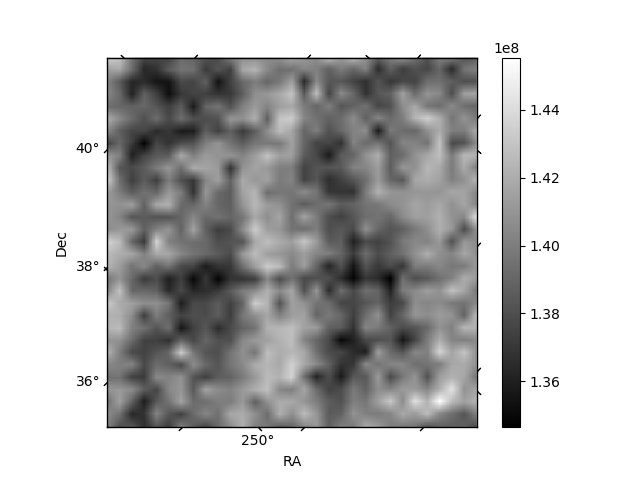
Histogram calculated using DETX and DETY for each event in the final _common_clean file
| Quadrant A | 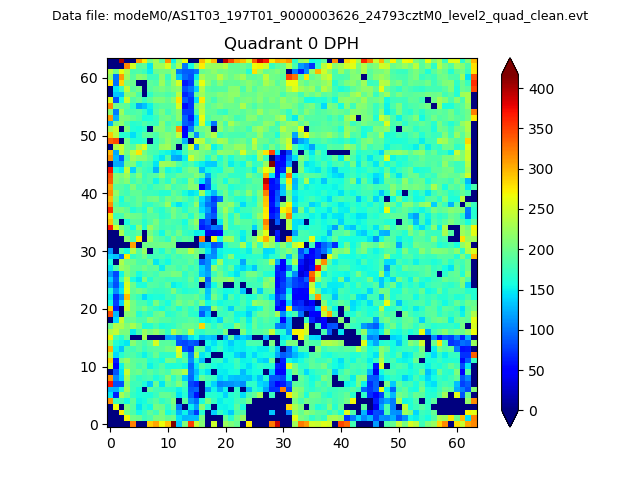 |
 |
Quadrant B |
|---|---|---|---|
| Quadrant D | 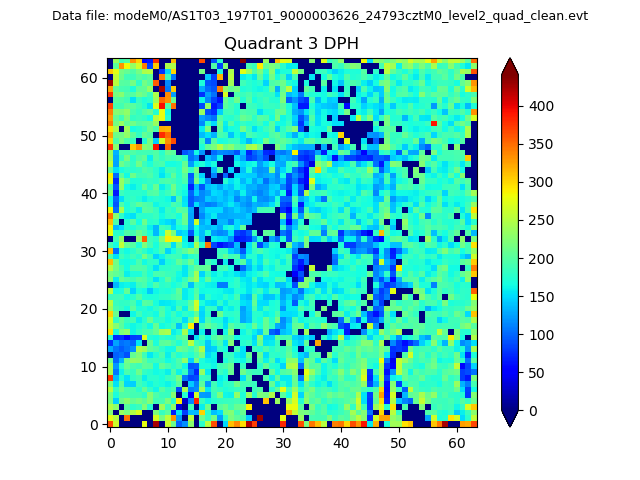 |
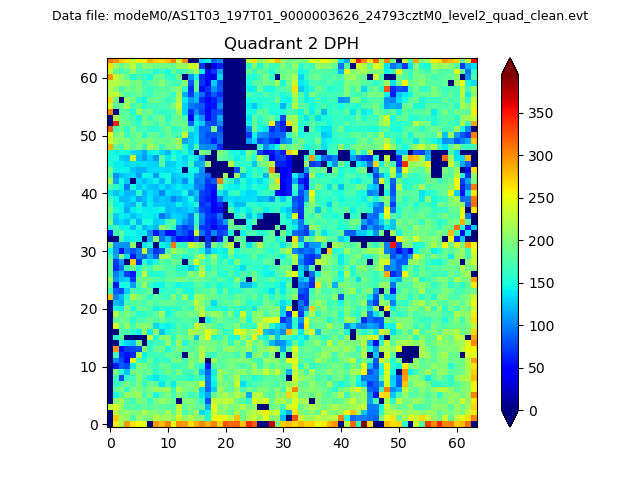 |
Quadrant C |
| Plot type | Count rate plots | Images |
|---|---|---|
| Comparison with Poisson distribution Blue bars denote a histogram of data divided into 1 sec bins. Red curve is a Poisson curve with rate = median count rate of data. |
 |
 |
| Quadrant-wise count rates Data is divided into 100 sec bins |
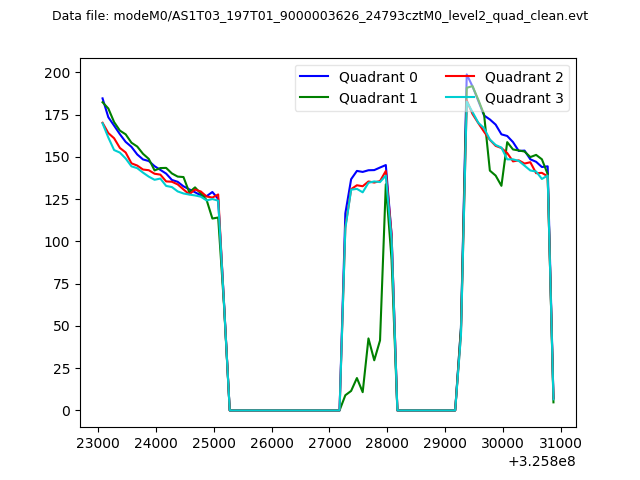 |
|
| Module-wise count rates for Quadrant A Data is divided into 100 sec bins |
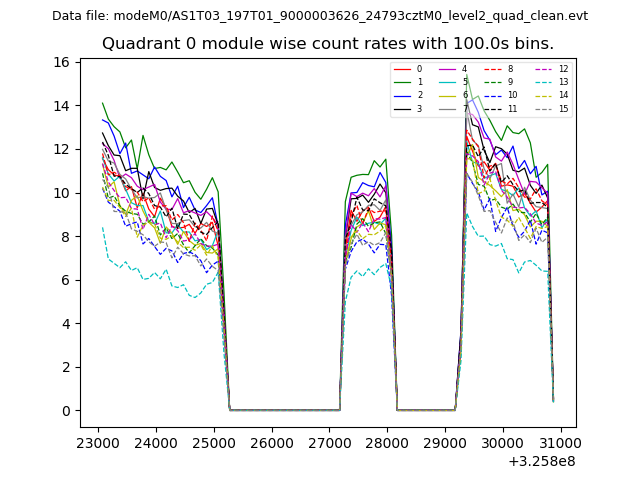 |
 |
| Module-wise count rates for Quadrant B Data is divided into 100 sec bins |
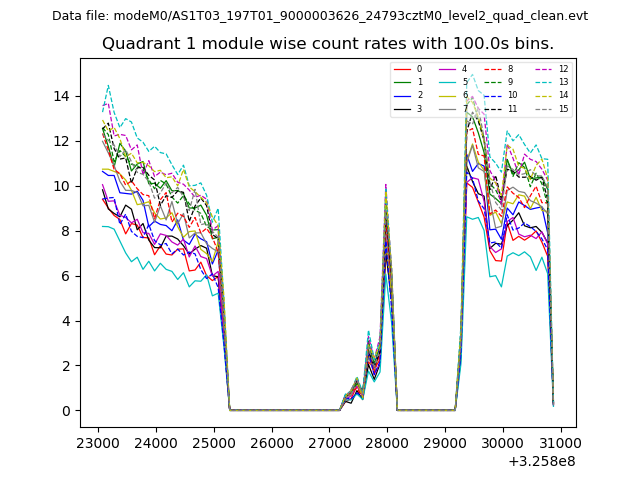 |
 |
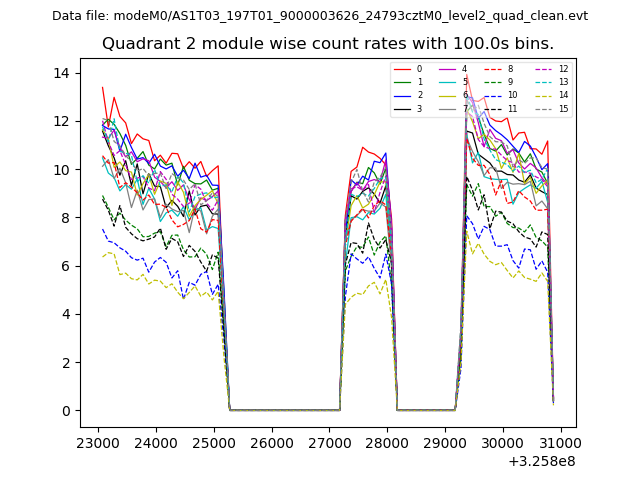
| Module-wise count rates for Quadrant C Data is divided into 100 sec bins |
 |
 |
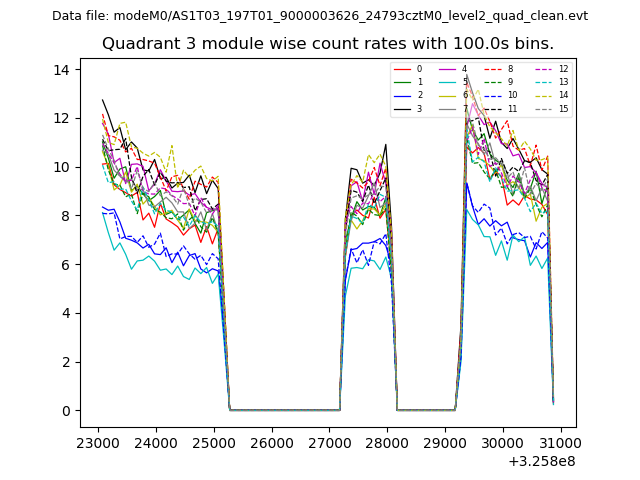
| Module-wise count rates for Quadrant D Data is divided into 100 sec bins |
 |
 |
| Parameter | Plot |
|---|---|
| CZT HV Monitor | 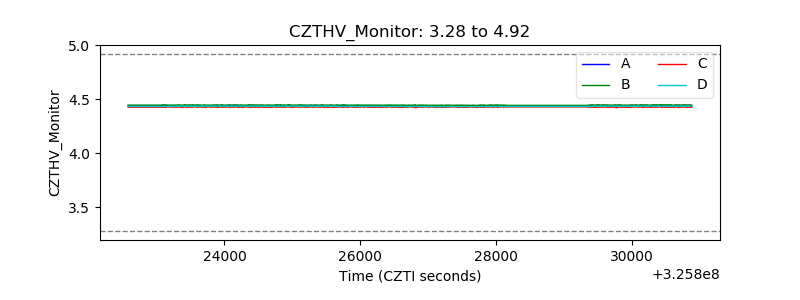 |
| D_VDD |  |
| Temperature 1 | 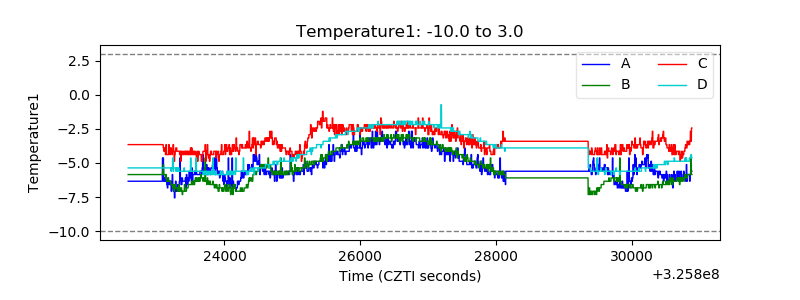 |
| Veto HV Monitor | 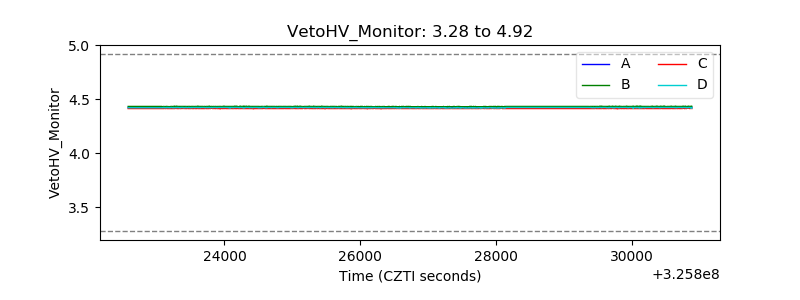 |
| Veto LLD | 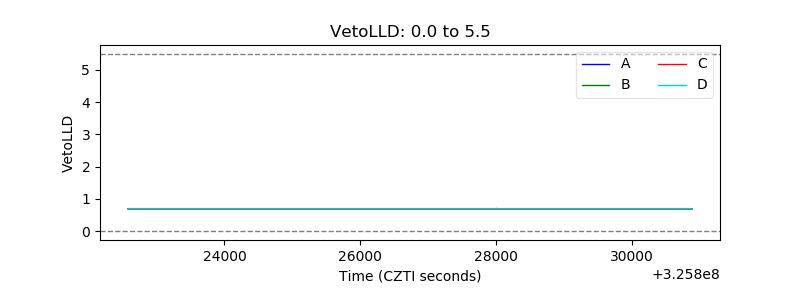 |
| Alpha Counter | 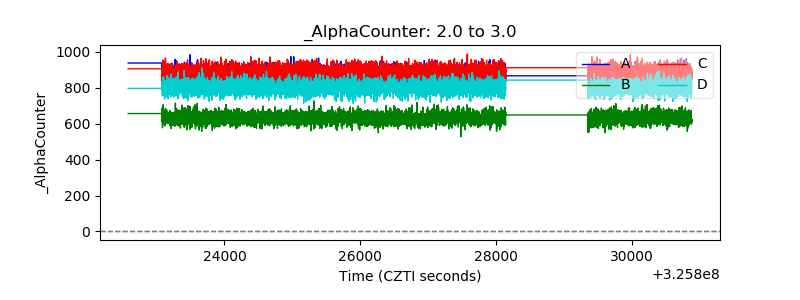 |
| _CPM_Rate |  |
| CZT Counter | 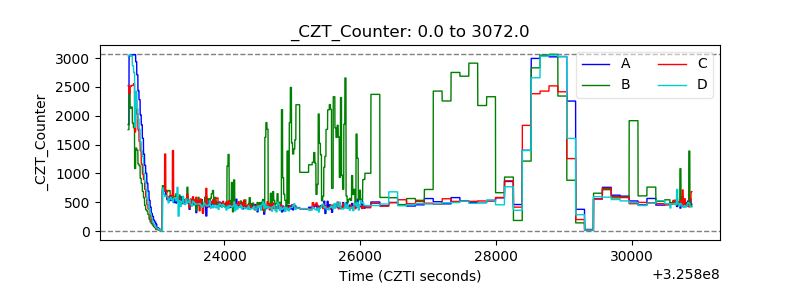 |
| +2.5 Volts monitor |  |
| +5 Volts monitor |  |
| _ROLL_ROT | 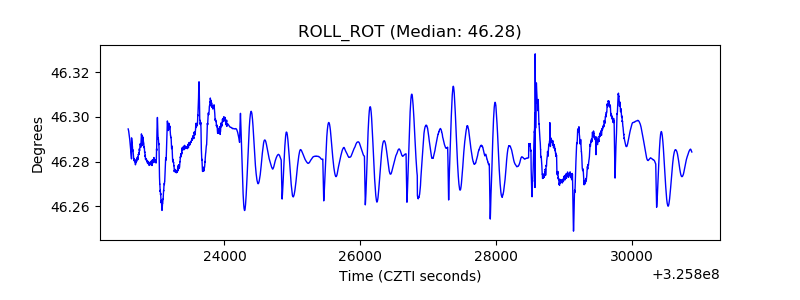 |
| _Roll_DEC | 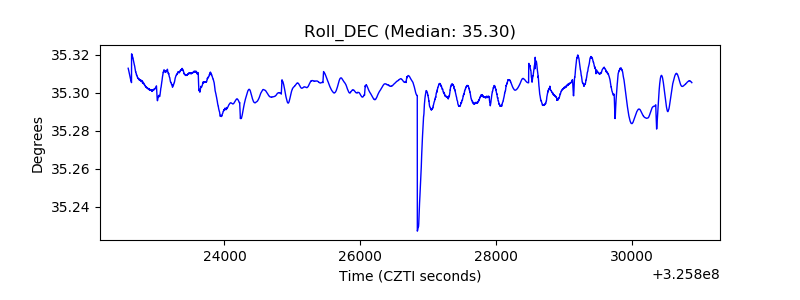 |
| _Roll_RA | 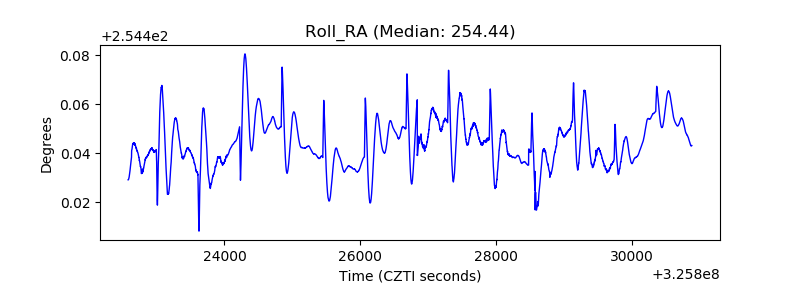 |
| Veto Counter | 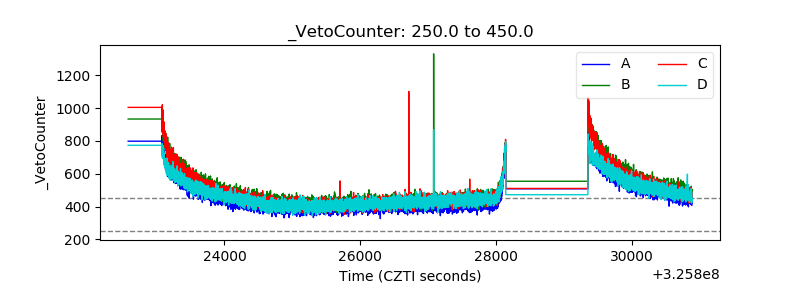 |