| Param | Original file | Final file |
|---|---|---|
| Filename | modeM0/AS1T03_197T01_9000003626_24795cztM0_level2.evt | modeM0/AS1T03_197T01_9000003626_24795cztM0_level2_quad_clean.evt |
| Size (bytes) | 459,645,120 | 78,903,360 |
| Size | 438.4 MB | 75.2 MB |
| Events in quadrant A | 3,127,529 | 510,248 |
| Events in quadrant B | 4,172,121 | 493,485 |
| Events in quadrant C | 3,117,583 | 486,589 |
| Events in quadrant D | 3,098,754 | 483,004 |
| Mode M9 | |||
|---|---|---|---|
| Quadrant | BADHDUFLAG | Total packets | Discarded packets |
| A | 0 | 13 | 0 |
| B | 0 | 13 | 0 |
| C | 0 | 13 | 0 |
| D | 0 | 13 | 0 |
| Mode SS | |||
|---|---|---|---|
| Quadrant | BADHDUFLAG | Total packets | Discarded packets |
| A | 0 | 120 | 0 |
| B | 0 | 120 | 0 |
| C | 0 | 120 | 0 |
| D | 0 | 120 | 0 |
| Mode M0 | |||
|---|---|---|---|
| Quadrant | BADHDUFLAG | Total packets | Discarded packets |
| A | 0 | 12517 | 1 |
| B | 0 | 15977 | 1 |
| C | 0 | 12550 | 1 |
| D | 0 | 12731 | 1 |
| Quadrant | Total seconds | Saturated seconds | Saturation percentage |
|---|---|---|---|
| A | 5956 | 45 | 0.755541% |
| B | 5957 | 449 | 7.537351% |
| C | 5957 | 65 | 1.091153% |
| D | 5957 | 37 | 0.621118% |
Noise dominated data is calculated using 1-second bins in cleaned event files. If a bin has >2000 counts, and if more than 50% of those come from <1% of pixels, then it is considered to be noise-dominated and hence unusable.
| Quadrant | # 1 sec bins | Bins with >0 counts | Bins with >2000 counts | High rate bins dominated by noise | Noise dominated (total time) | Noise dominated (detector-on time) | Marked lightcurve |
|---|---|---|---|---|---|---|---|
| A | 7266 | 5957 | 0 | 0 | 0.00% | 0.00% | 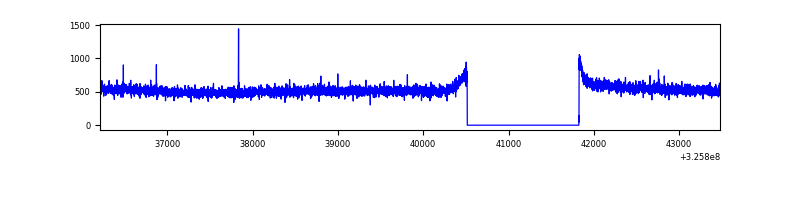 |
| B | 7267 | 5958 | 247 | 247 | 3.40% | 4.15% | 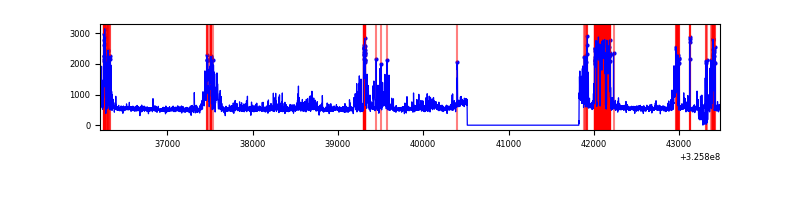 |
| C | 7267 | 5958 | 0 | 0 | 0.00% | 0.00% | 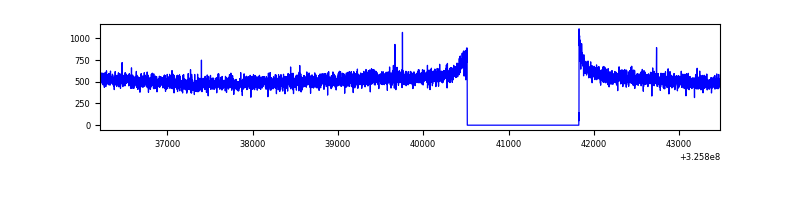 |
| D | 7267 | 5958 | 18 | 18 | 0.25% | 0.30% | 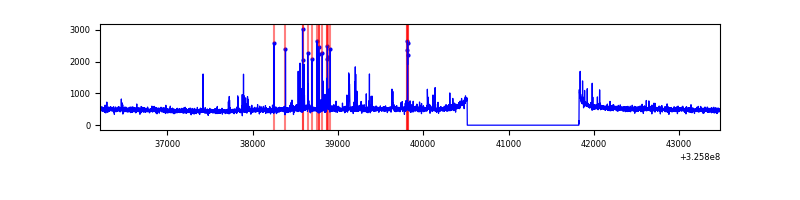 |
Top three noisy pixels from each quadrant. If the there are fewer than three noisy pixels in the level2.evt file, extra rows are filled as -1
| Pixel properties | Quadrant properties | ||||||
|---|---|---|---|---|---|---|---|
| Quadrant | DetID | PixID | Counts | Sigma | Mean | Median | Sigma |
| A | 13 | 254 | 9372 | 53.22 | 810 | 798 | 161.1 |
| A | 0 | 226 | 7028 | 38.67 | 810 | 798 | 161.1 |
| A | 3 | 137 | 7007 | 38.54 | 810 | 798 | 161.1 |
| B | 3 | 64 | 1049968 | 7305.18 | 763 | 747 | 143.6 |
| B | 0 | 189 | 126181 | 873.33 | 763 | 747 | 143.6 |
| B | 12 | 111 | 17101 | 113.86 | 763 | 747 | 143.6 |
| C | 14 | 238 | 122541 | 699.46 | 753 | 759 | 174.1 |
| C | 10 | 91 | 44483 | 251.13 | 753 | 759 | 174.1 |
| C | 7 | 247 | 13397 | 72.59 | 753 | 759 | 174.1 |
| D | 1 | 52 | 83714 | 449.25 | 773 | 750 | 184.7 |
| D | 8 | 195 | 33364 | 176.61 | 773 | 750 | 184.7 |
| D | 13 | 138 | 23839 | 125.03 | 773 | 750 | 184.7 |
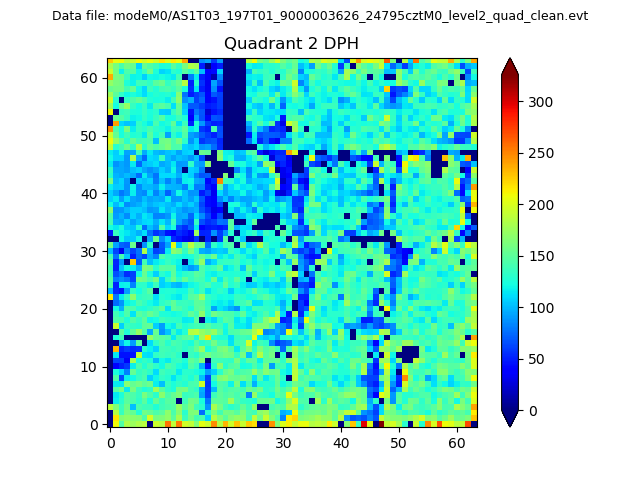
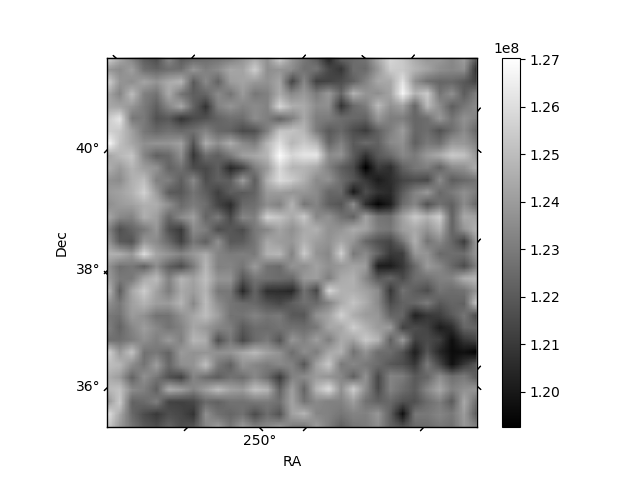
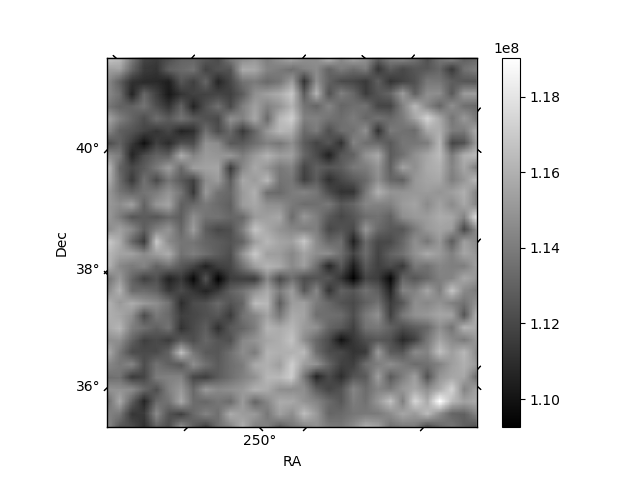
Histogram calculated using DETX and DETY for each event in the final _common_clean file
| Quadrant A | 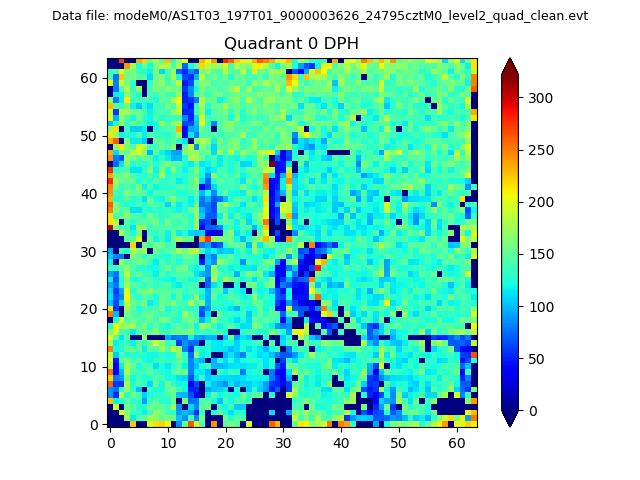 |
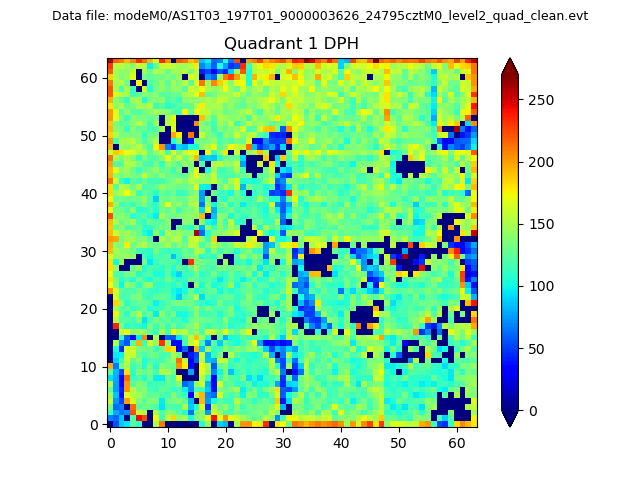 |
Quadrant B |
|---|---|---|---|
| Quadrant D | 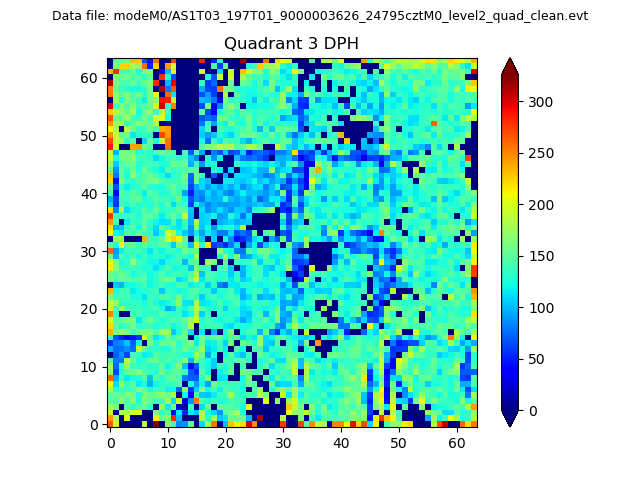 |
 |
Quadrant C |
| Plot type | Count rate plots | Images |
|---|---|---|
| Comparison with Poisson distribution Blue bars denote a histogram of data divided into 1 sec bins. Red curve is a Poisson curve with rate = median count rate of data. |
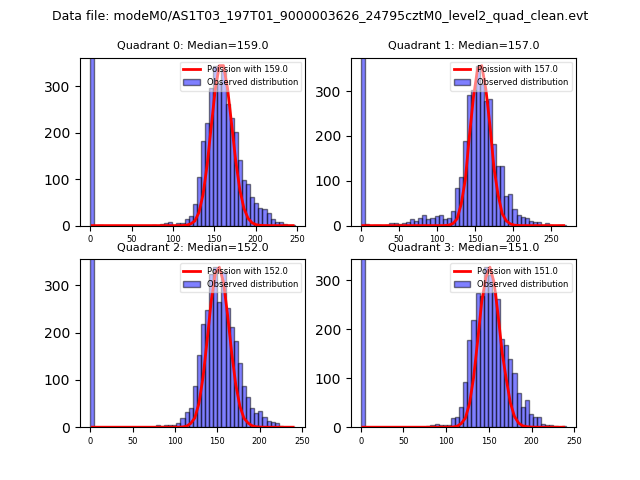 |
 |
| Quadrant-wise count rates Data is divided into 100 sec bins |
 |
|
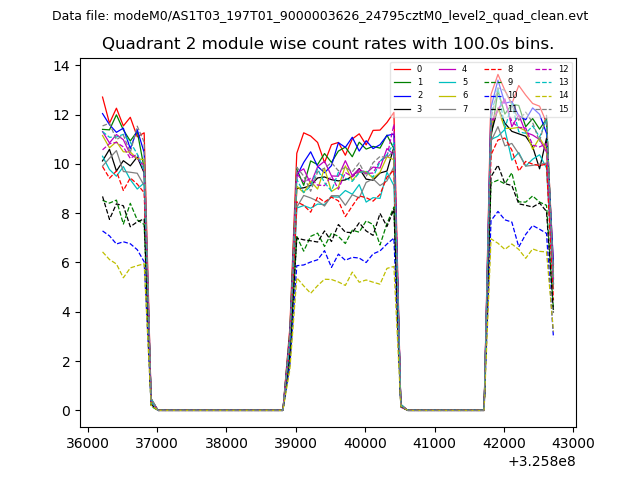
| Module-wise count rates for Quadrant A Data is divided into 100 sec bins |
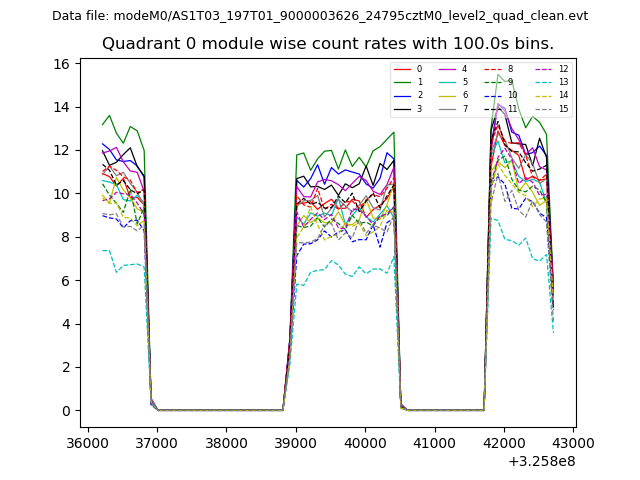 |
 |
| Module-wise count rates for Quadrant B Data is divided into 100 sec bins |
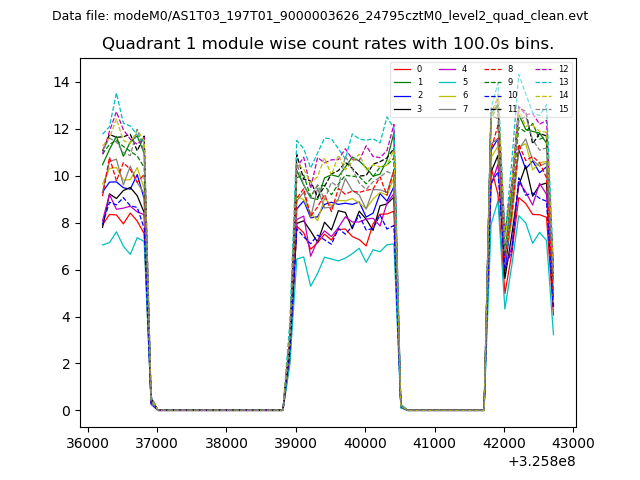 |
 |
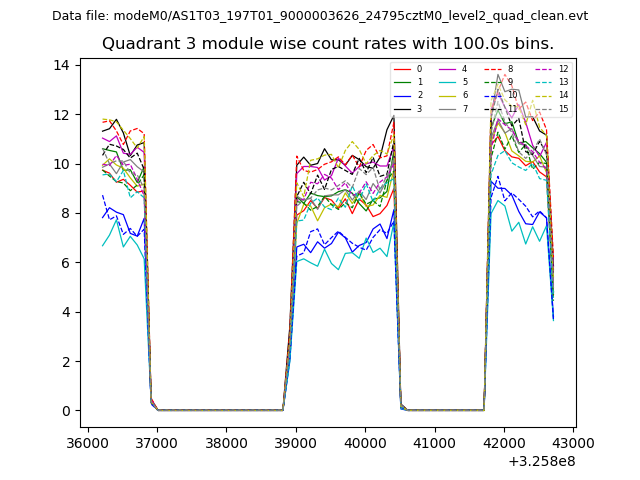
| Module-wise count rates for Quadrant C Data is divided into 100 sec bins |
 |
 |
| Module-wise count rates for Quadrant D Data is divided into 100 sec bins |
 |
 |
| Parameter | Plot |
|---|---|
| CZT HV Monitor | 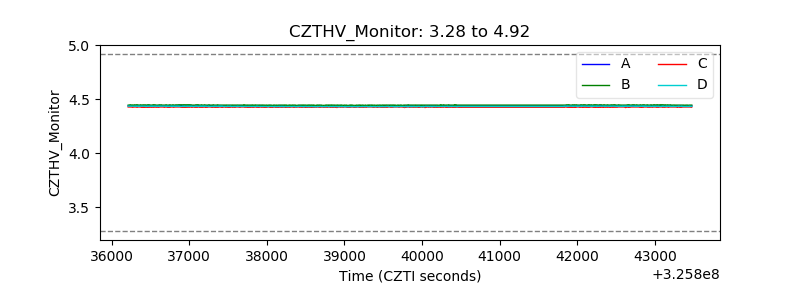 |
| D_VDD | 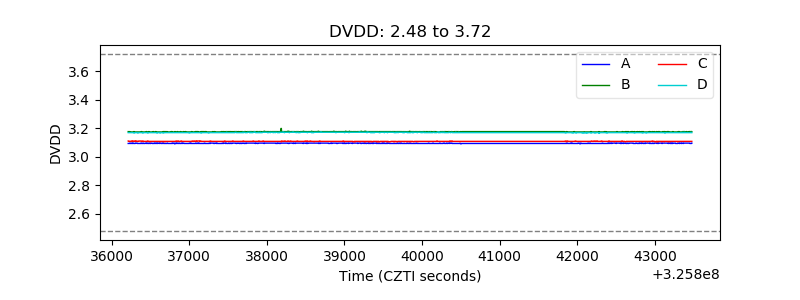 |
| Temperature 1 | 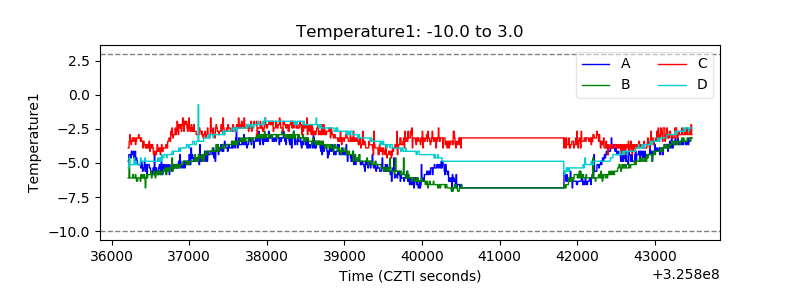 |
| Veto HV Monitor | 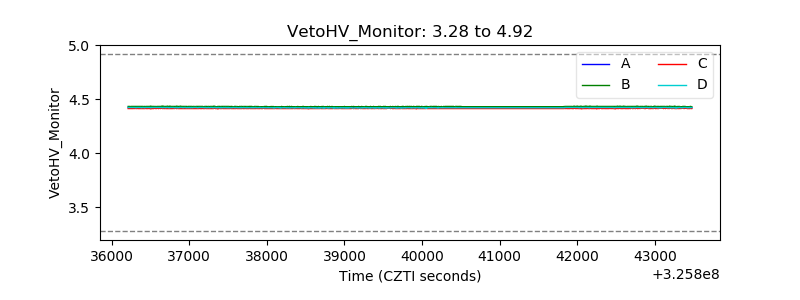 |
| Veto LLD | 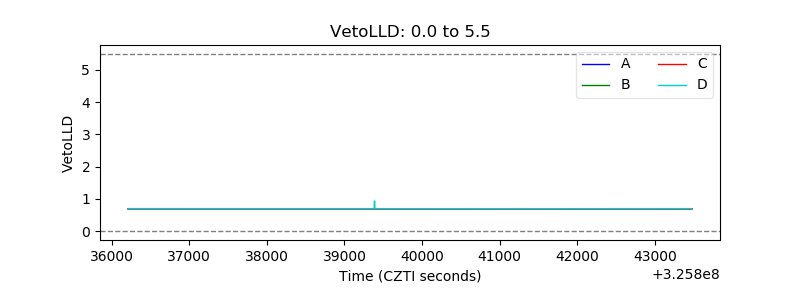 |
| Alpha Counter | 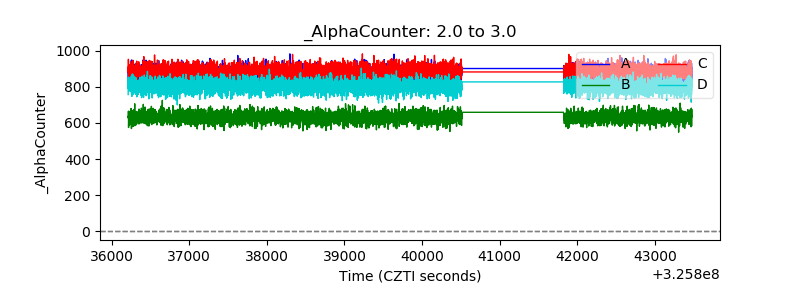 |
| _CPM_Rate | 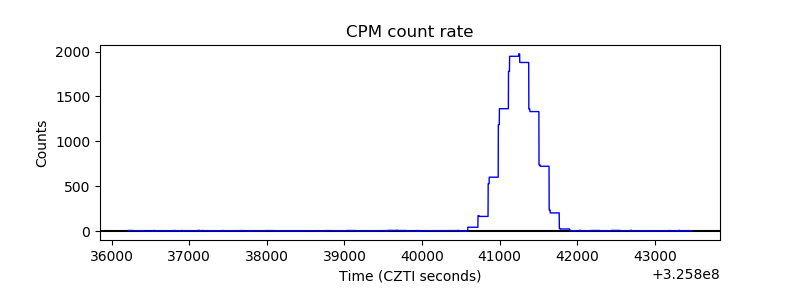 |
| CZT Counter |  |
| +2.5 Volts monitor |  |
| +5 Volts monitor |  |
| _ROLL_ROT | 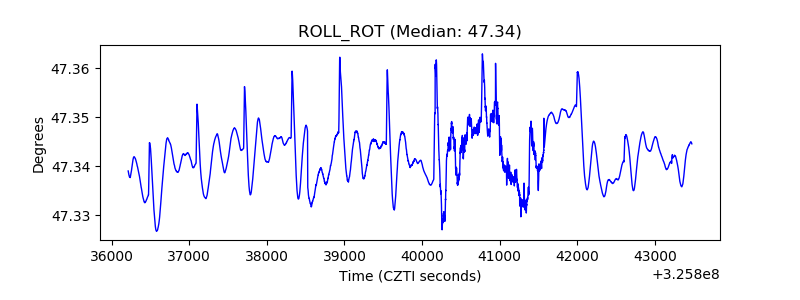 |
| _Roll_DEC | 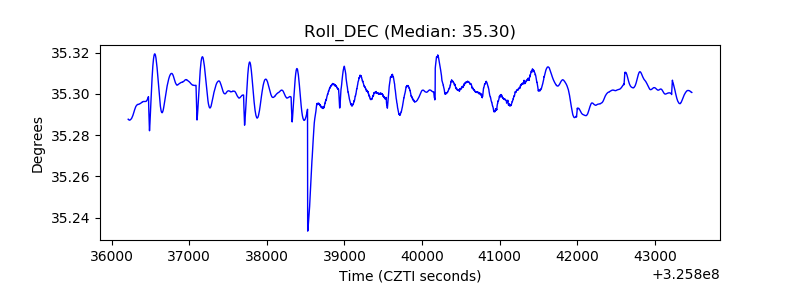 |
| _Roll_RA |  |
| Veto Counter | 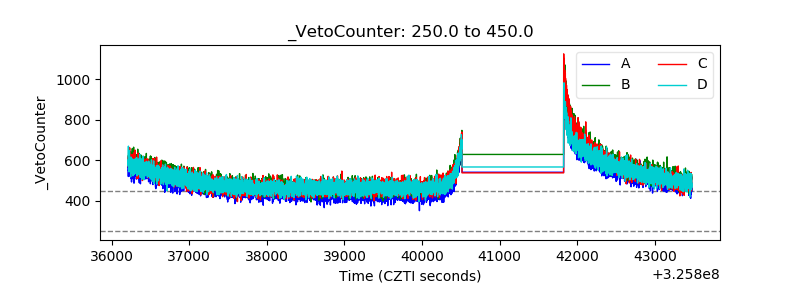 |